Table 1.1 Population and Growth Rate by Municipality/City Negros ...
Table 1.1 Population and Growth Rate by Municipality/City Negros ...
Table 1.1 Population and Growth Rate by Municipality/City Negros ...

Create successful ePaper yourself
Turn your PDF publications into a flip-book with our unique Google optimized e-Paper software.
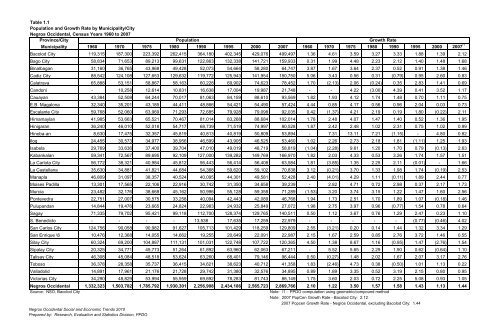
<strong>Table</strong> <strong>1.1</strong><strong>Population</strong> <strong>and</strong> <strong>Growth</strong> <strong>Rate</strong> <strong>by</strong> <strong>Municipality</strong>/<strong>City</strong><strong>Negros</strong> Occidental, Census Years 1960 to 2007Province/<strong>City</strong><strong>Population</strong><strong>Growth</strong> <strong>Rate</strong><strong>Municipality</strong> 1960 1970 1975 1980 1990 1995 2000 2007 1960 1970 1975 1980 1990 1995 2000 2007 /1Bacolod <strong>City</strong> 119,315 187,300 223,392 262,415 364,180 402,345 429,076 499,497 1.36 4.61 3.59 3.27 3.33 1.88 1.39 2.12Bago <strong>City</strong> 58,834 71,653 89,213 99,631 122,863 132,338 141,721 159,933 0.31 1.99 4.48 2.23 2.12 1.40 1.48 1.68Binalbagan 31,160 36,765 43,968 49,428 52,073 54,664 58,280 64,747 3.87 1.67 3.64 2.37 0.52 0.91 1.38 1.46Cadiz <strong>City</strong> 88,542 124,108 127,653 129,632 119,772 125,943 141,954 150,750 5.06 3.43 0.56 0.31 (0.79) 0.95 2.60 0.83Calatrava 65,888 53,151 58,867 58,163 60,228 69,902 74,623 78,452 1.70 (2.13) 2.06 (0.24) 0.35 2.83 1.41 0.69C<strong>and</strong>oni - 10,258 12,614 10,831 16,638 17,004 19,987 21,748 - - 4.22 (3.00) 4.39 0.41 3.52 <strong>1.1</strong>7Cauayan 43,384 52,508 64,244 70,017 81,063 84,159 88,610 93,569 1.82 1.93 4.12 1.74 1.48 0.70 <strong>1.1</strong>1 0.75E.B. Magalona 32,340 35,201 43,185 44,411 48,866 54,421 54,490 57,424 4.44 0.85 4.17 0.56 0.96 2.04 0.03 0.73Escalante <strong>City</strong> 59,768 52,060 63,969 71,293 72,685 79,928 79,098 92,035 0.42 (1.37) 4.21 2.19 0.19 1.80 (0.22) 2.11Himamaylan 41,985 53,663 65,521 70,467 81,014 83,268 88,684 102,014 1.78 2.48 4.07 1.47 1.40 0.52 1.36 1.95Hinigaran 36,240 46,010 52,018 54,717 68,739 71,519 74,997 80,528 1.87 2.42 2.48 1.02 2.31 0.75 1.02 0.99Hinoba-an 8,630 17,475 32,357 45,819 40,813 40,819 50,809 53,894 - 7.31 13.11 7.21 (<strong>1.1</strong>5) - 4.80 0.82Ilog 24,455 30,573 34,977 38,956 46,599 43,905 46,525 53,460 1.02 2.26 2.73 2.18 1.81 (<strong>1.1</strong>1) 1.25 1.93Isabela 29,769 33,636 37,400 39,704 47,010 49,019 48,719 58,819 (1.04) (2.28) 9.61 1.20 1.70 0.79 (0.13) 2.63Kabankalan 59,341 72,567 89,695 92,109 127,000 139,282 149,769 166,970 1.82 2.03 4.33 0.53 3.26 1.74 1.57 1.51La Carlota <strong>City</strong> 56,772 38,321 40,984 45,812 56,443 56,414 56,408 63,584 1.81 (3.85) 1.35 2.25 2.11 (0.01) - 1.66La Castellana 35,630 34,881 41,821 44,684 54,368 59,620 59,102 70,838 3.12 (0.21) 3.70 1.33 1.98 1.74 (0.19) 2.53Manapla 46,809 31,097 38,357 40,524 40,095 44,301 49,581 52,428 2.40 (4.01) 4.29 <strong>1.1</strong>1 (0.11) 1.89 2.44 0.77Moises Padilla 13,301 17,565 22,106 22,916 30,742 31,350 34,658 39,239 - 2.82 4.71 0.72 2.98 0.37 2.17 1.73Murcia 23,482 32,176 38,668 45,162 50,996 55,128 59,358 71,289 (1.53) 3.20 3.74 3.15 1.22 1.47 1.60 2.56Pontevedra 22,751 27,007 30,575 33,258 40,094 42,443 42,089 46,768 1.94 1.73 2.51 1.70 1.89 1.07 (0.18) 1.46Pulup<strong>and</strong>an 14,844 19,476 23,665 24,824 22,983 24,932 25,849 27,072 1.98 2.75 3.97 0.96 (0.77) 1.54 0.78 0.64Sagay 71,335 79,702 95,421 99,118 112,700 128,374 129,765 140,511 0.50 <strong>1.1</strong>2 3.67 0.76 1.29 2.47 0.23 <strong>1.1</strong>0S. Benedicto - - - - 13,538 17,635 17,259 22,979 - - - - - (0.77) (0.46) 4.02San Carlos <strong>City</strong> 124,756 90,058 90,982 91,627 105,713 101,429 118,259 129,809 2.55 (3.21) 0.20 0.14 1.44 1.32 3.34 1.29San Enrique \6 10,476 12,368 14,055 14,662 19,255 20,649 22,091 22,987 2.15 1.67 2.59 0.85 2.76 3.72 1.46 0.55Silay <strong>City</strong> 60,324 69,200 104,887 111,131 101,031 122,748 107,722 120,365 4.50 1.38 8.67 <strong>1.1</strong>6 (0.95) 1.47 (2.76) 1.54Sipalay <strong>City</strong> 20,325 34,771 45,773 51,264 61,892 63,960 62,063 67,211 - 5.52 5.65 2.29 1.90 0.62 (0.64) <strong>1.1</strong>0Talisay <strong>City</strong> 46,308 45,084 48,518 53,624 63,260 68,401 79,146 96,444 0.50 (0.27) 1.48 2.02 1.67 2.07 3.17 2.76Toboso 36,378 28,358 35,737 36,415 34,621 38,623 40,712 41,358 1.83 (2.46) 4.73 0.38 (0.50) 1.01 <strong>1.1</strong>3 0.22Valladolid 14,891 17,961 21,176 21,728 29,742 31,380 32,576 34,895 0.89 1.89 3.35 0.52 3.19 2.15 0.80 0.95Victorias <strong>City</strong> 34,290 48,829 53,994 55,959 69,892 78,283 81,743 88,149 1.75 3.60 2.03 0.72 2.25 5.08 0.93 1.05<strong>Negros</strong> Occidental 1,332,323 1,503,782 1,785,792 1,930,301 2,256,908 2,434,186 2,565,723 2,869,766 2.10 1.22 3.50 1.57 1.58 1.43 <strong>1.1</strong>3 1.44Source: NSO, Bacolod <strong>City</strong>Note: /1 : PPDO computation using geometric/compound methodNote: 2007 PopCen <strong>Growth</strong> <strong>Rate</strong> - Bacolod <strong>City</strong>: 2.122007 Popcen <strong>Growth</strong> <strong>Rate</strong> - <strong>Negros</strong> Occidental, excluding Bacolod <strong>City</strong>: 1.44<strong>Negros</strong> Occidental Social <strong>and</strong> Economic Trends 2010Prepared <strong>by</strong>: Research, Evaluation <strong>and</strong> Statistics Division, PPDO
<strong>Table</strong> 1.2L<strong>and</strong> Area <strong>and</strong> Density <strong>by</strong> <strong>City</strong>/<strong>Municipality</strong><strong>Negros</strong> Occidental, Census Year 1960 to 2007L<strong>and</strong>Density (persons/sq. km.)LGUs Area (Sq.Km.) 1960 1970 1975 1980 1990 1995 2000 2007Bacolod <strong>City</strong> 156.1 764.3 1,199.9 1,43<strong>1.1</strong> 1,68<strong>1.1</strong> 2,333.0 2,577.5 2,748.7 3,199.9Bago <strong>City</strong> 402.1 146.3 178.2 221.9 247.8 305.6 329.1 352.5 397.7Binalbagan 185.4 168.1 198.3 237.2 266.6 280.9 294.8 314.3 349.2Cadiz <strong>City</strong> 516.5 171.4 240.3 247.2 251.0 231.9 243.8 274.8 291.9Calatrava 439.6 149.9 120.9 133.9 132.3 137.0 159.0 169.8 178.5C<strong>and</strong>oni 191.7 - 53.5 65.8 56.5 86.8 88.7 104.3 113.4Cauayan 519.9 83.4 101.0 123.6 134.7 155.9 161.9 170.4 180.0E. B. Magalona 113.3 285.4 310.7 381.2 392.0 431.3 480.3 480.9 506.8Escalante <strong>City</strong> 125.0 478.1 416.5 511.8 570.3 581.5 639.4 632.8 736.3Himamaylan <strong>City</strong> 384.2 109.3 139.7 170.5 183.4 210.9 63.0 230.8 265.5Hinigaran 160.8 225.4 286.1 323.5 340.3 427.5 444.8 466.4 500.8Hinoba-an 424.1 20.3 41.2 76.3 108.0 96.2 96.2 119.8 127.1Ilog 281.7 86.8 108.5 124.2 138.3 165.4 155.9 165.2 189.8Isabela 177.4 167.8 189.6 210.8 223.8 265.0 276.3 274.6 331.6Kabankalan <strong>City</strong> 726.4 81.7 99.9 123.5 126.8 174.8 191.7 206.2 229.9La Carlota <strong>City</strong> 137.3 413.4 279.1 298.5 333.6 411.0 410.8 410.8 4.0La Castellana 216.5 164.6 16<strong>1.1</strong> 193.2 206.4 25<strong>1.1</strong> 275.4 273.0 327.2Manapla 112.9 414.6 275.4 339.7 358.9 355.1 392.4 439.2 464.4Moises Padilla 143.7 92.6 122.2 153.8 159.5 213.9 218.2 241.2 273.1Murcia 284.6 82.5 113.1 135.9 158.7 179.2 193.7 208.6 250.5Pontevedra 112.5 202.2 240.1 271.8 295.6 356.4 377.3 374.1 415.7Pulup<strong>and</strong>an 23.0 645.4 846.8 1,028.9 1,079.3 999.3 1,084.0 1,123.9 1,177.0Sagay <strong>City</strong> 389.6 183.1 204.6 244.9 254.4 289.3 329.5 333.1 360.7Salvador Benedicto 170.6 - - - - 79.4 103.4 101.2 134.7San Carlos <strong>City</strong> 384.0 324.9 234.5 236.9 238.6 275.3 264.1 308.0 338.0San Enrique 21.0 498.9 589.0 669.3 698.2 916.9 983.3 1,052.0 1,094.6Silay <strong>City</strong> 214.8 280.8 322.2 488.3 517.4 470.3 571.5 501.5 560.4Sipalay <strong>City</strong> 432.7 47.0 80.4 105.8 118.5 143.0 147.8 143.4 155.3Talisay <strong>City</strong> 173.4 267.1 260.0 279.8 309.3 364.8 394.5 456.4 556.2Toboso 123.4 294.8 229.8 289.6 295.1 280.6 313.0 329.9 335.2Valladolid 48.0 310.2 374.2 441.2 452.7 619.6 653.8 678.7 727.0Victorias <strong>City</strong> 133.9 256.1 364.7 403.2 417.9 522.0 584.6 610.5 658.3<strong>Negros</strong> Occidental 7,926.1 168.1 189.7 225.3 243.5 284.7 307.1 323.7 362.1Source: NSO, DENR <strong>and</strong> PPDO<strong>Negros</strong> Occidental Social <strong>and</strong> Economic Trends 2010Prepared <strong>by</strong>: Research, Evaluation <strong>and</strong> Statistics Division, PPDO
<strong>Table</strong> 1.3A.1Total <strong>Population</strong> <strong>by</strong> Age Group <strong>and</strong> <strong>by</strong> Sex<strong>Negros</strong> Occidental, Census Years 1995 <strong>and</strong> 2000Age Group1995 2000Male Female Total Male Female TotalUnder 1 32,774 30,981 63,755 31,729 29,725 61,4541 - 4 135,984 129,597 265,581 125,998 120,416 246,4145 - 9 168,337 160,005 328,342 171,385 165,095 336,48010 - 14 152,491 150,371 302,862 162,706 158,459 321,16515 - 19 136,545 132,191 268,736 141,736 136,928 278,66420 - 24 107,433 103,824 211,257 113,383 107,841 221,22425 - 29 94,753 90,974 185,727 94,625 91,097 185,72230 - 34 82,654 79,046 161,700 87,828 84,499 172,32735 - 39 74,140 72,033 146,173 81,272 76,676 157,94840 - 44 60,751 59,664 120,415 69,869 68,406 138,27545 - 49 48,174 47,157 95,331 58,351 56,479 114,83050 - 54 38,049 39,159 77,208 43,432 43,791 87,22355 - 59 33,632 35,533 69,165 35,543 37,137 72,68060 - 64 25,602 26,441 52,043 30,872 33,760 64,63265 - 69 16,379 18,642 35,021 20,918 23,028 43,94670 - 74 10,765 12,718 23,483 12,901 15,852 28,75375 <strong>and</strong> over 12,112 15,275 27,387 14,365 19,621 33,986All ages 1,230,575 1,203,611 2,434,186 1,296,913 1,268,810 2,565,723Note: Data disaggragation <strong>by</strong> sex for 2007 census is not yet availableSource: NSO, Bacolod <strong>City</strong><strong>Negros</strong> Occidental Social <strong>and</strong> Economic Trends 2010Prepared <strong>by</strong>: Research, Evaluation Statistics Division, PPDO
<strong>Table</strong> 1.3A.2Household <strong>Population</strong> <strong>by</strong> Age Groups, Sex, <strong>and</strong> <strong>City</strong>/Minicipality<strong>Negros</strong> Occidental, Census 2007Age Group2007SEXBoth Sexes Male Female RATIOALL AGES 2,367,289 1,218,737 1,148,552 106.1Under 1 57,177 29,429 27,748 106.11 - 4 224,655 115,638 109,017 106.15 - 9 291,728 150,699 141,029 106.910 - 14 302,977 154,832 148,145 104.515 - 19 266,967 142,132 124,835 113.920 - 24 185,730 101,028 84,702 119.325 - 29 160,342 85,124 75,218 113.230 - 34 146,620 76,390 70,230 108.835 - 39 145,909 75,146 70,763 106.240 - 44 130,054 67,065 62,989 106.545 - 49 114,340 58,757 55,583 105.750 - 54 96,431 48,442 47,989 100.955 - 59 74,509 37,386 37,123 100.760 - 64 53,212 25,672 27,540 93.265 - 69 46,257 21,091 25,166 83.870 - 74 33,822 15,139 18,683 81.075 - 79 19,465 8,248 11,217 73.580 <strong>and</strong> over 17,094 6,519 10,575 61.60-17 1,049,538 541,649 507,88918 <strong>and</strong> over 1,317,751 677,088 640,663Source: NSO, Bacolod <strong>City</strong><strong>Negros</strong> Occidental Social <strong>and</strong> Economic Trends 2010Prepared <strong>by</strong>: Research, Evaluation Statistics Division, PPDO
<strong>Table</strong> 1.3B.1Total <strong>Population</strong> <strong>by</strong> Age Group <strong>and</strong> <strong>by</strong> <strong>City</strong>/<strong>Municipality</strong><strong>Negros</strong> Occidental, Census 2000<strong>City</strong>/Age GroupTotal<strong>Municipality</strong>Under 1 1 - 4 5 - 9 10 - 14 15 - 19 20 -24 25 - 29 30 - 34 35 - 39 40 - 44 45 - 49 50 - 54 55 - 59 60 - 64 65 - 69 70 - 74 75 - 79 80 & OverBacolod <strong>City</strong> 429,076 9,444 37,057 47,336 46,007 47,708 41,725 34,857 32,265 28,762 25,572 21,882 16,478 12,106 10,564 6,907 4,651 2,978 2,777Bago <strong>City</strong> 141,721 3,259 13,587 18,756 17,841 15,191 11,989 10,363 9,682 8,857 7,679 6,125 4,759 4,066 3,599 2,558 1,517 1,005 888Binalbagan 58,280 1,452 5,928 7,633 7,335 6,533 4,813 3,976 3,724 3,428 3,124 2,615 2,047 1,635 1,455 1,026 750 400 406Cadiz <strong>City</strong> 141,954 3,190 13,528 18,840 18,538 15,784 12,938 10,341 9,556 8,788 7,466 6,380 4,487 3,832 3,326 2,295 1,317 708 640Calatrava 74,623 2,069 7,900 11,266 9,950 7,793 5,831 4,938 4,427 4,234 3,627 2,975 2,225 2,136 1,904 1,471 918 535 424C<strong>and</strong>oni 19,987 508 2,086 2,889 2,851 2,287 1,713 1,312 1,170 1,144 959 773 554 515 447 335 210 127 107Cauayan 88,610 2,450 9,236 13,094 12,307 10,010 6,828 5,764 5,378 5,079 4,365 3,457 2,670 2,309 2,073 1,469 941 654 526E.B. Magalona 54,490 1,223 5,084 7,364 6,996 5,661 4,472 3,883 3,722 3,309 2,933 2,439 1,927 1,598 1,406 981 688 416 388Escalante 79,098 2,073 7,499 11,164 10,226 8,334 6,309 5,383 4,919 4,569 3,961 3,364 2,690 2,553 2,237 1,530 1,039 659 589Himamaylan 88,684 2,232 8,650 12,358 11,799 9,880 7,231 5,957 5,641 5,278 4,829 3,827 2,976 2,338 2,137 1,440 974 606 531Hinigaran 74,997 1,506 6,531 9,107 9,440 8,398 6,936 5,518 5,076 4,681 4,032 3,382 2,730 2,207 1,957 1,419 923 653 501Hinoba-an 50,809 1,407 5,832 7,435 6,851 5,554 3,894 3,480 3,232 2,933 2,501 1,992 1,551 1,269 1,144 696 487 292 259Ilog 46,525 1,105 4,284 6,029 5,925 5,285 3,962 3,227 2,919 2,713 2,357 2,014 1,636 1,368 1,310 929 642 438 382Isabela 48,719 1,319 5,161 7,059 6,657 5,108 3,460 3,010 3,097 2,876 2,587 2,079 1,548 1,414 1,242 856 596 326 324Kabankalan <strong>City</strong> 149,769 3,903 15,697 21,511 20,400 16,712 12,636 10,324 9,203 8,527 7,485 6,013 4,707 3,824 3,395 2,311 1,440 857 824La Carlota <strong>City</strong> 56,408 1,142 4,727 6,455 7,005 6,177 4,996 4,267 3,908 3,498 3,191 2,698 2,206 1,824 1,604 1,077 657 476 500La Castellana 59,102 1,582 6,390 8,542 7,938 5,941 4,476 3,907 3,868 3,638 3,023 2,430 1,866 1,630 1,479 1,002 649 390 351Manapla 49,581 1,107 4,640 6,398 5,986 5,283 4,684 3,902 3,581 3,043 2,554 2,055 1,638 1,442 1,316 790 516 358 288Moises Padilla 34,658 995 3,874 4,895 4,606 3,690 2,939 2,441 2,059 1,959 1,698 1,415 1,062 941 780 540 358 220 186Murcia 59,358 1,649 5,958 7,932 7,905 6,492 4,906 4,100 3,948 3,650 3,247 2,506 1,806 1,468 1,468 953 638 364 368Pontevedra 42,089 846 3,568 5,250 5,312 4,535 3,655 2,929 2,939 2,508 2,399 2,039 1,595 1,356 1,189 805 535 343 286Pulup<strong>and</strong>an 25,849 488 2,056 2,918 2,994 2,728 2,449 2,003 1,937 1,692 1,474 1,207 1,026 843 754 513 358 220 189Sagay <strong>City</strong> 129,765 3,365 12,569 17,652 16,525 14,099 11,385 9,413 8,224 7,546 6,759 5,722 4,097 3,747 3,243 2,193 1,537 907 782Sal. Benedicto 17,259 458 1,891 2,690 2,395 1,989 1,435 1,228 1,149 973 793 656 444 356 325 222 117 70 68San Carlos <strong>City</strong> 118,259 3,076 12,669 17,125 15,175 11,873 8,965 7,933 7,402 7,084 6,347 5,255 3,684 3,399 3,173 2,170 1,430 805 694San Enrique 22,091 405 1,761 2,652 2,652 2,416 2,008 1,709 1,576 1,509 1,187 1,030 830 680 620 398 289 178 191Silay <strong>City</strong> 107,722 2,330 9,525 12,746 12,675 11,396 9,707 8,429 7,644 7,075 6,155 5,065 3,875 3,335 3,022 1,974 1,226 782 761Sipalay <strong>City</strong> 62,063 1,740 7,070 9,469 8,449 6,650 4,331 3,810 3,641 3,585 3,096 2,548 2,065 1,627 1,503 1,022 677 426 354Talisay <strong>City</strong> 79,146 1,768 7,258 9,576 8,888 8,536 7,071 5,971 5,831 5,262 4,583 3,835 2,752 2,281 2,088 1,359 927 574 586Toboso 40,712 1,090 4,346 6,173 5,605 4,233 3,027 2,655 2,440 2,363 1,935 1,712 1,301 1,170 1,021 700 447 259 235Valladolid 32,576 568 2,517 3,837 3,959 3,560 2,939 2,401 2,355 2,155 1,889 1,599 1,268 1,031 878 642 414 291 273Victorias <strong>City</strong> 81,743 1,705 7,535 10,329 9,973 8,828 7,514 6,291 5,814 5,230 4,468 3,741 2,723 2,380 1,973 1,363 885 510 481<strong>Negros</strong> Occidental 2,565,723 61,454 246,414 336,480 321,165 278,664 221,224 185,722 172,327 157,948 138,275 114,830 87,223 72,680 64,632 43,946 28,753 17,827 16,159Source: NSO, Bacolod <strong>City</strong><strong>Negros</strong> Occidental Social <strong>and</strong> Economic Trends 2010Prepared <strong>by</strong>: Research, Evaluation Statistics Division, PPDO
<strong>Table</strong> 1.3B.2Household <strong>Population</strong> <strong>by</strong> Age Group <strong>and</strong> <strong>by</strong> <strong>City</strong>/<strong>Municipality</strong><strong>Negros</strong> Occidental, Census 2007<strong>City</strong>/ <strong>Municipality</strong> TotalAge GroupUnder 1 1 - 4 5 - 9 10 - 14 15 - 19 20 -24 25 - 29 30 - 34 35 - 39 40 - 44 45 - 49 50 - 54 55 - 59 60 - 64 65 - 69 70 - 74 75 - 79 80 & OverBago <strong>City</strong> 159,645 3,697 14,786 19,111 20,272 18,028 12,407 10,940 10,292 10,254 9,166 7,777 6,457 4,925 3,586 3,097 2,302 1,328 1,220Binalbagan 64,697 1,555 6,135 7,724 8,016 7,401 5,460 4,512 3,960 3,911 3,543 3,062 2,730 2,088 1,399 1,298 899 536 468Cadiz <strong>City</strong> 150,586 3,690 14,457 18,980 19,535 17,246 11,601 9,995 9,316 9,414 8,193 7,223 6,092 4,820 3,206 2,812 2,005 1,085 916Calatrava 78,448 2,064 8,177 10,681 10,973 8,602 5,354 4,671 4,494 4,496 4,037 3,663 3,127 2,307 1,829 1,575 1,208 663 527C<strong>and</strong>oni 21,708 671 2,182 2,934 3,068 2,531 1,600 1,317 1,163 1,210 1,097 1,001 845 617 420 407 283 181 181Cauayan 93,538 2,103 9,111 12,368 13,038 10,763 7,108 5,850 5,368 5,490 4,912 4,423 3,679 2,700 2,052 1,774 1,337 781 681E.B. Magalona 57,396 1,358 5,195 6,500 7,121 6,375 4,450 3,915 3,750 3,701 3,270 2,819 2,484 1,923 1,466 1,213 888 518 450Escalante 91,918 2,122 8,799 11,791 11,998 10,801 6,933 5,873 5,331 5,448 4,794 4,257 3,624 2,945 2,350 1,895 1,430 854 673Himamaylan 101,886 2,537 10,012 12,468 12,959 11,688 8,308 7,270 6,341 6,018 5,458 4,843 4,091 3,176 2,094 1,878 1,320 767 658Hinigaran 80,517 1,701 6,838 8,947 9,387 9,351 6,639 5,804 5,137 5,173 4,620 4,184 3,535 2,813 2,047 1,677 1,243 756 665Hinoba-an 53,886 1,345 5,626 7,643 7,732 5,940 3,831 3,319 3,153 3,126 2,825 2,452 1,967 1,575 1,053 965 644 393 297Ilog 53,422 1,224 4,883 6,474 6,833 6,131 4,120 3,525 3,172 3,167 2,883 2,595 2,171 1,827 1,301 1,169 896 532 519Isabela 58,759 1,581 5,682 7,249 7,722 6,910 4,781 3,856 3,511 3,485 3,161 2,791 2,300 1,769 1,189 1,105 789 477 401Kabankalan <strong>City</strong> 166,821 4,546 17,318 21,666 22,573 18,530 13,200 10,953 10,237 9,623 8,639 7,608 6,171 4,796 3,403 2,965 2,224 1,232 1,137La Carlota <strong>City</strong> 63,462 1,375 5,088 6,570 6,916 7,187 5,494 4,695 4,337 4,251 3,726 3,341 2,812 2,388 1,649 1,374 1,058 598 603La Castellana 70,813 1,949 7,231 9,435 9,305 7,853 5,384 4,658 4,161 4,187 3,833 3,252 2,746 2,043 1,446 1,305 980 558 487Manapla 52,395 1,259 4,926 6,265 6,504 5,806 4,274 3,691 3,449 3,402 2,980 2,494 1,978 1,586 1,172 1,072 753 413 371Moises Padilla 39,239 1,014 4,128 5,517 5,342 4,258 2,912 2,490 2,380 2,215 1,999 1,783 1,481 1,185 857 663 487 258 270Murcia 70,768 1,866 7,272 8,951 8,466 7,684 5,731 5,031 4,471 4,409 3,925 3,387 2,945 2,023 1,398 1,258 950 505 496Pontevedra 46,724 1,096 4,005 5,324 5,485 5,090 3,480 3,256 2,996 3,107 2,717 2,452 2,176 1,682 1,227 1,014 784 458 375Pulup<strong>and</strong>an 27,064 582 2,316 2,852 3,013 2,842 2,160 1,944 1,797 1,840 1,667 1,421 1,243 1,016 726 644 511 252 238Sagay <strong>City</strong> 140,347 3,273 13,433 17,239 17,935 16,416 11,172 9,653 8,730 8,542 7,431 6,512 5,827 4,437 3,175 2,679 1,917 1,092 884San Carlos <strong>City</strong> 129,568 2,855 12,458 16,577 17,297 14,572 9,795 8,692 7,821 7,694 6,986 6,403 5,284 4,004 2,779 2,588 1,900 1,045 818San Enrique 22,979 441 1,795 2,472 2,713 2,657 1,885 1,553 1,480 1,594 1,417 1,275 970 806 618 509 344 240 210Silay <strong>City</strong> 120,128 2,752 10,272 12,926 13,953 13,038 10,058 8,921 8,249 8,146 6,901 6,232 5,256 4,023 2,926 2,528 1,826 1,092 1,029Sipalay <strong>City</strong> 67,163 1,755 6,868 9,622 9,895 7,651 4,582 3,935 3,619 3,760 3,424 3,134 2,470 1,924 1,423 1,254 847 561 439Talisay <strong>City</strong> 96,242 2,142 8,405 10,961 10,968 10,471 8,137 7,261 6,371 6,534 5,762 4,907 4,243 3,110 2,118 1,904 1,372 804 772Toboso 41,358 1,139 4,300 5,524 6,064 4,328 2,712 2,405 2,340 2,429 2,189 1,866 1,698 1,288 1,006 802 649 301 318Valladolid 34,852 726 2,814 3,616 3,886 3,782 2,821 2,461 2,354 2,317 2,207 1,885 1,648 1,328 979 794 551 353 330Victorias <strong>City</strong> 87,992 2,098 7,557 10,004 10,824 10,275 7,279 6,255 5,570 5,676 5,296 4,373 3,704 2,838 1,955 1,779 1,225 713 571Salvador Benedicto 22,968 661 2,586 3,337 3,184 2,760 2,062 1,641 1,270 1,290 996 925 677 547 363 260 200 119 90<strong>Negros</strong> Occidental 2,367,289 57,177 224,655 291,728 302,977 266,967 185,730 160,342 146,620 145,909 130,054 114,340 96,431 74,509 53,212 46,257 33,822 19,465 17,094Source: NSO, Bacolod <strong>City</strong><strong>Negros</strong> Occidental Social <strong>and</strong> Economic Trends 2010Prepared <strong>by</strong>: Research, Evaluation Statistics Division, PPDO
<strong>Table</strong> 1.4A<strong>Population</strong> Projection <strong>by</strong> <strong>City</strong>/<strong>Municipality</strong><strong>Negros</strong> Occidental, 2007 to 2025<strong>City</strong>/ <strong>Municipality</strong> 2007 2008 2009 2010 2011 2012 2013 2014 2015 2016 2017 2018 2019 2020 2021 2022 2023 2024 2025Bacolod <strong>City</strong> 499,497 510,086 520,900 531,943 543,220 554,737 566,497 578,507 590,771 603,296 616,085 629,146 642,484 656,105 670,014 684,219 698,724 713,537 728,664Bago <strong>City</strong> 159,933 162,236 164,572 166,942 169,346 171,785 174,258 176,768 179,313 181,895 184,514 187,172 189,867 192,601 195,374 198,188 201,042 203,937 209,852Binalbagan 64,747 65,679 66,625 67,585 68,558 69,545 70,546 71,562 72,593 73,638 74,699 75,774 76,865 77,972 79,095 80,234 81,389 82,561 84,956Cadiz <strong>City</strong> 150,750 152,921 155,123 157,357 159,623 161,921 164,253 166,618 169,017 171,451 173,920 176,425 178,965 181,542 184,156 186,808 189,498 192,227 197,803Calatrava 78,452 79,582 80,728 81,890 83,069 84,266 85,479 86,710 87,959 89,225 90,510 91,813 93,135 94,477 95,837 97,217 98,617 100,037 102,939C<strong>and</strong>oni 21,748 22,061 22,379 22,701 23,028 23,360 23,696 24,037 24,383 24,734 25,091 25,452 25,818 26,190 26,567 26,950 27,338 27,732 28,536Cauayan 93,569 94,916 96,283 97,670 99,076 100,503 101,950 103,418 104,907 106,418 107,950 109,505 111,082 112,681 114,304 115,950 117,620 119,313 122,774E.B. Magalona 57,424 58,251 59,090 59,941 60,804 61,679 62,568 63,468 64,382 65,310 66,250 67,204 68,172 69,153 70,149 71,159 72,184 73,224 75,348Escalante 92,035 93,360 94,705 96,068 97,452 98,855 100,279 101,723 103,187 104,673 106,181 107,710 109,261 110,834 112,430 114,049 115,691 117,357 120,762Himamaylan 102,014 103,483 104,973 106,485 108,018 109,574 111,151 112,752 114,376 116,023 117,693 119,388 121,107 122,851 124,620 126,415 128,235 130,082 133,855Hinigaran 80,528 81,688 82,864 84,057 85,268 86,495 87,741 89,004 90,286 91,586 92,905 94,243 95,600 96,977 98,373 99,790 101,227 102,684 105,663Hinoba-an 53,894 54,670 55,457 56,256 57,066 57,888 58,721 59,567 60,425 61,295 62,177 63,073 63,981 64,902 65,837 66,785 67,747 68,722 70,716Ilog 53,460 54,230 55,011 55,803 56,606 57,422 58,248 59,087 59,938 60,801 61,677 62,565 63,466 64,380 65,307 66,247 67,201 68,169 70,146Isabela 58,819 59,666 60,525 61,397 62,281 63,178 64,087 65,010 65,946 66,896 67,859 68,837 69,828 70,833 71,853 72,888 73,938 75,002 77,178Kabankalan 166,970 169,374 171,813 174,287 176,797 179,343 181,926 184,545 187,203 189,899 192,633 195,407 198,221 201,075 203,971 206,908 209,887 212,910 219,086La Carlota <strong>City</strong> 63,584 64,500 65,428 66,371 67,326 68,296 69,279 70,277 71,289 72,315 73,357 74,413 75,485 76,572 77,674 78,793 79,927 81,078 83,430La Castellana 70,838 71,858 72,893 73,942 75,007 76,087 77,183 78,294 79,422 80,566 81,726 82,903 84,096 85,307 86,536 87,782 89,046 90,328 92,948Manapla 52,428 53,183 53,949 54,726 55,514 56,313 57,124 57,947 58,781 59,627 60,486 61,357 62,241 63,137 64,046 64,968 65,904 66,853 68,792M. Padilla 39,239 39,804 40,377 40,959 41,548 42,147 42,754 43,369 43,994 44,627 45,270 45,922 46,583 47,254 47,934 48,625 49,325 50,035 51,487Murcia 71,289 72,316 73,357 74,413 75,485 76,572 77,674 78,793 79,928 81,078 82,246 83,430 84,632 85,850 87,087 88,341 89,613 90,903 93,540Pontevedra 46,768 47,441 48,125 48,818 49,521 50,234 50,957 51,691 52,435 53,190 53,956 54,733 55,521 56,321 57,132 57,955 58,789 59,636 61,366Pulup<strong>and</strong>an 27,072 27,462 27,857 28,258 28,665 29,078 29,497 29,922 30,352 30,790 31,233 31,683 32,139 32,602 33,071 33,547 34,030 34,521 35,522Sagay 140,511 142,534 144,587 146,669 148,781 150,923 153,097 155,301 157,538 159,806 162,107 164,442 166,810 169,212 171,648 174,120 176,627 179,171 184,368S. Benedicto 22,979 23,310 23,646 23,986 24,331 24,682 25,037 25,398 25,764 26,135 26,511 26,893 27,280 27,673 28,071 28,475 28,885 29,301 30,151San Carlos <strong>City</strong> 129,809 131,678 133,574 135,498 137,449 139,428 141,436 143,473 145,539 147,635 149,760 151,917 154,105 156,324 158,575 160,858 163,175 165,524 170,326San Enrique 22,987 23,318 23,654 23,994 24,340 24,690 25,046 25,407 25,772 26,144 26,520 26,902 27,289 27,682 28,081 28,485 28,895 29,312 30,162Silay <strong>City</strong> 120,365 122,098 123,856 125,640 127,449 129,284 131,146 133,035 134,950 136,894 138,865 140,865 142,893 144,951 147,038 149,155 151,303 153,482 157,934Sipalay 67,211 68,179 69,161 70,157 71,167 72,192 73,231 74,286 75,355 76,441 77,541 78,658 79,791 80,939 82,105 83,287 84,487 85,703 88,189Talisay 96,444 97,833 99,242 100,671 102,120 103,591 105,083 106,596 108,131 109,688 111,267 112,870 114,495 116,144 117,816 119,513 121,234 122,979 126,547Toboso 41,358 41,954 42,558 43,171 43,792 44,423 45,062 45,711 46,370 47,037 47,715 48,402 49,099 49,806 50,523 51,251 51,989 52,737 54,267Valladolid 34,895 35,397 35,907 36,424 36,949 37,481 38,021 38,568 39,123 39,687 40,258 40,838 41,426 42,023 42,628 43,242 43,864 44,496 45,787Victorias 88,149 89,418 90,706 92,012 93,337 94,681 96,045 97,428 98,831 100,254 101,697 103,162 104,647 106,154 107,683 109,234 110,807 112,402 115,663Neg. Occ w/o Bcd 2,370,269 2,404,401 2,439,024 2,474,146 2,509,774 2,545,915 2,582,576 2,619,765 2,657,490 2,695,757 2,734,576 2,773,954 2,813,899 2,854,419 2,895,523 2,937,218 2,979,514 3,022,419 3,065,942Neg. Occ. 2,869,766 2,914,487 2,959,924 3,006,089 3,052,994 3,100,651 3,149,073 3,198,272 3,248,261 3,299,053 3,350,662 3,403,101 3,456,383 3,510,524 3,565,537 3,621,437 3,678,239 3,735,957 3,794,606Source: NSO, Bacolod <strong>City</strong><strong>Negros</strong> Occidental Social <strong>and</strong> Economic Trends 2010Prepared <strong>by</strong>: Research, Evaluation Statistics Division, PPDO
<strong>Table</strong> 1.4B - continued<strong>Table</strong> 1.4BProjected Total <strong>Population</strong> <strong>by</strong> Single-Year Age Classification<strong>Negros</strong> Occidental, 2000, 2007 to 2012Ages 2000 2007 2008 2009 2010 2011 201252 13,795 15,303 15,524 15,747 15,974 16,204 16,43753 12,552 13,924 14,125 14,328 14,535 14,744 14,95654 11,605 12,874 13,059 13,247 13,438 13,632 13,82855 11,913 13,216 13,406 13,599 13,795 13,993 14,19556 11,509 12,767 12,951 13,138 13,327 13,519 13,71457 13,604 15,091 15,309 15,529 15,753 15,980 16,21058 12,114 13,439 13,632 13,828 14,027 14,229 14,43459 11,434 12,684 12,867 13,052 13,240 13,431 13,62460 12,997 14,418 14,626 14,836 15,050 15,267 15,48761 10,050 11,149 11,309 11,472 11,637 11,805 11,97562 10,735 11,909 12,080 12,254 12,431 12,610 12,79163 10,376 11,511 11,676 11,844 12,015 12,188 12,36364 9,910 10,994 11,152 11,312 11,475 11,641 11,80865 9,185 10,189 10,336 10,485 10,636 10,789 10,94466 7,816 8,671 8,795 8,922 9,051 9,181 9,31367 7,666 8,504 8,627 8,751 8,877 9,005 9,13468 5,847 6,486 6,580 6,674 6,771 6,868 6,96769 6,525 7,238 7,343 7,448 7,556 7,664 7,77570 6,707 7,440 7,547 7,656 7,766 7,878 7,99271 4,557 5,055 5,128 5,202 5,277 5,353 5,43072 4,877 5,410 5,488 5,567 5,647 5,729 5,81173 3,914 4,342 4,404 4,468 4,532 4,598 4,66474 4,047 4,490 4,554 4,620 4,686 4,754 4,82275 4,068 4,513 4,578 4,644 4,711 4,778 4,84776 3,016 3,346 3,394 3,443 3,492 3,543 3,59477 2,710 3,006 3,050 3,094 3,138 3,183 3,22978 2,428 2,693 2,732 2,772 2,812 2,852 2,89379 2,627 2,914 2,956 2,999 3,042 3,086 3,13080 2,542 2,820 2,861 2,902 2,944 2,986 3,02981 1,454 1,613 1,636 1,660 1,684 1,708 1,73382 1,409 1,563 1,586 1,608 1,632 1,655 1,67983 1,127 1,250 1,268 1,286 1,305 1,324 1,34384 1,040 1,154 1,170 1,187 1,204 1,222 1,23985 1,137 1,261 1,279 1,298 1,317 1,336 1,35586 798 885 898 911 924 937 95187 1,035 1,148 1,165 1,181 1,198 1,216 1,23388 768 852 864 877 889 902 91589 476 528 536 543 551 559 56790 385 427 433 439 446 452 45991 200 222 225 228 232 235 23892 238 264 268 272 276 280 28493 130 144 146 148 151 153 15594 98 109 110 112 113 115 11795 122 135 137 139 141 143 14596 67 74 75 76 78 79 8097 66 73 74 75 76 78 7998 76 84 86 87 88 89 9199 149 165 168 170 173 175 178100 12 13 14 14 14 14 14101&over 53 59 60 61 61 62 63All Ages (in millions) 2,136,647 2,370,269 2,404,401 2,439,024 2,474,146 2,509,774 2,545,915Note: /1 - Single age population is estimated based on the single age population in 2000./2 - Single age population is projected based on the population projection using 1.44 growth rate <strong>and</strong>on the single age population in 2000.Source: NSO-Bacolod <strong>City</strong> <strong>and</strong> PPDO<strong>Negros</strong> Occidental Social <strong>and</strong> Economic Trends 2010Prepared <strong>by</strong>: Research, Evaluation <strong>and</strong> Statistics Division, PPDO
<strong>Table</strong> 1.5A<strong>Negros</strong> Occidental Age Dependency Ratio1995 <strong>and</strong> 2000Indicators 1995 2000 2007Young - Age Dependency Ratio 69.22 64.65 63.79Old - Age Dependency Ratio 7.14 7.14 8.49Age Dependency Ratio 75.40 71.79 72.28Source: NSO <strong>and</strong> PPDO<strong>Table</strong> 1.5BAge Dependency Ratio <strong>by</strong> <strong>City</strong>/<strong>Municipality</strong><strong>Negros</strong> Occidental, 2000Age Dependency RatioLGUsYoung-AgeOld-Age2000 20072000 2007 2000 2007Bago <strong>City</strong> 72.18 70.14 64.93 61.67 7.25 8.47Binalbagan 74.75 69.96 67.01 61.55 7.74 8.41Cadiz <strong>City</strong> 71.24 72.88 65.26 65.05 5.98 7.83Calatrava 86.14 84.24 77.79 74.91 8.35 9.33C<strong>and</strong>oni 83.81 83.95 76.64 75.04 7.16 8.91Cauayan 84.86 78.70 77.37 69.96 7.49 8.74E. B. Magalona 73.81 68.06 65.92 59.07 7.89 8.99Escalante <strong>City</strong> 78.47 75.56 69.86 66.30 8.61 9.27Himamaylan <strong>City</strong> 77.04 71.85 69.95 64.05 7.09 7.80Hinigaran 66.97 63.31 59.18 54.51 7.78 8.80Hinoba-an 84.42 84.28 78.13 76.42 6.29 7.86Ilog 73.66 72.93 64.73 62.84 8.92 10.09Isabela 84.39 74.09 76.44 65.87 7.96 8.21Kabankalan <strong>City</strong> 80.82 79.07 74.27 70.96 6.56 8.11La Carlota <strong>City</strong> 64.12 59.13 56.24 50.02 7.89 9.11La Castellana 83.22 69.94 75.80 70.57 7.42 8.42Manapla 68.08 69.94 61.47 61.48 6.62 8.46Moises Padilla 82.56 82.00 75.70 74.22 6.87 7.78Murcia 76.71 72.59 69.79 64.76 6.92 7.83Pontevedra 67.39 65.79 59.56 56.45 7.83 9.34Pulup<strong>and</strong>an 60.42 62.49 52.48 52.61 7.94 9.88Sagay <strong>City</strong> 74.80 71.37 67.50 63.35 7.30 8.02Salvador Benedicto 84.63 83.29 79.53 77.95 5.10 5.34San Carlos <strong>City</strong> 81.62 75.02 73.78 66.44 7.83 8.58San Enrique 62.85 61.20 55.07 52.06 7.78 9.14Silay <strong>City</strong> 63.95 62.89 56.73 54.11 7.22 8.78Sipalay <strong>City</strong> 88.89 86.97 81.35 78.34 7.55 8.63Talisay <strong>City</strong> 64.17 63.36 57.02 55.12 7.15 8.24Toboso 86.27 85.79 78.76 76.49 7.51 9.30Valladolid 62.27 60.00 54.20 50.69 8.07 9.31Victorias <strong>City</strong> 66.95 83.29 60.34 57.28 6.62 8.06<strong>Negros</strong> Occidental 71.79 72.28 64.65 63.79 7.14 8.49Source: NSO <strong>and</strong> PPDO<strong>Negros</strong> Occidental Social <strong>and</strong> Economic Trends 2010Prepared <strong>by</strong>: Research, Evaluation <strong>and</strong> Statistics Division, PPDO
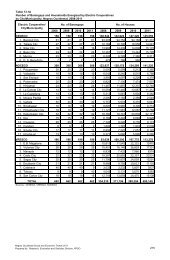
<strong>Table</strong> 1.6Number of Households <strong>and</strong> Average Household Size <strong>by</strong> <strong>City</strong>/<strong>Municipality</strong><strong>Negros</strong> Occidental, Census Years 1990, 1995, 2000 <strong>and</strong> 20071990 1995 2000 2007LGUsNo. of HH Ave HH Size No. of HH Ave HH Size No. of HH Ave HH Size No. of HH Ave HH SizeBago <strong>City</strong> 22,354 5.5 25,279 5.2 27,965 5.07 32,309 4.94Binalbagan 9,055 5.7 10,277 5.3 11,092 5.25 12,837 5.04Cadiz <strong>City</strong> 21,746 5.5 24,407 5.2 26,998 5.26 29,568 5.09Calatrava 11,878 5.1 14,176 4.9 15,151 4.92 16,167 4.85C<strong>and</strong>oni 2,973 5.6 3,164 5.4 3,710 5.39 4,224 5.14Cauayan 14,572 5.6 15,664 5.4 16,704 5.30 18,545 5.04E. B. Magalona 8,693 5.6 10,098 5.4 10,498 5.19 11,681 4.91Escalante <strong>City</strong> 14,237 5.1 15,616 5.1 16,160 4.89 18,644 4.93Himamaylan <strong>City</strong> 14,358 5.6 15,132 5.5 16,878 5.25 20,559 4.96Hinigaran 12,181 5.6 13,201 5.4 14,342 5.23 16,134 4.99Hinoba-an 7,307 5.6 7,724 5.3 9,783 5.19 10,310 5.23Ilog 8,174 5.7 8,387 5.2 9,141 5.08 10,847 4.93Isabela 8,354 5.6 9,379 5.2 9,469 5.15 11,509 5.11Kabankalan <strong>City</strong> 22,625 5.6 25,120 5.5 27,851 5.38 31,857 5.24La Carlota <strong>City</strong> 9,598 5.9 10,554 5.3 11,082 5.09 12,906 4.92La Castellana 10,110 5.4 11,544 5.2 11,771 5.02 14,027 5.05Manapla 7,189 5.6 8,248 5.4 9,512 5.21 10,487 5.00Moises Padilla 5,517 5.6 6,071 5.2 6,376 5.44 7,547 5.20Murcia 9,361 5.4 10,602 5.2 11,644 5.09 14,682 4.82Pontevedra 7,344 5.5 8,206 5.2 8,554 4.92 9,923 4.71Pulup<strong>and</strong>an 4,314 5.3 4,851 5.1 5,175 4.99 5,803 4.66Sagay <strong>City</strong> 21,185 5.3 24,884 5.2 25,301 5.13 27,648 5.08Salvador Benedicto 2,433 5.5 3,367 5.2 3,456 4.99 4,240 5.42San Carlos <strong>City</strong> 19,889 5.3 20,390 5.0 23,941 4.93 26,230 4.94San Enrique 3,424 5.6 3,922 5.3 4,419 5.00 4,697 4.89Silay <strong>City</strong> 14,144 5.6 23,105 5.3 21,446 5.02 24,382 4.93Sipalay <strong>City</strong> 10,990 5.6 12,159 5.3 11,955 5.19 12,880 5.21Talisay <strong>City</strong> 11,414 5.5 13,332 15,774 5.02 19,811 4.86Toboso 6,525 5.3 7,371 5.2 8,060 5.05 8,457 4.89Valladolid 5,598 5.3 6,164 5.1 6,653 4.90 7,615 4.58Victorias <strong>City</strong> 12,161 5.7 14,840 5.3 15,361 5.32 16,817 5.23<strong>Negros</strong> Occidental 339,703 5.5 387,234 5.2 416,222 5.32 473,343 5.00Source: NSO, Bacolod <strong>City</strong><strong>Negros</strong> Occidental Social <strong>and</strong> Economic Trends 2010Prepared <strong>by</strong>: Research, Evaluation <strong>and</strong> Statistics Division, PPDO
<strong>Table</strong> 1.7AMarital Status of Total <strong>Population</strong> 10 Years Old & Over <strong>by</strong> Age Group <strong>and</strong> <strong>by</strong> Sex<strong>Negros</strong> Occidental, Census Year 2000Age Group/SexTotal<strong>Population</strong>10 YearsOld & OverMALE MARITAL STATUSSingle Married Widowed Divorced/SeparatedCommon-Law/Live-inUnknownMale 967,801 476,835 423,964 22,215 4,980 30,019 9,788Below 20 304,442 292,855 4,127 234 88 1,636 5,50220 - 24 113,383 89,274 17,548 194 177 4,620 1,57025 - 29 94,625 44,135 43,735 270 364 5,216 90530 - 34 87,828 21,405 60,639 519 581 4,214 47035 - 39 81,272 11,384 64,347 849 688 3,658 34640 - 44 69,869 6,372 58,187 1,322 753 2,999 23645 - 49 58,351 4,033 49,576 1,598 661 2,328 15550 - 54 43,432 2,611 36,626 1,990 517 1,562 12655 - 59 35,543 1,731 29,618 2,348 403 1,325 11860 - 64 30,872 1,279 25,042 3,117 321 1,021 9265 - 69 20,918 777 16,431 2,765 191 667 8770 - 74 12,901 464 9,385 2,494 112 371 7575 - 79 7,844 263 5,236 2,016 70 215 4480 <strong>and</strong> over 6,521 252 3,467 2,499 54 187 62Female 953,574 412,250 429,385 65,146 8,220 29,171 9,402Below 20 295,387 275,610 10,192 317 230 3,572 5,46620 - 24 107,841 66,945 33,510 321 589 5,145 1,33125 - 29 91,097 28,779 55,681 624 904 4,347 76230 - 34 84,499 13,142 65,043 1,201 1,028 3,657 42835 - 39 76,676 7,642 62,289 1,994 1,158 3,316 27740 - 44 68,406 5,152 55,534 3,453 1,160 2,873 23445 - 49 56,479 3,693 44,764 4,705 1,015 2,163 13950 - 54 43,791 2,891 32,688 5,927 696 1,463 12655 - 59 37,137 2,326 25,804 7,290 540 1,051 12660 - 64 33,760 2,263 20,643 9,580 425 716 13365 - 69 23,028 1,479 12,073 8,706 230 425 11570 - 74 15,852 1,063 6,486 7,872 118 230 8375 - 79 9,983 647 2,868 6,231 64 112 6180 <strong>and</strong> over 9,638 618 1,810 6,925 63 101 121Total 1,921,375 889,085 853,349 87,361 13,200 59,190 19,190Below 20 599,829 568,465 14,319 551 318 5,208 10,96820 - 24 221,224 156,219 51,058 515 766 9,765 2,90125 - 29 185,722 72,914 99,416 894 1,268 9,563 1,66730 - 34 172,327 34,547 125,682 1,720 1,609 7,871 89835 - 39 157,948 19,026 126,636 2,843 1,846 6,974 62340 - 44 138,275 11,524 113,721 4,775 1,913 5,872 47045 - 49 114,830 7,726 94,340 6,303 1,676 4,491 29450 - 54 87,223 5,502 69,314 7,917 1,213 3,025 25255 - 59 72,680 4,057 55,422 9,638 943 2,376 24460 - 64 64,632 3,542 45,685 12,697 746 1,737 22565 - 69 43,946 2,256 28,504 11,471 421 1,092 20270 - 74 28,753 1,527 15,871 10,366 230 601 15875 - 79 17,827 910 8,104 8,247 134 327 10580 <strong>and</strong> over 16,159 870 5,277 9,424 117 288 183Source: NSO<strong>Negros</strong> Occidental Social <strong>and</strong> Economic Trends 2010Prepared <strong>by</strong>: Research, Evaluation <strong>and</strong> Statistics Division, PPDO
<strong>Table</strong> 1.7BMarital Status of Household <strong>Population</strong> 10 Years Old & Over <strong>by</strong> Age Group <strong>and</strong> <strong>by</strong> Sex<strong>Negros</strong> Occidental, Census Year 2007Age Group/SexHousehold<strong>Population</strong>10 YearsOld & OverMALE MARITAL STATUSSingle Married Widowed Divorced/SeparatedCommon-Law/Live-inUnknownTotal 1,793,729 848,838 787,748 88,142 13,419 50,779 4,803Below 20 569,944 552,419 8,404 458 380 5,690 2,59320 - 24 185,730 130,248 41,760 297 744 12,038 64325 - 29 160,342 64,524 83,505 704 1,162 10,072 37530 - 34 146,620 32,727 104,314 1,386 1,563 6,398 23235 - 39 145,909 21,616 115,021 2,398 1,901 4,794 17940 - 44 130,054 14,239 106,273 4,047 1,851 3,496 14845 - 49 114,340 10,190 93,682 5,776 1,809 2,748 13550 - 54 96,431 7,123 77,230 8,470 1,424 2,094 9055 - 59 74,509 5,146 57,197 9,675 1,053 1,354 8460 - 64 53,212 3,434 37,543 10,707 619 825 8465 - 69 46,257 2,877 29,839 12,393 491 599 5870 - 74 33,822 1,972 18,770 12,441 200 369 7075 - 79 19,465 1,170 8,965 8,979 137 181 3380 <strong>and</strong> over 17,094 1,153 5,245 10,411 85 121 79Male 922,971 476,967 390,690 22,528 5,582 24,792 2,412Below 20 296,964 292,314 1,820 217 144 1,135 1,33420 - 24 101,028 81,250 13,781 102 196 5,345 35425 - 29 85,124 42,104 36,458 269 363 5,730 20030 - 34 76,390 21,523 49,985 482 581 3,701 11835 - 39 75,146 14,287 56,636 772 753 2,607 9140 - 44 67,065 8,971 54,191 1,234 829 1,771 6945 - 49 58,757 6,112 48,753 1,622 826 1,388 5650 - 54 48,442 3,864 40,593 2,206 655 1,085 3955 - 59 37,386 2,640 31,108 2,353 512 739 3460 - 64 25,672 1,476 20,699 2,698 283 480 3665 - 69 21,091 1,099 16,523 2,841 226 383 1970 - 74 15,139 659 11,059 3,074 100 228 1975 - 79 8,248 328 5,593 2,117 73 126 1180 <strong>and</strong> over 6,519 340 3,491 2,541 41 74 32Female 870,758 371,871 397,058 65,614 7,837 25,987 2,391Below 20 272,980 260,105 6,584 241 236 4,555 1,25920 - 24 84,702 48,998 27,979 195 548 6,693 28925 - 29 75,218 22,420 47,047 435 799 4,342 17530 - 34 70,230 11,204 54,329 904 982 2,697 11435 - 39 70,763 7,329 58,385 1,626 1,148 2,187 8840 - 44 62,989 5,268 52,082 2,813 1,022 1,725 7945 - 49 55,583 4,078 44,929 4,154 983 1,360 7950 - 54 47,989 3,259 36,637 6,264 769 1,009 5155 - 59 37,123 2,506 26,089 7,322 541 615 5060 - 64 27,540 1,958 16,844 8,009 336 345 4865 - 69 25,166 1,778 13,316 9,552 265 216 3970 - 74 18,683 1,313 7,711 9,367 100 141 5175 - 79 11,217 842 3,372 6,862 64 55 2280 <strong>and</strong> over 10,575 813 1,754 7,870 44 47 47Source: NSO<strong>Negros</strong> Occidental Social <strong>and</strong> Economic Trends 2010Prepared <strong>by</strong>: Research, Evaluation Statistics Division, PPDO
<strong>Table</strong> 1.8ANumber of Households <strong>and</strong> Average Household Size <strong>by</strong> <strong>City</strong>/<strong>Municipality</strong><strong>Negros</strong> Occidental, Census Years 1990, 1995, 2000 <strong>and</strong> 20071990 1995 20002007LGUsAve HHAve HHAve HHAve HHNo. of HHNo. of HHNo. of HHNo. of HHSizeSizeSizeSizeBago <strong>City</strong> 22,354 5.5 25,279 5.2 27,965 5.07 32,309 4.94Binalbagan 9,055 5.7 10,277 5.3 11,092 5.25 12,837 5.04Cadiz <strong>City</strong> 21,746 5.5 24,407 5.2 26,998 5.26 29,568 5.09Calatrava 11,878 5.1 14,176 4.9 15,151 4.92 16,167 4.85C<strong>and</strong>oni 2,973 5.6 3,164 5.4 3,710 5.39 4,224 5.14Cauayan 14,572 5.6 15,664 5.4 16,704 5.30 18,545 5.04E. B. Magalona 8,693 5.6 10,098 5.4 10,498 5.19 11,681 4.91Escalante <strong>City</strong> 14,237 5.1 15,616 5.1 16,160 4.89 18,644 4.93Himamaylan <strong>City</strong> 14,358 5.6 15,132 5.5 16,878 5.25 20,559 4.96Hinigaran 12,181 5.6 13,201 5.4 14,342 5.23 16,134 4.99Hinoba-an 7,307 5.6 7,724 5.3 9,783 5.19 10,310 5.23Ilog 8,174 5.7 8,387 5.2 9,141 5.08 10,847 4.93Isabela 8,354 5.6 9,379 5.2 9,469 5.15 11,509 5.11Kabankalan <strong>City</strong> 22,625 5.6 25,120 5.5 27,851 5.38 31,857 5.24La Carlota <strong>City</strong> 9,598 5.9 10,554 5.3 11,082 5.09 12,906 4.92La Castellana 10,110 5.4 11,544 5.2 11,771 5.02 14,027 5.05Manapla 7,189 5.6 8,248 5.4 9,512 5.21 10,487 5.00Moises Padilla 5,517 5.6 6,071 5.2 6,376 5.44 7,547 5.20Murcia 9,361 5.4 10,602 5.2 11,644 5.09 14,682 4.82Pontevedra 7,344 5.5 8,206 5.2 8,554 4.92 9,923 4.71Pulup<strong>and</strong>an 4,314 5.3 4,851 5.1 5,175 4.99 5,803 4.66Sagay <strong>City</strong> 21,185 5.3 24,884 5.2 25,301 5.13 27,648 5.08Salvador Benedicto 2,433 5.5 3,367 5.2 3,456 4.99 4,240 5.42San Carlos <strong>City</strong> 19,889 5.3 20,390 5.0 23,941 4.93 26,230 4.94San Enrique 3,424 5.6 3,922 5.3 4,419 5.00 4,697 4.89Silay <strong>City</strong> 14,144 5.6 23,105 5.3 21,446 5.02 24,382 4.93Sipalay <strong>City</strong> 10,990 5.6 12,159 5.3 11,955 5.19 12,880 5.21Talisay <strong>City</strong> 11,414 5.5 13,332 15,774 5.02 19,811 4.86Toboso 6,525 5.3 7,371 5.2 8,060 5.05 8,457 4.89Valladolid 5,598 5.3 6,164 5.1 6,653 4.90 7,615 4.58Victorias <strong>City</strong> 12,161 5.7 14,840 5.3 15,361 5.32 16,817 5.23<strong>Negros</strong> Occidental 339,703 5.5 387,234 5.2 416,222 5.32 473,343 5.00Source: NSO, Bacolod <strong>City</strong><strong>Negros</strong> Occidental Social <strong>and</strong> Economic Trends 2010Prepared <strong>by</strong>: Research, Evaluation <strong>and</strong> Statistics Division, PPDO
<strong>Table</strong> 1.8BHousehold <strong>Population</strong> <strong>by</strong> Religious Affiliation <strong>and</strong> <strong>by</strong> Sex<strong>Negros</strong> Occidental, Census Year 2000Religious Affiliation Both Sexes Male FemaleRoman Catholic 367,705 180,483 187,222Aglipayan 1,804,628 920,562 884,066Islam 65,255 33,549 31,706Iglesia ni Cristo 9,468 4,629 4,839United Church of Christ in the Philippines 36,252 18,422 17,830Lutheran Church in the Philippines 8,962 4,468 4,494Philippine Episcopal Church 327 157 170Iglesia Evangelista Methodista en Las Filipinas 398 180 218United Methodist Church 1,022 492 530Other Methodist 269 128 141Salvation Army, Philippines 669 341 328Convention of the Philippine Baptist Church 11,081 5,193 5,888Other Protestant 39,571 19,541 20,030Buddhist 10,699 5,290 5,409Church of Jesus Christ of the Latter Day Saints 3,545 1,677 1,868Jehovah's Witness 9,903 4,775 5,128Philippine Benevolent Missionaries Association 6,288 3,016 3,272Seventh Day Adventist 6,764 3,172 3,592Evangelicals 35,434 17,082 18,352Bible Baptist 44,164 21,741 22,423Southern Baptist 16,930 8,366 8,564Association of Baptist Churches in Luzon,Visayas <strong>and</strong> Mindanao 613 287 326Association of Fundamental Baptist Church in the Philippines 4,244 2,004 2,240International Baptist Missionary Fellowship 23,638 11,563 12,075Missionary Baptist Churches of the Philippines 902 413 489Other Baptist 4,890 2,326 2,564Tribal Religions 6,982 3,447 3,535Others 2,601 1,226 1,375None 31,362 15,744 15,618Unknown 1,023 514 509<strong>Negros</strong> Occidental 2,555,589 1,290,788 1,264,801Source: NSO, Bacolod <strong>City</strong><strong>Negros</strong> Occidental Social <strong>and</strong> Economic Trends 2010Prepared <strong>by</strong>: Research, Evaluation <strong>and</strong> Statistics Division, PPDO
<strong>Table</strong> 1.9Number of Households <strong>and</strong> Tenure Status of the Lot Occupied <strong>by</strong> <strong>City</strong>/<strong>Municipality</strong><strong>Negros</strong> Occidental, Census Year 2000Tenure Status of the Lot Occupied<strong>City</strong>/<strong>Municipality</strong>Number ofHouseholdOwned/beingAmortizedRentedRent-freew/consent ofownerRent-free w/oconsent ofownerNot reportedBago <strong>City</strong> 27,965 6,705 563 17,959 888 1,850Binalbagan 11,092 2,322 476 7,300 290 704Cadiz <strong>City</strong> 26,998 4,882 1,626 16,770 1,114 2,606Calatrava 15,151 3,281 672 9,866 165 1,167C<strong>and</strong>oni 3,710 1,445 395 1,616 52 202Cauayan 16,704 6,398 1,117 7,572 276 1,341E. B. Magalona 10,498 3,118 559 6,080 139 602Escalante <strong>City</strong> 16,160 2,722 1,821 9,648 1,051 918Himamaylan <strong>City</strong> 16,878 3,772 1,202 10,465 506 933Hinigaran 14,342 4,790 614 7,812 204 922Hinoba-an 9,783 2,397 865 5,886 123 512Ilog 9,141 2,750 663 5,084 72 572Isabela 9,469 1,761 204 6,193 673 638Kabankalan <strong>City</strong> 27,851 12,183 959 11,954 1,285 1,470La Carlota <strong>City</strong> 11,082 4,465 708 4,873 119 917La Castellana 11,771 3,214 691 6,223 702 941Manapla 9,512 1,370 591 6,547 355 649Moises Padilla 6,376 1,135 355 4,181 157 548Murcia 11,644 2,450 177 8,084 59 874Pontevedra 8,554 2,082 463 5,012 312 682Pulup<strong>and</strong>an 5,175 713 365 3,587 310 200Sagay <strong>City</strong> 25,301 3,563 1,519 18,335 304 1,580Salvador Benedicto 3,456 986 40 1,620 566 244San Carlos <strong>City</strong> 23,941 6,289 1,939 12,682 1,867 1,164San Enrique 4,419 951 528 2,684 29 227Silay <strong>City</strong> 21,446 4,737 1,698 12,728 769 1,514Sipalay <strong>City</strong> 11,955 2,499 366 8,001 63 1,026Talisay <strong>City</strong> 15,774 5,140 645 8,061 684 1,244Toboso 8,060 1,674 135 5,886 16 349Valladolid 6,653 1,799 550 3,856 92 356Victorias <strong>City</strong> 15,361 5,158 565 8,326 85 1,227Total 416,222 106,751 23,071 244,891 13,327 28,179Source: NSO, Bacolod <strong>City</strong><strong>Negros</strong> Occidental Social <strong>and</strong> Economic Trends 2010Prepared <strong>by</strong>: Research, Evaluation <strong>and</strong> Statistics Division, PPDO
<strong>Table</strong> <strong>1.1</strong>1Occupied Housing Units <strong>by</strong> Construction Materials of the Roof <strong>and</strong> Outer Walls<strong>Negros</strong> Occidental, 2007Construction Materials of the RoofConstruction Materials of the Outer WallsTotalOccupiedHousingUnitsGalvanizedIron/AluminumTile/Concrete/Clay TileHalfGalvanizedIron <strong>and</strong>HalfConcreteWoodCogon/Nipa/AnahawMakeshift/Salvaged/ImprovisedMaterialsAsbestos/ OthersNotReportedTOTAL 469,518 318,533 1,305 22,780 5,905 116,619 1,122 1,170 2,084Concrete/brick/stone 85,214 81,884 875 1,139 110 783 28 252 143Wood 77,799 61,301 85 2,382 3,020 10,643 43 97 228Half concrete/brick/stone <strong>and</strong> half Wood 98,117 80,300 193 12,962 552 3,604 139 217 150Galvanized Iron/Aluminum 4,672 3,039 61 792 360 327 4 76 13Bamboo/sawali/cogon/nipa 197,962 89,157 - 5,396 1,832 100,383 284 418 492Asbestos 147 127 - 14 3 - - 3 -Glass 88 68 1 2 1 - - - 16Makeshift/salvaged/improvised materials 2,783 1,511 - 59 15 553 620 12 13Others/ not reported 2,722 1,136 90 34 12 322 4 95 1,029No walls 14 10 - - - 4 - - -Source: NSO, Bacolod <strong>City</strong><strong>Negros</strong> Occidental Social <strong>and</strong> Economic Trends 2010Prepared <strong>by</strong>: Research, Evaluation Statistics Division, PPDO
<strong>Table</strong> <strong>1.1</strong>2Household <strong>Population</strong> 5 Years Old <strong>and</strong> Over <strong>by</strong> Highest Educational Attainment <strong>and</strong> Sex<strong>Negros</strong> Occidental, 2007HighestEducationalBoth Sexes Male FemaleAttainmentTOTAL 2,085,457 1,073,670 1,011,787No grade completed 137,422 73,137 64,285Pre-school 66,520 36,563 29,957Elementary 952,144 514,894 437,250High School 610,180 301,038 309,142Post Secondary 63,918 33,819 30,099College undergraduate 106,708 50,873 55,835Academic degree holder 125,959 52,306 73,653Post baccalaureate 1,435 576 859Not stated 21,171 10,464 10,707Note: For <strong>City</strong>/<strong>Municipality</strong> data, see 2007 Census of <strong>Population</strong> <strong>and</strong> HousingSource: NSO, Bacolod <strong>City</strong><strong>Table</strong> <strong>1.1</strong>3Household <strong>Population</strong> 5 to 24 Years Old Who Were Attending School <strong>by</strong> Sex <strong>and</strong> Age Group<strong>Negros</strong> Occidental, 2007SexHousehold <strong>Population</strong> 5to 24 Years OldHousehold <strong>Population</strong> 5 to24 Years Old Who WereAttending SchoolAge Group5-9 10-14 15-19 20-24TOTAL 1,047,402.00 670,343.00 241,486.00 271,604.00 136,520.00 20,733.00Male 548,691.00 338,012.00 122,832.00 135,386.00 68,023.00 11,771.00Female 498,711.00 332,331.00 118,654.00 136,218.00 68,497.00 8,962.00Note: For Sex Disaggregated data, see 2007 Census of <strong>Population</strong> <strong>and</strong> HousingSource: NSO, Bacolod <strong>City</strong><strong>Negros</strong> Occidental Social <strong>and</strong> Economic Trends 2010Prepared <strong>by</strong>: Research, Evaluation Statistics Division, PPDO