1 - Københavns Universitet
1 - Københavns Universitet
1 - Københavns Universitet

Create successful ePaper yourself
Turn your PDF publications into a flip-book with our unique Google optimized e-Paper software.
KØBENHAVNS UNIVERSITETINSTITUT FOR FYSISK OCEANOGRAFIINHERENT AND APPARENT OPTICAL PROPERTIES OF THEWESTERN MEDITERRANEAN AND THE HARDANGERFJORDByN. K. HØJERSLEVREPORT No. 21 COPENHAGEN MAY 1973
All rights reservedNo part of this work may be reproduced in anyform whatsoever without the permission of theInstitute of Physical OceanographyUniversity of Copenhagen
INHERENT AND APPARMT OPTICAL PROPERTIES OF THEWESTERN MEDITERRANEM AND THE HARDANGERFJORDByN.K. HØJERSLEVABSTRACT•An in. situ light absorption meter for the spectral range 372-633nm has been constructed« This instrument was utilized in the WesternMediterranean and in the Hardangerf jord (Norway) for obtaining spectralabsorption coefficients.In clear natural waters the absorption of light is mainly influencedby the selective absorption of the water itself, whereas this isnot necessarily the case in turbid waters. Here it may be found thatthe absorption in the ultraviolet even exceeds the absorption in thered. In extremely clear natural water the absorption due to particlesand dissolved substances is rather independent of wavelength and small.Relation between the absorption coefficient and the vertical attenuationcoefficient of the downwelling irradiance field was found toexist, whereas no pronounced correlation between the absorption coefficientand the temperature or salinity distribution was demonstrated.In the uppermost surface layers the absorption coefficient is notalways reliably available from the vertical attenuation coefficient ofthe downwelling irradiance times cosine to the polar angle of the directsun rays in water. Furthermore this method gives consistentlytoo high absorption coefficient values.In the Western Mediterranean the attenuation coefficient wasmeasured by means of a transmissometer and the scattering coefficientby means of an integrating meter. The sum of the experimental valuesof the absorption and the scattering coefficient agreed well with theexperimental value of the attenuation coefficient.The plots of scatterance measured in vitro through an angle of45 in "the red, green and blue part of the spectrum at different depths
2exhibited almost parallel trends»In the upper layers of the Western Mediterranean correlation beotween the scattering coefficient and scatterance through 45 is demonstrated- the correlation factor being water mass dependent»I. INTRODUCTIONThe aim of the investigations wass1) to determine the absorption coefficient directly as a function ofwavelength and depth in different waters»This also includes examinationof the scalar, the vector, the down - and upwelling irradiancefield (E J E = E - E , E, and E , respectively) and its variation withdepth at different wavelengths,,2) to check the experimental values of the absorption, scattering andattenuation coefficient (a, b and c, respectively) against the relationsa + b = c3) to examine the interrelation between a and K, (vertical attenuationcoefficient of the downwelling irradiance) at different solar elevationsh os4) to establish eventual relationships between the absorption, scatteringor attenuation coefficient versus the temperature or salinitydistribution»Absorption coefficients obtained in situ have formerly been determinedby methods based on approximate measuring principles«, (seefor instance GILBERT et al., 1969 and BAUER et al„, 1971).They allhave in common that a is measured by means of artificial light sourcesand over rather small distances, which makes it difficult to arriveat reliable a-values - especially in clear waters at wavelengthsof maximum transmission»The instrumental principle of the a-meter in question is based onthe Gershun equation (GERSHUN, 1939)div E = --aE (1)ov 'This ensures that a can be measured over long distances when necessary»The drawback of this a-meter is on the other hand that it needsexcellent weather conditions and is only operative in day-light»It is assumed that the horizontal divergence of the irradiance fieldequals zero, which is the case for a horizontally stratified medium.
The definition of the vertical attenuation coefficient for the irradiancefield can be written%1 hEK TP = - p ^ whore E = E - E {r,i E oz d u (2JEquations (1), (2) and the assumption div„ E = 0 imply that the absorpntion coefficient a can be determined from the equationa = K E]|- (3)0The instrument is therefore designed to measure E_. E and E simuld7 u otaneously as a function of depth»is calculated from the formulaNumerically the absorption coefficienta(E(a ) E(z )V> =—, - z . SJT)ln lT-Tn+i n-1 o x irvn+1 'where the z 's are increasing downwards and equidistantly spaced.elegant numerical methods than (3a) vie re attempted but they did notlead to any significant changes in the finalways sresults»Formerly ? absorption coefficients were determined in 2 different(3a)3Morea) indirectly, by measurements of the attenuation and scatteringcoefficients and b) by measuring the vertical attenuation coefficientof the downwelling irradiance K, just below the surface, where Kj isdefined as-; K = ~ (l/E ) (öE /öz) B Calculation of a is then performedas follows: a = K, cos G . where 9 is the polar angle of the directd s T s • &sunlight in water (JERLOV, 1968, JERLOV and NYGÅRD, 1969 a).methods lead, however, to rather uncertain a-values.BothRecently TYLER et al. (1972) have demonstrated an iterative methodxtfhich among other parameters gives a spectrally,,This method appliesto what is referred to as "clear natural water" - most likely Type IBaccording to JERLOVs (I968) optical classification of water masses « Theinput parameters do arise from a measured vertical distribution of E ,E(not corrected for imperfect cosine collection) and a lightscattering function at a single wavelength (550 nra), (MOREL, 1968) -unfortunately from different locations.In addition some assumptionsare made about the radiance distribution and its functional dependence
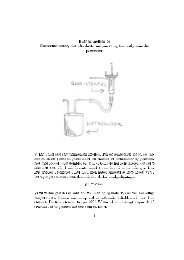
4(it shall "be azimuthally independent, its shape shall remain unchangedeven at rather small optical depths, etc.). Finally assumptions are madeabout 'the molecular s'catterance, in order to obtain an optimum- data fit.Finally it shall be mentioned that the notation used throughoutthis paper is the same as recommended in IAPSO Standard Terminology onthe Optics of the Sea 1964=II, LIGHT ABSORPTION METERA. DESCRIPTIONThe a-meter is shown in Fig» 1» Outside its annular iron frame arubber hose is attached in order to protect the meter against shocks»Inside the frame 3 houses measuring E^ (spherical irradiance), E andE are mounted (in the following referred to as E , E. and E -meters,u s 7 d urespectively)„ In the center of the ring a fourth house is placed servingas a connecting box between the 3 cables running from the lightmeasuring units and the main cable»gauge.It also might house a pressureIn order to reduce shadowing the four housings are made as smallas possible and the frame as large as practically possible,Fig„ 2»1„ E -meter:sThe construction of the E -meter is schematically demonstrated insIt can easily be proved that the light collected by this typeof instrument equals 1/4 times the scalar irradiance obtained in theposition of the center of the 4^-collector ifs a) the 2 collectors(marked as (1) and (2) on Fig. 2) are ideal and b) the ratio of thearea of the Tt-collector to that of the 4^-collector and the radius ofthe 4^-collector both are infinitesimal in magnitudes»The 4^-collector is a standard opal-flashed globe»However, examinationof its angular response demonstrated a remarkable good equalcollection independent of wavelength in the interval 0 < B < 90 °For an arbitrary but fixed 0 there was a slight azimuth variationamounting to 1-2 fo from the mean response - and a similar variationfor a fixed azimuth and a variable 6. In the interval 90 < Ö < 1 38(see Fig. 2) the angular response dropped on average 20 %.At greater
9's the shadowing effect from the E^-meter itself took place.- Allquestions concerning correction terms of minor importance will he discussedin a later section.Behind the Ti-collector (denoted (2) in Fig- 2) a plug of blackplastic with drilled holes is placed.This is followed by an interferencefilter (SCHOTT und GENOSSEN, double interference filter havinghalf-value widths between 7° 5 and. 17 nm) and a Se photovoltaic cell(LJWGE S 50 U¥-sensitized).The holes of the plug have such dimensions that the maximum obliqueincidence of light on the interference filter never exceeds 22 „ Thismeans that the maximum transmission peak of the interference filter atmost can be displaced 8 nm towards shorter wavelength as found frommeasurements in a Beckman LK 2 spectrophotometer.shift of wavelength is calculated to be lesser than 3 nm.However, the realThe instrumental principle in the S - and E^-meter is exactly asu dthat in the E -meter. The angular response of their respective TI-COIslectors is the same as for the Jerlov-Nygård quanta-meter (JERLOV andNYGÅRD, 1969 b).-. CALIBRATION"Each of the 3 irradiance meters were equipped with their appropriateplugsj interference filters and Se photovoltaic cells. Thereafterthe E^- and E n -meter were placed in 2 Gershun tubes having thesame opening angle of 12 0 5ensuring the irradiance on the 2 collectorsto be equal » Both tubes i^ere directed against the sun on a clearday with steady light conditions.The signals from the 2 meters wereconnected through a low input impedance (20 ohm) chopper-stabilizedcurrent amplifier (Knick type X, gain 100 + 0.1 fo) to a potentiometerrecorder (Moseley Model BM). The E -meter was then replaced by theE -meter and the procedure repeated»This was carried out for o differentwavelengths, and the relative sensitivity of the E - or the E,-meter versus the E -meter in air was determined for each viavelength insquestion.Such relative calibrations wore performed frequently when steadylight conditions occurred and all results turned out to be very consistent,suggesting that the Se cells are stable and the calibration5
6technique good* Relative calibration of the meters were also successfullyperformed on cloudy days with variable light conditions.The immersion effect for the 3 meters in the 8 colours was determinedaccording to common practice (see for instance the review paperof AAS, 1969 or SMITH, 1969)= The immersion effect factors were finallyincorporated into the relative sensitivity factors obtained in air.As a result the relative sensitivity of the E - or E -meter versus theu dE -meter are determined spectrally in water. This implies that the ab-Ssorption coefficientI I II M IBM! I lllllll Tl-can be obtained absolutely from relative measurementsof E 5 E n and E as can be seen from equation (3), when E . E,o ? n v y ?d uo' dand S are modified by certain corrections,u °C. OCREDCTICITS OF IRSTEUIEIT^L REUn^GSThe imperfect angular response of the two rt-collectors causessmaller irradiance values than those obtained in case of ideal rc-col—lectors»1 c E -meteruCalculation showed that an addition of 15-25 fo to the E -signaludepending on wavelength would be appropriate assuming a constant radiancedistribution in the lower hemisphere« The fixed value of 20 %itself is a correction term in the absorption cal-^was chosen since Euculation.The correction was performed by a 20 fo increase in the photocurrentamplification.2. E--meterdThe E -signal is multiplied by the factor cos 0 /R(Ø ,X) in orderto correct for the imperfect light collection. The angle 0 is givensfrom the Snellius law of refractionsin(90 -h )B - 4(4 >sin b 3swhere h is the solar elevation and n the refractive index of water.sThe function R(9 ,\) is the angular response of the n-collector as afunction of angle of incident light and wavelength.The above-men-
7tioned correction cos 6 /R(9 ,X) does apply exactly when the lights sfield is a vector in direction of the sun rays and shadowing effectsfrom the a-meter are neglected- Examples: h = 40 and 70 implyfrom the a-meter are neglected* Examples: h scos 0^/R(.e.,\) = 1.09 and 1.02,respectively.3° E -metersTwo different kinds of corrections are necessary.due to the positionThe first isof the E -meter in relation to the E--meter, andfsdthe second is due to shadowing effects from the a-meter 0The ^-collector belonging to the E -meter (denoted (2) in Fig 0 2)is placed in the same horizontal level as the Tt-collector of the E -dmeter» This causes the ratio E /E n to be overestimated, if the nominalo / d 'depth of the a-meter is chosen at the depth of the E.-meter„ AssumingcLthat the total radiance field L (z r G,cp) is attenuated as the scalar ir~radiance for all 2, 9, cp the measured ratio E /E without corrections *at z - z is found to beo EJ^ "*)o vwhere K is defined asoK (1+cos 9)r 1o/ L(z 19,cp) e dcu3,(z ) E,(z )d^ o 7 cr o / 4TC ° ](5)K -_J_!^ - (6)o E bzor the radius of the 4-ft-collector equal to 0*063 m and 0 < A < 2r Twhere A depends on the radiance distribution,, The exponential termbelow the integral sign is approximated to first order - since K (1 +cos 9)r
on the E- and E -meter, are about the same and small)»7 Jd sCorrectionterms of the whole scalar irradiance therefore emerge solely from theupwelling scalar irradiance E n
9red part of the spectrum,,The term a is obtained from the relationwa = c - bw w wwhere c is the attenuation coefficient measured in pure water (CLARKEwand JAMES, 1939 - JERLOV, 1968 p. 51) and b the scattering coefficientwcalculated for pure water (LeGRAND, 1939 - JERLOV, I968 p. 51).III. SCATTERMCE METERSMeasurements of the scattering coefficient b were performed in 2different ways:1) In situ by using an integrating b-meter (for details and calibrationsee JERLOV, 1961).2) In vitro by applying a Tyndall meter and assumingb = constant * ß(45 )(see for instance JERLOV, 1953, DEIRMENTXJAN, 1963, KULLEBTBERG, 1969,HØJERSLEV, 1971 and KULLENBERG and OLSEU, 1972) where the constant isto be found by calibration using water with a known scattering coefficient.The constant was determined to be 0.057»Description of the Tyndall arrangement can be found elsewhere(HØJERSLEV, 1971).IV. ATTENUATION METERSMeasurements of the attenuation coefficient c were carried out bymeans of a beam transmittance meter of the conventional type (JOSEPH,1949) having a path length of 1,5 m. It measures c in the red andultraviolet (SCHOTT und GMOSSM RG 1, \ = 655 nm and UG 1 + BG 12,maxX - 38O nm, respectively) Calibration technique and thorough desmaxcription of the instrument is given in other publications (see forinstance KULLEHBBRG et al.,197Q).Alternatively c v/as determined by means of a He-He laser (632.8nm) and a photovoltaic Se-cell arrangement measuring the lightat 2 different positions 1 m apart (KULLMBBRG and OLSEN, 1972).flux
10V, MEASURMMTSA 0 MEDITERRANEANDuring an océanographie expedition in the Western Mediterranean inMay-June 1971 the following inherent optical properties of soa waterwere measured in situ;1) Absorption coefficients at wavelengths 372, 427, 4/7, 486, 513, 532,572 and 633 nm measured in steps of 5 m down to a maximum depth of JO m .2) Attenuation coefficients at wavelengths 380, 633 and 655 nm measuredcontinously or in steps dom to at least 100 m.3) Scattering coefficients at wavelengths 633 and 655 nm measured continouslyor in steps down to at least 100 m.Furthermore a Tyndall meter measuring the scatterance in vitro atthe fixed angle of 45 was applied in the red, green and blue part ofthe spectrum« Some of these measurements were extended from the surfaceto the near bottom layers»All types of light measurements (except for scatterance in vitro)were only performed when waveaction did not affect the instrument signalsand the depth determinations seriously. Especially the a-meterdemands a calm sea surface, which is clearly seen from the relation:obtained from equation (1) and div E - 0.oThe light field above the soa .surface was checked by means of adeck-photometercIf any variation occurred the absorption measurementswere suspended, because a deck photometer reading is not alwayscorrelated to an in situ reading, so attempts to make corrections mayeven be misleading„The absorption measurements were made à hours around solar noonin order to ensure, that the actual light collection of the E,-meterwould be so close to an ideal collection as possible.(The quality ofthe actual light collection of the E - and E -meter is rather unafsufected by varying solar elevations).After each series of absorption measurements at a specific wavelengththe instrument is taken onboard the ship and thefilters are shifted manually.interferenceDuring this procedure the Se cells are
11protected against direct sun light and great care is taken in order toavoid moisture in the instrument by frequent use of silica-gel.Tyndallj scatterance and transmission measurements were carriedout in the conventional way (see for instance KULLMBERG et al., 1970and HØJERSLEV, 1971)« Usual hydrography were, made by means of•plastic coated Hansen bottles, and the depths of the bottom-nearsamples (down to a few meters from the bottom) were measured by aid ofa pinger system.B. HARDMGERFJORDIn May 1972 on another océanographie expedition going to the Hardangerfjordarea, the same kind of light absorption measurements asthose made in the Western Mediterranean were repeated, whereas instrumentsfor measuring other inherent optical properties være not available.At both expeditions electronic salinity and temperature measurementswere performed at each station by means of an .in situ meter.VI. RESULTSA. ABSORPTION1 « MediterraneanAn inflow of Eastern Atlantic water masses, possessing a higherdegree of turbidity than normally found in the Mediterranean away fromcoasts, enters in the upper 100-150 m through the Strait of Gibraltarnear the position of Station A and continues mainly along the Africancoast. A fraction goes into the Balearic Sea - probably passing StationC and D - where it circles in a counterclockwise direction. Thewater of Atlantic origin soon looses its characteristics after the passagethrough the Strait of Gibraltar - except in a zone outside theAfrican coast, where the most rapid inflow currents are found.West of Sicily the current splits up in two branches. One is goingthrough the Strait of Sicily, probably near the position of StationJ2, The other passes along the nothern coast of Sicily where-
after it circles in a counterclockwise direction south of Sardinia -near the position of Station E2. This gyre-like current is joined westof Sicily "by another current at intermediate depth coming from the EasternMediterranean (see for instance SVERDRUP et al., 1942).Salinities exceeding 37% - which also indicates clear water becausethe Mediterranean water is more saline and optically clear thanthe incoming Atlantic water - were observed in the upper layers at allstations except for Station A,Calculations of K cos 9 (see Table XIII, XI and IX) in the upperQ. Ssurface layer reveal, that the water types at Station J2, J1A and A belongto Type IA, IB and II respectively, according to JERLOV ! s (1968)optical classification of different water types,(it shall be emphasized,that Station J1A is rather near to the coast)»12At Station A rapid changes of water masses in the upper layer areto be expected because of the strong and changeable currents in thearea.This is also reflected by irradiance measurements at 465 ranfromwhich quite different K,-values wore encountered within a few hoursd(FTGARD, K. personal communication). The variability of the watermasses is depicted by Pig. 8 (Table VIII) showing the vertical distributionof the absorption coefficients. On the first day the a-valuesat 477? 572 and 633 rangenerally decreased with depth, then theychanged into a tongue - like distribution at 427» 486 and 513 ranwithmaximum values near 25 m.Finally at the end of the second day a generalincrease of a with depth at 532 nm was observed»No correlationbetween the vertical a - distributions and the hydrographical parameterscould be observed.At Station J1A a general increase of a with depth was found.Slight variability in the water masses is optically demonstrated by427 (I), 427 (il) nm and 477 (i), 477 (il) nm, where (i) and (il) referto different station times (Fig. 9 ana Table X) 9At Station J2 no systematic trends in the vertical a-distributionscould be observed.The absorption coefficients varied differently versusdepth«At 572 and 633 nm no distinct variation is found, but at372, 427 and 477 ran ~tk® absorption coefficients increase monotoneouslywith depth. Finally at 532 nm an oscillating variation was found. Itis tentatively suggested, that these different a-trends are duo to the
after it circles in a counterclockwise direction south of Sardinia -near the position of Station E2. This gyre-like current is joined westof Sicily "by another gurrent at intermediate depth coming from the EasternMediterranean (see for instance SVERDKUP et al., 1942)=Salinities exceeding 37% - which also indicates clear water hecausethe Mediterranean water is more saline and optically clear thanthe incoming Atlantic water - were observed in the upper layers at allstations except for Station A,Calculations of K, cos 912(see Table XIII, XI and IX) in the uppersurface layer reveal, that the water types at Station J2, J1A and A belongto Type IA, IB and II respectively, according to JERLOV's (1968)optical classification of different water types,(it shall be emphasized,that Station J1A is rather near to the coast).At Station A rapid changes of i^rater masses in the upper layer areto be expected because of the strong and changeable currents in thearea. This is also reflected by irradiance measurements at 465 ^ fromwhich quite different K,-values were encountered within a few hoursd(BYGARD, K. personal communication). The variability of the watermasses is depicted by Fig, 8 (Table VIII) showing the vertical distributionof the absorption coefficients. On the first day the a-valuesat 477j 572 and 633 nm generally decreased with depth, then theychanged into a tongue - like distribution at 427, 486 and 513 nm withmaximum values near 25 m.Finally at the end of the second day a generalincrease of a with depth at 532 nm was observed.No correlationbetween the vertical a - distributions and the hydrographical parameterscould be observed.At Station J1A a general increase of a with depth was found.Slight variability in the water masses is optically demonstrated by427 (I), 427 (II) nm and 477 (i), 477 (il) nm, where (i) and (il) referto different station times (Fig. 9 arui Table X),At Station J2 no systematic trends in the vertical a-distributionscould be observed.The absorption coefficients varied differently versusdepth. At 572 and 633 nm no distinct variation is found, but at372, 427 and 477 nm the absorption coefficients increase monotoneouslywith depth. Finally at 532 nm an oscillating variation was found. Itis tentatively suggested, that these different a-trends arc due to the
factthat Station J 2 is situated in an area where water from the TyrrhenianSea is passing west and water of Atlantic origin east.Thismight cause intensive lateral mixing and thereby variability in opticalrespect„As it was the case at Station A, no pronounced correlation existedbetween a and the hydrographical parameters at Station J1A and J2.Fige 12 demonstrates that at Station J2 no significant variationof the average value occurs as a function of Travel ength.suggests 1)a ^ 0 i.e. no absorption due to dissolved organic substancestakes place and 2)the particle absorption in almostnon-selective o (The behaviour of at 572 and 633 nm will bewdiscussed in the next section)= Furthermore it is seen that w-1never exceeds 0,02 m except for 633 nm.ran.At Station A a much higher absorption than at J2 is found at 372Assuming the particle absorption to be non-selective and of thesame magnitude as found at J2, will become equal to 0„09 m372 nm,2. HardangerfjordThe water is strongly stratified in optical, hydrographical andchemical respects (AAS, 1967).Optical classification of the watermasses (JERLOV, 1968) results in values between Type 1 and 5°Thatwater of the coastal type is encountered in the Hardangerfjord is alsoreflected by the very high absorption in the ultra-violet and blue asdemonstrated by Fig. 12»Only little about the radiance distributionat13Thiscan be concluded from the a measurements, because the water is extremelyinhomogeneous.At all wavelengths the absorption decreases downwards,the decreasing tendency being smaller at greater wavelength.This suggests that the amount of dissolved organic substances also decreasesdownwards,, Assuming a non-selective particle absorption asbefore equals approximately 0„ 26 m ' at 372 nm cSimilar features are exhibited by the other fjord stations (TableXVIII, XIX, XX, XXI and XXII),The same arguments do also apply toStation H9, which is situated just outside the mouth of the Hardangorfjord(see Fig 0 17 and Table XIV, XV and XXII).A correlation between the vertical a -distributions and the den-
14sity field can be demonstrated at Station H2 (Fig„ 11).B. INTERRELATIONS BETWEEN a, L, K MB K- E' d ' oAll the data taken with aid of the a-meter show that K_ approximatelyequals K,, This is in agreement with theory as can be seen fromthe foil oiling reasonings&ln [V 1 -ËT)i öln(l-^) Eh ' - z • K d 5^ = K d + T å < Wthe last expression being an approximation of the first order»in all natural occurences |K - K J is always less than say J K,Since(which is a weak constraint) and E /E, b before it attains its constantasymptotic value«From the Gershun eq. (3) it is deduced^Kgbln(—) , ...V& _ y TT (H)bz E ovalid at all depths in inhomogeneous horizontally stratified waters,e
15when a is assumed to be independent of depth„Knowledge of IL, as a function of depth in the special case of homogeneouswater and application of eq, (12) allow a determination of K „ÖIL, °Since\E ordinarely > 0 in the upper layers it is immediately seenfrom eq D (12), that IL, > K at small depths. Assuming the existence ofa maximum K_ at intermediate depth (see for comments on the general behaviourof a/Kabove) eq« (12) furthermore demonstrates, that at thismaximum KL, = K „ This implies K > K^ below this depth and probablydown to the near-asymptotic region,, In case of no maximum K„ > K forall depths above the asymptotic region„Measurements of K_ and Kin inhomogeneous waters - which can beperformed with uncalibrated instruments - give the relative variationof a according to eq* (11).The abovementioned arguments involve implicitly, that the radiancedistribution in the vertical plane through the sun at intermediatedepths approximately obtains its asymptotic shape symmetrically distributedaround a direction having a smaller polar angle than the solardirection in water.v 19^3)-.This is in accordance with the findings of PIMTLEYAt much greater depth in the asymptotic region it approachesthe vertical and becomes azimuthally independent„Outside the verticalplane through the sun the radiance distributions become asymptoticallydistributed at relatively low depths»This is especially true for thedistribution encountered in the vertical plane having an azimuth angleof 90 away from the sun (see for instance JERLOV and LILJEQUIST, 1938,ïJITITîTEi", 1941 and KATTAWAR and PLASS, 1972),It should be emphasizedthat an asymptotic light distribution is obtained at smaller and smallerdepths when the solar elevation decreases„This implies accordinglythat the directional character of the radiance distribution towardthe sun in case of low solar elevations also vanishes at relativelysmall depths„In case of the Mediterranean Table VIII, X and XII demonstrate,that a and K, in the upper surface layers generally increase withdepth, whereas the opposite tendency is found for the ratio a/K, (seealso Figc, 8, 9, 10, 14» 15 aaacl 16).It is seen that the general behaviourod a/Kat Station A, J1A and J2, where only optically inhomogeneouswater masses are encountered, nevertheless is similar to the
variation of a/K, in the homogeneous example„K, are strongly correlated in the upper layers,,This implies that a andIn the Hardangerf jord the vertical distribution of a/K16at StationH2 have all a minimum value between 5 and 15 m - dependent on wavelength«Above this minimum a/K. varies as found in the Mediterranean;dioCc it decreases with depth 0exceptional behaviour of a/Kcan only be explained by the strong verticalvariation of the optical parameters»Below the minimum a/K, increases. ThisC. COMPARISON BETWEEN a MB K^ cos 9- d sThe relation a = K, cos 9 can be obtained from the Gcrshun equadstion (3)s/ L cos 9 dwa(z) - K E (z ? e. s )| = K E -^ = KgCz, ej < cos 9 > (13)0 ' / L dcuwhere < cos 9 > is the averaged value of cos G at the depth z 0In theuppermost layers most of the light energy is concentrated in the directsunlight so < cos 8 >~ cos 9 „ Furthermore K-fz, 0 ) .~ K n (z, 8 ) for— s E v ' s 7 — d v ' s'all z, 9 o (see eq, (10)) 0 Inserting these 2 approximations into (13)we obtain the desired relation - only valid at small depths
(+)of the a-meter - has a maximum limit of errors amounting V ; 25 %> Theshortcomings of the method is therefore mostly its unability to measureabsorption as a function of depth»17D» COMPARISON BETWEEK" a, b ABTD cThe absorption, scattering and attenuation of coefficients are notmeasured at the same wavelength, no immediate comparison between the 3coefficients should not be performedoHowever, assuming that the particlescattering coefficient bis independent of wavelength, the scatteringcoefficient can be obtained fromsb(x) = b p + b w (\) (14)where b is the scattering coefficient calculated for pure water (LeGRAND, 1939) and h = h (655 nm) * 0,0007 m~ 1 0 Similarly assuming thatc (633 nm) = c (655 Yxn) ^ä- a- (633 nra) = a (655 rjn) i^ is foundir i' t) Jc(633 nm) = c(655 nm) *• |c (655 nm) -s- c (633 nm) (15)u W ' WThe term in the brackets is calculated from the measured values ofCLARKE and JAMES (1939) and ecraals 0.05 m~ 1 .thatFinally it is assumedc(380 nm) = c(372 nm) (16)In clear natural water the approximations (14) ? (15) anä (16) have provedto be reasonable„ An expérimentai evidence for (15) can he givenfrom Table XXIV and Fig* 20 which at the same time demonstrate, thatthe two different c-meters function satisfactory,,It is seen from the Table XXIII, XXIV, XXV and XXVI (and Pig. 19,20, 21, 22)j that the sum of the experimental absorption and scatteringcoefficients compares well with the experimental attenuation coefficientsin the ultraviolet and red part of the spectrum.At Stations A + A2 (Fig. 19) ^he inherent optical properties werenot measured simultaneously. The variation in time of the scatteringcoefficient profiles are obvious» However, their maxima are unchangedand it seems as If the water mass below 60 m is optically time-independent,
18The scattering maxima observed at Stations D + D2 {Fig. 20 ) and J2(Pig 0 22) have diminished and moved down to about 75 m depth when comparedto the maximum found at Stations A + A2.Strong maxima are observed at 75 ^ from the c-measurements - themaximum being most pronounced in the ultraviolet in accordance with theresults reported by JERLOV (1953 a, b). These maxima are related tothe density structure of the water.At Station J1A (Fig«. 21 ) the attenuation maxima have almost disappeared,because the water here is less stratified than at the otherstations,Finally it shall be mentioned that indirect determination of theabsorption coefficient - especially in the UV-region ~ is problematic,because it is rather difficult to measure the scattering and attenuationcoefficients accurately in absolute values» However, an insightinto the variation of the absorption coefficient with depth is achievedby this method*E. SCATTERAÏÏCSIt is clearly demonstrated from Figs, 23-28 (Tables XXVII-XXXIl)that ß(45 ) ,* ß(45 ) and S(45 ) , have almost parallelKV v JyK J JHV Jrod' greenbluetrends i,e„ they are strongly correlated« This indicates, that theparticle scatterance is independent of wavelength (see for instanceeq.(U)).The scottering properties of the water masses at the position ofStation A (and A2) and Station B (and B2) vary with respect to time(Fig. 27, 28 and Table 1). During the time period between Station Aand A2 and Station B and B2, which is about 5 weeks, the insolationhas caused an increased stability in the upper layers as can be seenfrom the temperature curves in Fig«, 27 and 28. Increased stability involvesmore pronounced scatterance maxima,, which accordingly were observedat Station A2 and B2 when compared to Station A and B„Short period variations of the optical properties near Station Ahave been described earlier in this paper in connection with the a-measurementSc These variations can also be demonstrated by Fig«, 23 swhere the scatterance maximum is less pronounced than found two dayslater at the same position (Fig, 28, Station A).
19At Station C a clear scatteranco maximum is found, itfhereas the observedmaximum at Station D2 has diminished (see Fig« 25 ? 26). However,the relatively long measuring period between the observations allows nofirm conclusion but merely an indication of optically more homogeneouswaters at Station D2 than at CAt Station A (Fig« 23) below 300 m and down to the bottom the outflowinghomogeneous Mediterranean water seems to be optically homogeneoustoo o The small oscillatory trends in the ß(45 ) -curves are probablymostly due to instrumental unceriaincieSo The near-bottom seatterancevalues do not deviate significantly from the intermediate values,indicating, that no loose sediments are to be found at the bottom« Thesame argument seems to apply at Station B, Pig«, 24=The vertical particle distribution at Station S (Pig» 24) is essentiallyconstant from 500-1500 m at which depth it exhibits a jump towardslower values« This jump might be related to the observed densitydistribution. It should be noted that from I5OO m and below thesalinity is almost constant, whereas the temperature is monotoneouslyincreasing« nevertheless the static stability of the water massbetween 1500 m and the bottom is not unstable but almost neutral,which can be demonstrated from calculations of the potential temperotureinstead«Pig. 29 demonstrates the relationships between the scatteringcoefficient and ß(45 )• I n this context it shall be emphasised, thatthe integrating b-meter is unable to measure the scattorance contributionbetween approximately 0-10 . This means in turn, that agreater b/p(45°) reflects a clearer water mass (HØJFRSLPV, 1971)°It is seen, that the water masses encountered at Station B2 andD2 are the same, judging by the ratio b/ß(45 )• At station E2 twodifferent water masses are observed«, The points above the straightline are obtained between 70-100 m, whereas the others arise from measurementsbetween the surface and 70 m« It is tentatively suggested,that the two water masses originate from eastward flowing laterallymixed water of Atlantic origin underlying westward flowing clearerwater coming from the Tyrrhenian Sea«,
20VII. DISCUSSIONA. ABSORPTION METERThe a-meter has the follo vang shortcomingst1) its working speed is low because manual filter shifts are necessary o2) it measures absorption by use of 3 different Se-cells T so the relativesensitivity of these may change mutually in time and therebychange the calibration factors of the a-meter.In this context onlychanges of the cells belonging to the E M - and E -meter are of importance,3)the a-meter must be limited to small depths (70 m), because the47t-collector cannot withstand higher pressure than 12 atm» 4) "thecollection of light is not optimal, so correction terms depending on 0which never can be made quite exact, must bo applied« 5) E is not7 JTx- ' o umeasured in a well defined way because of shadowing effects and imperfectlight collection from below.However, despite the abovementioned shortcomings - of which onlypoint 2) might be of real importance - it is clearly demonstrated fromthe obtained results, that the absorption coefficient is measured witha good accuracy»B. ABSORPTIONTwo unexpected features were demonstrated from Pig» 12;1) the absorption coefficient in the red was greater at the opticallyclearer Station J2 than at A and 2) < a - a > = < a + a > atJ }w P Y572 nm at Station J2 was negative.It is believed that 1) can be explained by the difficulty in measuringabsorption in the red»maximum values at this wavelength.The instrumental limits of errors are atFortunately other instruments measuringattenuance and scatterance are rather developed in the red partof the spectrum, so absorptance can also be obtained indirectly withacceptable precision.2) can partly be explained by instrumental errors» The interferencefilter at 572 nm has a half-value width of 17 nm causing the wavelengthof maximum transmitted light energy to be found a little below572 nm due to the underwater spectra,! light distribution, which most
probably has a pronounced wavelength dependence about 572 nrru21In additionoblique incidence of light upon the interference filter will causea similar effect as mentioned above towards lower X-values,, As a resultthe measured absorption coefficient at 572 nm will become too small«,Opposite, the spectral filter transmission curve has its steepest flanktowards lower wavelengths suppressing the tendency of shift of wavelengths.A shift lesser than 3 nm is estimated,, However, this alonedoes not explain the unexpected negative value of < a - a > at 572 nm 0wIt shall also be mentioned that the relative differences in < a - a >wat 572 nm at Station J2, A and E2 seem plausible, especially when comparedto the case ^f 532 nm where exactly the same relative differencesand reasonable a-values are found - see Fig. 12. Therefore it is believed,that errors due to the measuring technique are without considerableimportance.Accordingly if is suggested that published values of a (or c ,since bwis negligible) are too high about 572 nm for the followingreasons s Several authors have investigated c as a function of wave-° wlength (see for instance JAMES and BIRGE, 1938, CLARKE and JAMES, 1939,HULBERT, 1945 and SULLIVAN, 1963).All the investigations performeddemonstrate considerable discrepancies in the results - especially inthe blue-green region of the spectrum.Examination of the original findingsreveals, however, that the work done by CLARKE and JAMES (1939)seems to be most reliable and extensive - particularly if it is regardedas a continuation and improvement of the work done hy JAMES andBIRGE (1938)„Nevertheless the original data obtained by CLARKE and JAMES (1939)(see Fig. 13) show that Berkefcld filtered Continental slope water andSargasso water have definitely lower c-values at 572 nm than what isreferred to as pure i^ater. This indicates that the published value ofc at 572 nm is too high,wFig. 30 demonstrates the average absorption coefficient measuredwith the a-motcr and the computed values obtained by TILER et al o(l972)oAgreement in the results is only found in the green part ofthe spectrum - near the wavelength where the light scattering functionis measured - whereas the computed values in the red are too high andin the ultraviolet too low.(The results from Station C and D should
22be disregarded because of bad weather conditions - see Table 1).Therefore it is believed that this type of prediction of a (\)should be avoided, maybe even in cases when the input parameters aremeasured at the same location because of the assumptions and the choiceof input parameters made»VIII CONCLUSIONSA» ABSORPTION METERA new a-meter should be constructed having a remotely controlledfilter disk and fibre optics going from a 2n~ and TI-COIlector to oneFIN-diode or photomultiplier.In this way the most pronounced scourceof error - namely 3 different detectors - would be removed» The 2TCand7i-collector should measure E _ and E,, respectively - and turnedod d ? Jdownwards. E and E . This means that all the four parameters can beou umeasured in a well defined way»This new a-meter is tentatively believedto be able to measure the absorption coefficient at every 5 mtsdepth within an, accuracy of - 10 fa to - 15 $ depending on the wavelengthand assuming optimal weather conditions.,B. ABSORPTIONAbsorption measurements carried out as described in this paper areof the greatest importance for the following reasons;1) Absorption coefficients at different wavelengths - but particularlyin ultra-violet - see FIg 0 3 - might serve as an important tool in theoptical classification of water types, since a is an inherent propertyand thereby independent of solar elevation, which is not the case forV2) They give information about E , E, and E spectrally. E is one ofo d u othe appropriate parameters itfhich should be applied in investigations ofphotosynthesis in the sea. Furthermore the ratio E/E (or E /E ) isimportant, because it gives information about whether the lightis diffuse or directional.fieldIn the case of optically homogeneous waterE/E as a function of depth describes the relative variation of K„,' o E3) The variation of K. as a function of solar elevation at a singled
depth can he determined "by measuring E/E = a/lC, continuously when asohsuming that K, ~ K F and the absorption coefficient constant in time atthat particular depth.Both assumptions are very realistic and farbetter than those made in usual K -determinations, which imply thatboth absorptance and scatterance are constant in time over the depthinterval in which K, shall be determined. Furthermore at very lowd °solar elevations the time delay in the two measurements - necessaryfor obtaining K, - will become a serious source of error,dDetermination of absorption coefficients from the relationsa = K, cos Q leads only to approximate a-values near the water surface,where shadows from the ship may become a problem» If, ho vie ver, thesesurface measurements are extended to greater depths and combined withmeasurements of K by J means of an unealioratod E -meter, f the verticalosdistribution of the absorption coefficient can be obtained approximatelyaccording to eq 0 (10) and (11) 0Indirect determination of the absorption coefficientb and c measurements should as a rule bo avoided,arising from23However, this methodmay be applicable in the red part of the spectrum where the limit oferrorsin the b and c measurements are at their minimum and that of thedirect a-measurement at its maximum»Finally it is the authors opinion, that the concept' of opticaldepths c>2 or/c'dz should be avoided and replaced by /a«dz, since thisparameter gives information about light energy transformationsother energy forms (sensible heat, fluorescent and chemical energy etc)intoover a certain depth interval, whereas the optical depth parameter inaddition also contains a term describing the redistribution of lightenergy over the very same depth interval»XI ACINÖWLEDGEMSITSDue thanks are given to Professor N.G, J orlov v:ho outlined the basicmeasuring principles of the light absorption meter and gave manyvaluable advices during the development of the instrument«, Fartherthanks are given to Mr„ K, ïhrgârd \?iho supervis ed tho construction of theinstrument and to Captain M.Hauge and his crew on r Holland-Hansen" forexcellent co-operation«
24REFERMEESAAS, E., I96T« The natural history of the Kardangerf jord. 9. Irradiancein Hardangerfjorden 1967* Sarsia 46; p. 59-78.AAS, E., 1969= On submarine irradiance measurements. Rep. Inst. FysiskOceanografi, Un. Copenhagen, 4s 6 pp.BAUER, D., BRUH-COTTAH, J.C. et SALIOT, A. 1971. Principe d'une mesuredirecte dans l'eau de mer du coefficient d'absorption de la lumière.Cahiers Océanographiques XXIII no. 9? P» 841-858.CLARKE, G.L. and JAMS, H,R., 1939= Laboratory analysis of the selectiveabsorption of light by soa water. J. Opt, So c Am., 29 s p.43-55«DEIRMEHTJIAF, Do, 1963. Scattering and polarization properties of polydispersedsuspensions with partial absorption. In. I. C E. S.Electromagnetic scattering, Pergamon, London, 5* P- 171-189.DUFILEY, S.Q., 1963. Light in the sea. J. Opt. Soc. Am. 53s p 3 214-233.GERSHUH, A., 1939» The light field. J. Math. Phys., 18s p. 51-151.GILBERT, G.D., HONEY, R.C., MYERS, R.E. and SOREHSEH, G.P. , 1969. Opticalabsorption meter. Stanford Research Inst. Coirtr. N60530 -68 - C - 1423. 60 pp.HULBERT, E.O., 1945. Optics of distilled and natural water. J. Opt.Soc. Am,, 35^ p. 698-705.HØJERSLEV, ILK. , 1971 - Tyndell and fluorescence measurements in danishana norwegian waters related to dynamical features. Rep. Inst.Fysisk Oceanografi, Un. Copenhagen, 16; 9 PP°HØJERSLEV, 1T.K. , 1972 0 A theoretical proof of the existence of a constantvertical radiance attenuation coefficient in a horizontallystratified ocean. Rep. Inst. Fysisk Oceanografi, Un. Copenhagen,20s 9 PP*JERLOV, H.G., and LILJEQUIST, G., 1933. On the angular distributionof submarine daylight and the total submarine illumination. SvenskaHydrograf. Biol. Komm. Skrifter, Hy Ser. Hydrog», 14= 15 PP°JERLOV, H.G.j 1953 a. Particle distribution in the ocean. Rep. SwedishDeop-Sea Expedition, 3? p. 73-97»
25JERLOV, N,G„, I953 h. Influence of suspended and dissolved matter onthe transparency of sea water. Tellus 5 J P° 59-65°JERLOV, N.G,, 1961. Optical measurements in the Eastern North Atlantic»Meddn, Oceanog. Inst. Göteborg, 30, p. 1-40»JERLOV, N.G., 1968. Optical Oceanography. Elsevier OceanographySeries, Amsterdam»JERLOV, N.G., and NYGÅRD, K. 1969 a. Influence of solar elevation onattenuation of underwater irradiance. Rep, Inst, Fysisk Oceanografi,Un. Copenhagen, 4* 6 pp.JERLOV, N.G., and NYGÅRD, K., 1969 b. A quanta and energy meter forphotosynthetic studies» Rep. Inst» Fysisk Oceanografi, Un» Copenhagen,10: 19 PP°JOSEPH, J,, 1949- Durchsichtigkeitsmessungen im Meere im ultra-violettenSpektralbereich, Deut. Hydrograph, Z., 2, p. 212-218,KATTAWAR, G.W., and PLASS, G.N., 1972, Radiative transfer in theEarth's atmosphere - ocean system: II Radiance in the atmosphereand ocean, J. Phys, 0c, Vol, 2, no, 2% p. 146—156«KULLENBERG, G,, 1969- Light scattering in the Central Baltic 0 Rep.Inst. Fysisk Oceanografi, i Un, Copenhagen, 5» 11 PP°KULLENBERG, G.. LUNDGREN, B., MALMBERG, S.AA., NYGÅRD, K. and HØJERSLEV, N.K., I97O, Inherent optical properties of the Sargasso Sea.Rep. Inst. Fysisk Oceanografi, Un, Copenhagen, 11s 11 pp.KULLENBERG, G., and Olsen, N.B,, 1972, A comparison between observedand computed light scattering functions - II. Rep, Inst, FysiskOceanografi, Un. Copenhagen, 19: 9 PP =MOREL, A., 1968, Relation entre coefficient angulaire et coefficienttotal de diffusion de la lumière pour les eaux de mer. CahiersOcéanographiques 20 (4): p.291-293.Smith, R0C0, 1969» An underwater spectral irradiance collector, J.Mar, Res,, 27: p. 341-351-SULLIVAN, S.A., 1963 = Experimental study of the absorption in distilledwater, artificial sea water, and heavy water in the visibleregion of the spectrum. J, Opt, Soc, Am., 53s p. 962-967=SVERDRUP, H.U., JOHNSON, M.W. and FLEMING, R.H., 1942, The Oceans,Pren.tice - Hall. Inc.: Englewood Cliffs, N.J., 1060 pp.
26TYLER, J„B OÏ SMITH, R.C., and WILSON Jr., W.H., 1972= Predicted opt i-c a! pro pe rt i e s for cle ar natu ral wat er. J „ 0 pt . So c„ Am „, Vol o62, no. 1s p.-83-91 oWHITNEY, L.\To, 1941- The angular distribution of characteristic diffuselight in natural waters. J» Mar. Res», 4» p. 122-131-
Fig. 1.meter.The light absorptionFig. 2. The E - meter° s1) 4fr - collector2) TT - collector3) brass protecting case4) plug of black plastic5) interference filter6) photovoltaic Se - cell7) annular rubber gaskets
Station A.10,-2T 1 i i i r i ilE and E« in normalized values of E.(Z 0 )10rl101 I I I II I I I I Mill3. E and E as functions of depth and wavelength (nm)Station J1A: E and E„ in normalized values of E 0 (Z 0 )i i i i i i 11 [ i i i i i i i 11633"'l_l—l l i l l it4. E and E as functions of depth and wavelength (nm)
Station J 2: E and E, in normalized values of E 0 (Z 0 )10 Î0 10 Li i i i 1111| i i i i i i 11| i i iJ I * I f 111 m5. E and E as functions of depth and wavelength (nm)Station H 2 E and E, in normalized values of E 0 (Z 0 )i i—i—i i i 11• » ' ' ' • • »6. E and E as function of depth and wavelength (nm)
Station H 9:r210E and E* in normalized values of Ee(Zo)10 n 10 vT 1 I 1 I III! 1 I I I ! Illl 1 TTTJ I I I I INI » i i i l illFig. 7. E and Eas functions of depth and wavelength (nm)Station A45 50ABSORPTION COEFFICIENTS85 90 95 km" 1- 1020- 30TEMP. CSALINITY S%Fig. 8. Vertical distribution of salinity, temperature and absorptioncoefficients as a function of wavelength (nm).Note: The absorption coefficients at 372 nm and 633 nm are diminishedby a factor at 0.5 and 0.3, respectively.
Station J1AABSORPTION COEFFICIENTS65 70 75 km-1SALINITY S V.«Fig. 9. Vertical distribution of salinity, temperature and absorption coefficientsas a function of wavelength (nm).Note: The absorption coefficient at 633 nm is diminished by a factor of 0. 1Station J 2:-20 30 40 50 6011 1 1147711633 (x 0.1)1 1532-,372
Station H 2:too1532572 47715012001250f" 1ABSORPTION COEFFICIENTS^^-^300'/km 1ô372 _f /•~ / \J^~~f I15321t*{ \5101110 20633 \\\S /ooTEMP C*130 SALINITY SV.-H io—H 20H 30Fig. 11. Vertical distribution of salinity, temperature and absorptioncoefficients as a function of wavelength (nm). m-10.3 k t/0.20.1372 633 XnmFig. 12. Average absorption coefficients minus molecular absorptioncoefficients (a ) at different locations as function of wavelength.
Fig. 13. Transmission curves fordifferent water types as a functionof wavelength (CLARKE and JAMES,'ooTV.600 -650- 700 8001939) double distilled water 95(referred to as "pure water") ,— Berkefeld filtered ContinentalSlope Water,filtered Sargasso WaterBerkefeld650- 700 800 nmStation A0.60 0.70"T"0.80"7"0.90a /k427 486372e10203011mFig. 14. Vertical distribution of the ratio between absorption coefficientsand vertical attenuation coefficients as a function of wavelength.
Station J1A:Fig. 15. Vertical distribution of the ratio between absorption coefficientsand vertical attenuation coefficients as a function of wavelength.Station J2:Fig. 16. Vertical distribution of the ratio between absorptionand vertical attenuation coefficients as a function of wavelength.coefficients
Station H9:Fig. 17. Vertical distribution of the ratio between absorptionand vertical attenuation coefficients as a function of wavelength.coefficientsStation H 2:y*.0.60 070 0.80 0.901 111 I1 I e/372-^Y^[572^633- 10Vkil••- 20- 3011\5321I«1«mFig. 18. Vertical distribution of the ratio between absorptionand vertical attenuation coefficients as a function of wavelength.coefficients
Station A+A2:100 300 400a(633}500 km" 1—i rpc(633)255075dc(633)K 16 18 TEMP. CH 136 37 38 SALINITY S%.- 100Fig. 19. Inherent optical properties at different wavelengths, salinity andtemperature versus depth.Station A and Station A2.Station D + D 2:100 300 400~i 1 rD:a(633) ^
Station J1A:SALINITY S*/..Fig. 21. Inherent optical properties at different wavelengths, salinityand temperature versus depth.Station J2ia(372)1001—km" 1255075b(655)100K+16 18 TEMP. C36 37 38 SALINITY S%.mFig, 22. Inherent optical properties at different wavelengths,and temperature versus depth.salinity
Fig. 2 3. Vertical distribution ofsalinity, temperature and relativescatterance through an angleof 45 in the red, green andblue part of the spectrum.Station A:0.5••-—.13k100200 /300400500600LL*700800900mH— t —37.5*VA.\\\W,\\\\\\\\15 16-t- —)—38 36.5>UUklim(UUUUTEMP. CSALINITY S*/..5001000 -Station B:REL. UNITSREL UNITSFig. 24. Vertical distribution ofsalinity, temperature and relativescatterance through an angleof 45 in the red, green andblue part of the spectrum.1500 -- lims »gr—n -20002500TEMP C38.0 38.5 SALINITY S7..
Fig. 25. Vertical distribution ofsalinity, temperature and relativescatterance through an angleof 45 in the red, green andblue part of the spectrum.100Station C:REL. UNITS200300t260020 TEMP C38 SALINITY SV«26252650OK 5*)greenms )red2675 -WA
Fig. 27. Vertical distribution ofsalinity, temperature and relativescatterance through an anogle of 45 in the red, green andblue part of the spectrum.Station B and —StationB2 (the salinity curve is obtainedat Station B).too200Station B + B20.5REL. UNITS1.5ÛiASJafidflMlHuiÛliSludf)(45 )qmn300- MM ) fd40020TEMP. 'C3737.536SALINITY S%.Station A + A20.5REL. UNITSFig. 28. Vertical distribution ofsalinity, temperature and relativescatterance through an angle of45 in the red, green and bluepart of the spectrum.Station A and Station A2(the salinity curve is obtained atStation A).36.5 SALINITY S%
11.5(3(45*) redREL. UNITSfî (45 ) redREL UNITS1.00.5/ b~ß(45 )x 0.043STATION D20.5 bred xlOm" 1Fig. 29. The total scattering coefficient plotted against the relativeance through an angle of 45 .Note: b re( j is enlarged by a factor of 10.scatter372 427 477 486 513 532 572 633 A nmFig. 30. ~;7\*— Averaged absorption coefficients determined experimentally bymeans of the a-meter at different locations in the Western Mediterranean.© © Interpolated computed a-values obtained from TYLER et al. (T972)-Table I.
Table IStations, dates, positions, depths, mean weather conditions and observationsin the Mediterranean.Stationno.Date(1971)PositionDepthmWeatherObservationsABCD5-29,6-16-26-36-5N 36°w 04E 02IF 38°E03°N 38°E 0600'30»20'10'11'06'07'07!80028OO28002600calm,clearflat,NW 10 m/s,sea 3-4»cloudyNW 10 m/s,strong swell,cloud coverW 10 m/s, increasingsea3-4j cloudyabsorption, scattering,attenuation,hydrographyscattering, attenuationhydrographyabsorption,scattering,hydrographyabsorptionhydrographyEJ1AJ2E2D2B2A26-66-12,6-136-14,6-157-67-7,7-87-107-12,7-13IT 38°E 08°ST 39°E 09°ÎT 38°E 09°IT 38°E 09°IT 38°0E 07IT 37°0E 02°IT 36°W 04°20'02'17'42'20«31»34'09'23'10'30'10'09'00'27OO65018601100260027001300W 10 m/s, increasingsea4 f cloudy3sTW 7 m/s,sea 2,cloud 2E 7 m/s,sea 3,clearW 8-10 m/s,sea 3-4»cloud 3ÎTW 4 m/s,light swell,CX Q
Table IIStations, dates, positions, mean weather conditions and observationsin the Hardangerfjord.Stationno.Date(1972)PositionWeatherObservationsH95-10IT 59° 33* »6E 05 01 '. 3calm, flat,cloud 2absorption,hydrographyH25-11IT 60° 27'.55: E 06° 47 MOcalm, flat,clearabsorption,hydrographyH15-11IT 60° 29' .0E 07° 02'„3calm, flat,hazeabsorption,hydrographyRogdabergneset5-13IT 60° 17 i.OE 06° 36'.0calm, flat,cloud 1absorption,hydrography
Table IIIStation A:E , E,. E . and E in nonmalized values of E (z ).Depth372 nm633 nmmE odEtiEE 0E, 'd ?E uE•51.000.900.0120.891.00O.790,00140.79100,460.410.00650.400.170,130.13150.200.160,00350,16O.O3OO.024O.O24200,0059O.OO540,0054Depth477 nm427 nm01E 0"dE uEE0dE I Eu f51.00O.750.0120 = 741.000,780.017O.76100,590.440,00720,43O.740.540.0120,53150,320.230,00430,230,500.370,0075O.36200,180.13O.OO230.130.330,240.00450.24250.10O.O760,00150,0740.210.15O.OO270.15300.059O.O4OO.0400.120,0810.0018O.O79350.0340.0230.0230.0680,0460,00100,045400.020O.OI40.014O.O4O0.0260.0261 ...r.__Depth532 nm572 nmmE 0*dE11EE 0S, | Ed 5 uE51.000.780.0110 = 771.000,76O.OO840.7510O.720,560.00780.55O.560.430,0054O.4215O.520.390.0057O.380.330,230.00330.23200.350,260,00400,260.180.120.00200.12250.240,180.00310,180.095O.O660,0011O.O65300.160.110.00250,110.051O.O340.034350.10O.O670.0017O.O690,028O.OI70,017400,0630.0410.0011O.0420,014O.OO9IO.OO91"•*" • •••'••' "•
Table IVStation J1AsE , E,, Eo T d* umd in normalized values of E (z )O' o'Depthm0.5510152025303540E01.000.680.470.320.210.14O.O890,0580.032372E d !st0.88 jO.580*390.26ç ••• 7 10,11 !0.071 1 i10.046 j0,026 1nmEuO.025O.OI70.011O.OO78O.OO480,0030O.OOI7EO.85O.560.33c. 25O.I70.11O.O690,0460.026E 01.000.210.037O.OO78O.OOI9_~-E d633o°970.200.0340.00680.0017_--nmE u0.0010-------E"0.970.20O.O34O.OO680,0017-—-Depthmni'.iEI 477 nmuE0,55101520253035401,000.880.720.580.500.410.33O.250.19.01•54.423527221713.036 ! 0,76 1.000310.84025020015012OO870042i 0.51 O.75S , „r,\0.330.260.210.160.66O.55O.460,380.320.13 O.258274574940342823180 = 0330 = 0290,0240.020O.OI7O.OI30.0100.00790.0059O.790.71O.550.470.380.33O.270.220.17
Table IV, - continued.Station J1AsDepth532 nm | 572 nmmE0E clE uE I EI 0iE, I Ed j uE101,000,760.014O.751.000.86O.OO720,85150.66O.560.010o,550.70O.54O.OO52O.53200.470,400,00730.390.420.330,00350.33^5O.38O.320.00560.310.260.21O.OO240.21300.260,210,00380.210.17O.140,00170.14350.190,150,00280.150.110,0860.0012O.O85400.130,100,00190.100,0680,0530.053Table VStation J2E , E,- E and E in normalised values of E (2 )o' a 1 u 0 0 'Depth372 nm633 nmm0 dE I EuE 0T? ] T?d j uE0.51.000.88O.O36O.841.00O.950,00200.95•50.730,66O.O27O.630,240.210.2110O.56O.490.0210.47O0O4O0,037O.O37150.430.37O.OI50.350,00880,0081O.OO8I200,320.260.010O.250.00220,0019O.OOI9250,230.190,00650,18300.160.120.00380.1235O.O980.0710,0024O.O7I40O.O59O.O43O.OOI4O.O43
Table V, continued.Station J2;Depth532 nm572 nmmE oE a :S uEE 0E,&EE0,51,000,960.012O.951.001.010.00661,005100,850,620 = 790.59O.OO980,0078O.780,58O.740,45O.750,42O.OO480.0035O.750,42150.460.42O.OO600,410.310,28O.OO250.28200,350.30O.OO470.30O.I90.17O.OOI8O.17250,260.23O.OO360.230.130.110.00130.11300,190,170.0028O.I?O.O82O.O7O0.00100,06935400,140.0900.110.075 •0,0021O.OOI4O0II O.0530.74 : 0,032O.O45O.O27O.O45O.027450,0560,0460,00100.0450.0210,017O.OI7500,0400,0300.0300.0120.0100.010550,0300,0220.022O.OO780.0063O.OO63600.0230,0170.017O.OO480.00370.003765G.0170,013-0,013700,0130,009110.0091
Table V, continued.Station J2sDepth427 nm477 nmmE E,0 dE uT? 1 TPiLJii °TT 1E uE0.51.00Oo74O.O420.701.000.800.0340.7750.81O.590.0370 SR0.80O.78O.0310.7510O.730.530.0310.50O.69O.64O.0270.61150.610.460,0250.43O.63O.55O.023O.53200.560.370.0200.350.59O.480.0190.46250.490.32O.OI5O.300.53O.420.0160.40300.39O.240.0110.230.450.350.0130.34350.31c 190.00800.180.38O.290 = 0100.28400.230.150.0053O.140.320.240.00790.23450.170.110.00370.110.260.190.00580.18500.12•0.0750.00230.0730.20O.150.0044O.1555O.O880.0530.00160.0510.160.120.00330.1260O.O6O0.0360.00100.0350,12O.O9OO.OO240.08865O.0400.025'0.025O.O930.0680.00180.06670O.0270.0150.015O.O7I0.0510.0014O.050
Table VIStation H9ÎE , E,, E and E in normalized values of E (z )o' d' u o v o JDepthmT710372 nmdE uEE 0E d033 nmE uEn15101.000.0550.00290.770,0440.00280.0022O.77O.0440.00281.000,21O.O250.75O.I6O.OI80.00160.750.160,018Depth477 nm ! 572 nmmE ! E^0 I dE uE | El 0E dE uE15101.000,520,19O.77O.360.12O.OO8IO.OO42O.OOI5O.760.360.121.00O.54O.270.730.340.17O.OO6O0.00390,0020O.720.340.1715o,o8iO.O54O.O54O.I50.0960,096200,034O.O240.02425300.0160.00660.0110.00470.0110,0047
M>r-H•§EHCMMO•H-Pcd-PmHto0ci>niCDN•H•3Ss-tOÜ•HHTJHMnrOrOvOfiCMr—rO&-PP.CDHHPiElTTJP-qopqH2W—,—nrjWOHSMOt—OOoroOOOvoc—0ooov-1i11+ol111oCT\OooLAoo ooT-OOooMDÛOoLO,ooo\V"COooOLACOmVOOLOc-d^t•*+OO «OLO,OroCOOv~\—ooOO *roOOOo^-~
Table VIIIStation AsDepthm101520253035akm151372 nmSOLAR EL. 68°K.. a/K,d ' d1km-1!171—0,88a, -1Km53 = 856.263*075 = 377.472.2427 nmSOLAR EL. 74°K.a1 -1km77-080.289.6107115111a/K dakm0,70 82.9O.7O 84.9O.7O J 78.90,71 79=80.67 78.1O.65 i 71.7477 nmSOLAR EL. 68°dkm116122113114117108a/K d0.71O.7OO.7O0.70O.670.66Depthm101520253035a! ' ' '486 nm ! 513 nmSOLAR EL. 74° SOLAR EL. 68°, "1Km4O.745-764-566.462.553-0K 1dikm_ 156 = 563.190,999-592.786.7- 1 —a/K,' dO.720.72 -0.710,67O.670.61- . „ , M — , , _H,km53,361.668.972.765.I62.8ai -1km7-1
T aille IXStation A:Depth372 nm427 nm477 ranma/K-, cos 9CLSa/K., cos G;cisa/K, cos 9' cl s100 = 920.710,7415-0.710o7320-0 = 710.7325-0.720.73300,680.7035""0 = 660.69Depth4.86 nm— — . — • • - - i 'i513 nm532 nmma/K d cos 9 oa/K., cos 9' a sa/K, 7dcos Gs10150 = 730 7^0,780 = 75O.77 •O.76200,720.710«74250,680.720 = 74300.630.66O.800.680.660 = 70• - • " •••" -• . , .. . .1Depthm1015202530572 nma/K. cos 9' d s0.770 = 700 = 68O.700.680.63633 nma/K, cos 9' d G0.80O.79----
Table XStation J1AsDepthm372 nmSOLAR EL. 62°427 nm (I)SOLAR EL. 74°477 nm (I)SOLAR EL. 61°ada/K daK da/K daK -dl a/K..' dkm"kmkm"km"km" 1km•5101520253035.....70.363.865.864.O68.068.479.785.7 0.8279.1 . O.8183.8 0.7983.6 0.7786.4 0.7989.1 O.77102 0.78„26.226.628.530.130.434.742.1 0.6237.3 0.7143.6 . 0.6843.2 0.6647.3 O.6448.7 0.6254.6 O.6433-430.524.524.426.128.128.937.941.135.635.136*640.542.30.880.74O.69O.700.71O.690.68Depthmakm532 nmSOLAR BL. 53°K dkma/K dakm"572 nmSOLAR EL. 74°K dkma/k,' d633 nmSOLAR EL. 68°a K,-1 -1km kma/K d51015202 5 ;303554.146.653.461.255.064.956.O66.077.070.60.830.830.810.79O.7873.471.971.071.273.295.292.987.99O.994-60.77.0.770.81O.78O.773423062623533383010.97O.91O.87
Table X, continued.Station J1AsDepth427 nm (II)477 nm (il)mSOLÅR EL, 70°SOLAR EL, 75°a,km~K d1 ~1 kma/K dkmKakma/K d522,533.20.6821,926.90,811024.735.00,7126,031.80.821523,135.20.6626,537.60,702030.344,60,6826,738.8O.692537.957.90,6528,642,10,683037*557.5O.6528,242,10,673539.459.20,6731,645.4O.704040.861.40,6638,956.90,684544,567,80.6641.362,30,665037.356,50,66Depth486 nm513 nmmSOLAR EL. 70°SOLAR EL, 69°akmdkm' da-1kmdkma/K d51023.832,20,741524-134.40,7037,352.40.712026.335.80.7337.754.4O.692531,742,10,7537.756.2O.673035.250,50,7038.858,00,673532,847.10.7038.258,4O.65. - • • . „ M . - , |—, .-.„„—^—NOTEsI 427 and I 477 nm are measured 12.6.1971II 477 is measured 13.6.1971II 427 in measured 18,6.1971
Table XIStation J1AsDepth372 nmI 427 nmI 477 nm532 nm572 nmma/K, cos 0' d sa/K n cos 91&sa/K, cos 9' d sa/K cos 9CLkja/K, cos 9^•50,87O.63O.94-100.860,720.79--150 = 840 = 69O.740.930.7920250,820,840,67O.650,750.760.930.900=790,83300.820.63O.740.880 D 8035O.830 = 650.730.870.79Depth633 nmII 427 nmII 477 nm486 nm513 nmma/K., 1 cos 9d sa/K., 1 cos 9d sa/K, 1 cos 9ci sa/K- 1 cos 9d sa/K, 1 cos 0d s51.010.700.83--10150-950,910-730.680.840.71O.760.72-O.73202530-. _-0,700,67O.670.700.690.680.75O.770.720.710.690.693540-->O.690.68O.71O.690.72-0.67-45-0.680.67_-50--O.67-""
Tahle XIIStation J2;Depth372 nmr— "' -427 nm477 nmmSOLAR EL. 72°SOLAR EL, 64°SOLAR EL, 60°aI K^a/K dK da/K,K da/K d-1 -1km kmkmkmkmkm~"553 = 161.3O.8724=535 = 40,6922,824=31—0,941049 = 362,20.7917 = 526,3O.6730.735 = 00,881551.363=30.8125,635-70.7223 = 724=9O.95•2051=963 = 30.8222.135.70.6226,527.4O.972557.874=20.78 :26.944.10,6123 = 932.2O.743070.7•92.40*7729.251 = 2O.5727.037=20,733573 = 61000.7328,848.70,5928.038.20.734035 = 958.70,6128.840.80,714539 = 666.00.6032.544=7O.735042,369,00.6134=548.OO.72Depth532 nm572 nm 633 nmmSOLAR EL. 73°SOLAR EL. 68° | SOLAR EL. 74°akmkmAa/K da I K,-1 -1km I kma/K,aj kmdkma/K d546.751 = 40.9192.991=81.01308342O.9O1059 = 764=5O.9393 = 81000.94306327O.931559 = 165.5O.9O79 = 689.4O.89276298O.922052,561,00.8680.991-4O.892550.159.80.8477 = 490.40.863057 = 468.30,8476.490,40.853565 = 379 = 00.8380.796.50.844075 = 491.50.8280.096.00.834572.390,80.8080.497=50.825054=1. — J71=80=7579 = 8100O.80
Table XIIIStation J2ÏDepthm372 nma/K, 7 cos 8d s427 nma/K, 1 cos 8d s477 nma/K, 1 cos 8d s50.910.731.01100.820.710.9515200.840o850.760.661.021o05250.81O.650.80300.800.60O.7935404550O.76_--0.62O.65O.630.650,790.77O.790.78Depth532 nm572 nm633 nmma/K, 1 cos 9d sa/K, cos 0!d sa/K, 1 cos 0d s51015200 = 93O.950.920.881.050.98O.930*93O 0 92O.95O.94-25300.860.86O.90O.89--35O.850.87-400.840.86-450.820.85-50O.760.83-
Table XIVStation H"9:Depth372 nm477 nmmSOLAR EL. 41°SOLAR EL. 37°aK da/K daK ,da/K dkm"kmkmkm55056360.79137200O.6910126A 89O.6715109162O.67201111560.7125117!160O.73Depth572 nm633 nmtøSOLAR EL. 45°SOLAR EL. 42°akmkm""a/K da, -1kmK d, -1kma/K d51031630.633054050.7510791280,62152025Table XVStation H9:Depth372 nm477 nm572 nm633 nmma/K, cos 0asa/K, cos 6CL 5a/K- cos 07d 3a/K, cos 01ds5O.960.86O.75O.9110~0.830.73-15-0,84--20-0.89_-25-0.91--
Table XVIStation H2:1 " , " •"• ' •" '1Depthmakm372 nmSOLAR EL. 42°km°A dakm477 nmSOLAR ELo 45°a/Kddkmakm532 nmSOLAR EL. 45°& a/K dkm151015202530353403740.91|_. .—, , 1 , ,1 !1421191069375199186172149118O.7IO.640 = 620.62O.64107999588777271152151147129112104101O.7O0.660.650.68O.69O.69O.70Depthma572 nmSOLAR EL. 39°K da/K da633 nmSOLAR EL. 44°K da/K dkmkmkmkm1510152025127107100105105178159149145139O.710.67O.670,720.763083012944234244100.730.71O.72
Table XVIIStation H2;Depth372 nm477- nm532 nm572 nm633 nmma/K. cos 9' d sa/K 7 cos 0' d sa/K, cos Q' d sa/K cos 8Q. Sa/K. cos 61ets11.10---0.865-0.840.83O.870,8410-0.75O.780.82O.8515-0.73O.770.82-20-0.730,800.88-25-0.750.81O.93-30--0.81--35--O.83-1—Table XVIIIStation H1%Depth372 nm477 nm633 nmmSOLAR EL. 47°SOLAR EL. 47°SOLAR SL. 45°0*akm1195K dkm~* '-1215a/K,' dO.98akmkm°A dakmK^d— 'Skma/K d1915923O.995482717O.671561920.812764160.6610146202O.722774070.68151652340,7120146201O.85—
Table XIXStation H1;Depthm372 nma/K, ; cos 6d s477 nma/K, cos G1ds633 nma/K, cos 9' d s0*1.15_15101.160 = 79--0.950.85.-0 = 790.8115-0.82-20-0.99-Table XXStation Rogdabergneset.Depth372 nm532 nmmSOLAR EL 0 45°SOLAR EL. 35°akmA, -dkma/K'dkmdkma/K d1101012490 = 81510101012490.811181740,68152025—3035—
Table XX, continued.Station Rogdabergneset:Depth— " • • • " —572 nm633 nmmSOLAR EL. 39°SOLAR EL.40°aK da/K dada/K dkmkmkmkmA5112166O.672924180,7010151111041671640.660,63302-411-0.73_20108169O.64--_25104167O.62---30------35106148O.72---Tabic XXIStation RogdabergnesetsDepth372 nm532 nm572 nm633 nmma/K, cos 9d sa/K, cos 8CLSa/K. 1 cos 8d sa/K., 1 cos 0d s1O.96--5O.960.860,830,8510--0,82O.9015--O.78-20--O.78_25-_O.76-30----35-_0.88
Table XXIISalinity (S °/ ) and temperature (t C-) VS depthsDepthSTATIONm0H9q 0/b /oo30.4t° ! i8.4S24» 1/oo1 E2t°9 = 4S % o20.2H14-°07.8ROGDABERGNESETS %o17.2*°II.5130.58.324.88.824.27-617„211-45230.58.226.29.027-77.724.311.4330.58.227.48.630.07-427-310.3A5630.530,630.68.28.18.028.129.530.08.0,'.07-430.33O.430.47-27.06.828.328.829.59-859.18.681030.730.87-97.831.431.56.45-530.831.06.05-629-530.08.38.0121430.931 - 07«77.631.831.95.25.031-231.65.85.630,57.77-416182031.131.131=17.57-47-432.132.332.35.05.05.031.731-932.105.45.35-330.831.131-36.8c; onJ" ^J2531.27»332.85.232.675*432.35.23031.67-033.385*633,055-832 = 655.33540455031.832.7333 = 4933.547.06.66.26.333.70J l T'2JV./Ï134.5O6.26s7.07*333.4633-89' 34-0934- 286.26.87.07-2i33.1533-653 J " L TJ34- 2015.76^6.87.2
•••Tabic XXIIIStation A + A2sDepthSTATION ASTATION A2STATION Am0-1a km633 nm-D km655 ran120To km655 n^94„, -1c km633 nm°C,,,18.5L, i O0 //oo35 = 945-12980---102751349644018 = 036 = 0515251142112-17.8536,0120-153121-17 = 7736.0725-147126-17 = 5236.1030-152118-17.0536 = 123540_-1431407976-_16.9516,6236.1636.2045-12172-16.4536.2450-10271-16.0336.4255_10475_15-9836.4760-8676-15-6036.6665_8483-15-4036.6870-8676-15.4036.7175-8977-15-2236.8580-8176-15 = 0536.9885_8477-14-9837 = 1190-7886-14-9337-1695100--95768382_340----110-75—-_.,— ...
• -, ,Table XXIVS ta.tion D + D2Depthm0510STATION Da km"*"372 nm 633 nm_ _53,453.0306295b km655 nm444343380 nmÎ1011090STATION Dc >-1c krr 1L —633 nm 655 nm- 370- 370320 370t°C23.60--1561.1-42110-370-202586.487 = 4--4244110110--37037020.35-3035404550556052.6__--------_--495255^545253150190230240240240230----__-380410420420420420410-_--H.58--65--54240-420-707580------576260260260270-390-420420430--13.503590 •95TOO--__----51434139230180HO13Ö---290410360340330--13.20
X!X!CUr—1X>aEH^fiO•r-t+Jrô-MCQCO ^-M1fc!J4uiCI^J.ûr—aniX!4->P- ;4>P00ooosÖITS•JT\VORÖoCOrOLO\mvoSrOrOvoICMF 3covot—rOmmoVOrOOmv-OOJ•r-I1O11OvorOO^NOOJv_CM
- •Table XXVIStation J2Depthm0510152025303540455055606570757780859095100372nm53.149*351.351 = 957-870.773.6-_------------a km633nm-308306276-----_-~--~-------"b km655 nm35333535373739394142444849525458585044411 3734tc km38O nm 655 n^130 340130 34014O 340140 340150 340170 350200 360200 360220 360220 36Or\ r\r\23024O24O29O310-27O260230180170360370390380410440-4303903603403300tC20 o 70-19*77-18„60-17 0 00-15.80-14.85-14,62-14=38--14.17S/oo37.35_37 »56-37-53-37.63-37.57-37=81-37 = 92-38.01--38 o 02^- • — „ -,:. n-
Table XXVIIStation A;Depthmred< ß(45° ) >Rel 0greenunitsbluei/oo !t0 c0_" •--16,40501.791.571.0536.50515.771001 0 661.421.0437.46114.272001,541.320.9738.43613.03300O.960.910 o 6438.54513.004000,910,830„6238056012.985000.990.86O.67--540--38.55012.936001,110.94O.74_-640---38.53012.937001.03O.870.67--740---38,51612.90800O.90O.84O063--8300.95O.850.62--8401.131.02O.7638.49912.888501,04O.97O.76--8601,06O.96O.77--870i.1.191.01O.7838.49012.88Depth to bottom : 88O m
Table XXVIIIStation BsDepth< ß (red45°) }> Rel.greenunitsblueS0 / /oot°C5001,080.95O.7238.38713.157501,181,050,8938.40313.0310001.091,000,8438.42512,9612501,111.010,9338.33912.9515001.231,080,9038.39512,941750O.870.750.6038,39312,9720001.000,89O.7338.39113.0322501.000,870.7038.39113 = 0425OO1.010.930,7538.39113.0926001,130.970,7638.40713.10268027OO0,85O.890,81O.810,590.6038.39738.39113.1213.1527200,890,820.6038.39113.1127301.151,02O.84-13.122740O.92O.85O.72-13.12I Depth to bottoms 2750 m
•Table XXIXStation C:Deptho< ß (45 )> Rel. unitsstmredlgreenblue°/oo°C0-37.18218.40251.121.000,8637.148-501 .861.521 .2337.24214. 111001231.050.9037.82713.231501040.930,7838,47013.002001151.020.8538.27613. 1430026051111030.970.950.810,7838.07038.39213. 1513. 1226301120.970.8538.38813. 1226500950.930.8338.39413. 1426601 .261. 160.9838.39813. 1526701231.150.9738.39513. 14i! Depth to bottom: 2680 mTable XXXStation D2:Depthm0205080100150< ß (45°)> Rel. units, ired1. 141.051.231.241.040,99green1.010.951.081.070.930.88blue0.820.770.840.840.740.74t°c23.6020.3514.5813.5013.2013.13
- •TableXXXIStation B:Depthm Rel. unitsred green blue /oo019.4025311. 189537.17750371.249934.42013.9310030200237.88313.3015020030015131707031091848838.01638.06138,18212.9312.99Depth to bottom: 2750 mStation B2:Depth Rel. unitstmredgreenblue01.070.940.7721.90200.970.860.7119.31501. 161.040.8314.30801.050.930.7513.401000.830.780.6513.201500.910.850.7112.932003001.030.950.940.850.790.7113.2513.004000.950.860.7313.22
Table XXXIIStation A ;Depthm< p (45°)> Rel. unitsredgreenblueckJo ,/oot0--36.37716.40251.181.010.7936.367-501. 371.251 .0236.49115.821001,281.130. 8637.44413.802001.151.010.7838.23613. 123001.141.000.7938.34113.004000.930.860.6938.36212.98Depth tobottom: 860mStation A2;Depthß (45°)Rel,unitstmredgreenblue°C0--23. 15201.491 .291 .0920.22501.691 .571 .2617.44801 .251 . 180.9616.601001.101 .020.8516.201501 .261 . 150.9514.982001 .221.130. 9613.483001 . 371.301 .0813. 044001. 161.090.9213. 10Depth to„*_..... .bottom: 135 0 m