GOLD ENVIRONMENTS AND FAVOURABILITY
GOLD ENVIRONMENTS AND FAVOURABILITY
GOLD ENVIRONMENTS AND FAVOURABILITY

You also want an ePaper? Increase the reach of your titles
YUMPU automatically turns print PDFs into web optimized ePapers that Google loves.
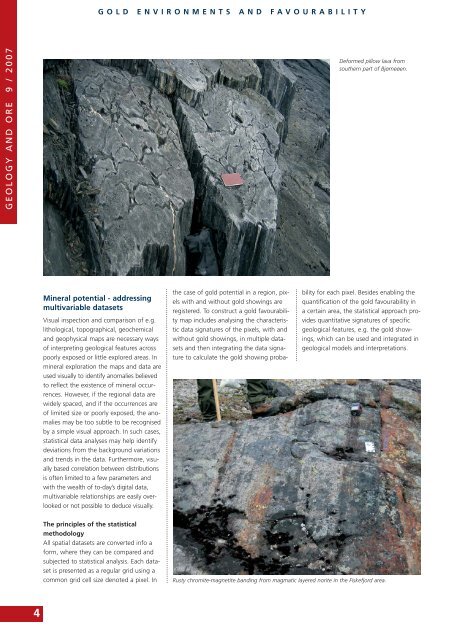
<strong>GOLD</strong> <strong>ENVIRONMENTS</strong> <strong>AND</strong> <strong>FAVOURABILITY</strong>GEOLOGY <strong>AND</strong> ORE 9 / 2007Deformed pillow lava fromsouthern part of Bjørneøen.Mineral potential - addressingmultivariable datasetsVisual inspection and comparison of e.g.lithological, topographical, geochemicaland geophysical maps are necessary waysof interpreting geological features acrosspoorly exposed or little explored areas. Inmineral exploration the maps and data areused visually to identify anomalies believedto reflect the existence of mineral occurrences.However, if the regional data arewidely spaced, and if the occurrences areof limited size or poorly exposed, the anomaliesmay be too subtle to be recognisedby a simple visual approach. In such cases,statistical data analyses may help identifydeviations from the background variationsand trends in the data. Furthermore, visuallybased correlation between distributionsis often limited to a few parameters andwith the wealth of to-day’s digital data,multivariable relationships are easily overlookedor not possible to deduce visually.the case of gold potential in a region, pixelswith and without gold showings areregistered. To construct a gold favourabilitymap includes analysing the characteristicdata signatures of the pixels, with andwithout gold showings, in multiple datasetsand then integrating the data signatureto calculate the gold showing probabilityfor each pixel. Besides enabling thequantification of the gold favourability ina certain area, the statistical approach providesquantitative signatures of specificgeological features, e.g. the gold showings,which can be used and integrated ingeological models and interpretations.The principles of the statisticalmethodologyAll spatial datasets are converted info aform, where they can be compared andsubjected to statistical analysis. Each datasetis presented as a regular grid using acommon grid cell size denoted a pixel. InRusty chromite-magnetite banding from magmatic layered norite in the Fiskefjord area.4