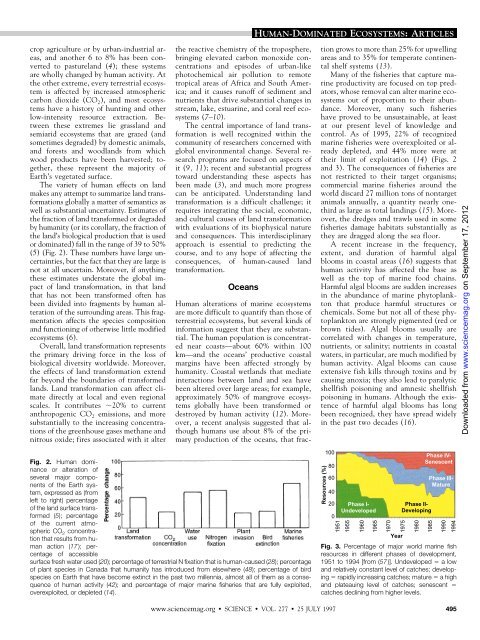
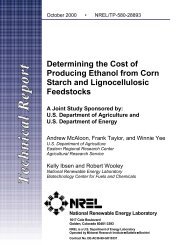
Alterations <strong>of</strong> theBiogeochemical CyclesCarbon. Life on Earth is based on carbon,and the CO 2in the atmosphere is the primaryresource for photosynthesis. <strong>Human</strong>ityadds CO 2to the atmosphere by mining andburning fossil fuels, the residue <strong>of</strong> life fromthe distant past, and by converting forestsand grasslands to agricultural and otherlow-biomass ecosystems. The net result <strong>of</strong>both activities is that organic carbon fromrocks, organisms, and soils is released intothe atmosphere as CO 2.The modern increase in CO 2representsthe clearest and best documented signal <strong>of</strong>human alteration <strong>of</strong> the Earth system.Thanks to the foresight <strong>of</strong> Roger Revelle,Charles Keeling, and others who initiatedcareful and systematic measurements <strong>of</strong> atmosphericCO 2in 1957 and sustained themthrough budget crises and changes in scientificfashions, we have observed the concentration<strong>of</strong> CO 2as it has increased steadilyfrom 315 ppm to 362 ppm. Analysis <strong>of</strong> airbubbles extracted from the Antarctic andGreenland ice caps extends the record backmuch further; the CO 2concentration wasmore or less stable near 280 ppm for thousands<strong>of</strong> years until about 1800, and hasincreased exponentially since then (17).NP60°30°EQThere is no doubt that this increase hasbeen driven by human activity, today primarilyby fossil fuel combustion. The sources<strong>of</strong> CO 2can be traced isotopically; beforethe period <strong>of</strong> extensive nuclear testing inthe atmosphere, carbon depleted in 14 C wasa specific tracer <strong>of</strong> CO 2derived from fossilfuel combustion, whereas carbon depletedin 13 C characterized CO 2from both fossilfuels and land transformation. Direct measurementsin the atmosphere, and analyses<strong>of</strong> carbon isotopes in tree rings, show thatboth 13 C and 14 CinCO 2were diluted inthe atmosphere relative to 12 C as the CO 2concentration in the atmosphere increased.Fossil fuel combustion now adds 5.5 0.5 billion metric tons <strong>of</strong> CO 2-Ctotheatmosphere annually, mostly in economicallydeveloped regions <strong>of</strong> the temperatezone (18) (Fig. 4). The annual accumulation<strong>of</strong> CO 2-C has averaged 3.2 0.2billion metric tons recently (17). The othermajor terms in the atmospheric carbonbalance are net ocean-atmosphere flux,net release <strong>of</strong> carbon during land transformation,and net storage in terrestrial biomassand soil organic matter. All <strong>of</strong> theseterms are smaller and less certain thanfossil fuel combustion or annual atmosphericaccumulation; they represent richareas <strong>of</strong> current research, analysis, andsometimes contention.The human-caused increase in atmosphericCO 2already represents nearly a30% change relative to the pre-industrialera (Fig. 2), and CO 2will continue to increasefor the foreseeable future. IncreasedCO 2represents the most important humanenhancement to the greenhouse effect; theconsensus <strong>of</strong> the climate research communityis that it probably already affects climatedetectably and will drive substantialclimate change in the next century (1). Thedirect effects <strong>of</strong> increased CO 2on plantsand ecosystems may be even more important.The growth <strong>of</strong> most plants is enhancedby elevated CO 2, but to very different extents;the tissue chemistry <strong>of</strong> plants thatrespond to CO 2is altered in ways thatdecrease food quality for animals and microbes;and the water use efficiency <strong>of</strong>plants and ecosystems generally is increased.The fact that increased CO 2affectsspecies differentially means that it is likelyto drive substantial changes in the speciescomposition and dynamics <strong>of</strong> all terrestrialecosystems (19).Water. Water is essential to all life. Itsmovement by gravity, and through evaporationand condensation, contributes to drivingEarth’s biogeochemical cycles and tocontrolling its climate. Very little <strong>of</strong> theDownloaded from www.sciencemag.org on September 17, 201230°60°SP180° 120°W 60°W 0°60°E120°E180°50 100 150 200 250 300 350 400 450Emissions (g m -2 year -1 )Fig. 4. Geographical distribution <strong>of</strong> fossil fuel sources <strong>of</strong> CO 2 as <strong>of</strong> 1990. The global mean is 12.2 g m 2 year 1 ; most emissions occur in economicallydeveloped regions <strong>of</strong> the north temperate zone. EQ, equator; NP, North Pole; SP, South Pole. [Prepared by A. S. Denning, from information in (18)]496SCIENCE VOL. 277 25 JULY 1997 www.sciencemag.org