Synopsis - Clinical Trials at Novo Nordisk
Synopsis - Clinical Trials at Novo Nordisk
Synopsis - Clinical Trials at Novo Nordisk

Create successful ePaper yourself
Turn your PDF publications into a flip-book with our unique Google optimized e-Paper software.
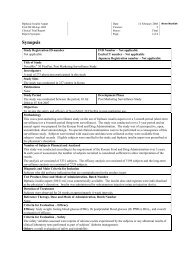
Insulin detemir D<strong>at</strong>e: 07 November 2005Trial ID: NN304-1476 Version: 2Integr<strong>at</strong>ed <strong>Clinical</strong> Trial Report St<strong>at</strong>us: Final<strong>Synopsis</strong> Page: 3 of 8<strong>Novo</strong> <strong>Nordisk</strong>Other criteria: Insulin doses, Insulin tre<strong>at</strong>ment questionnaire (questions concerning glycaemic control, insulin therapyrel<strong>at</strong>ed QoL <strong>at</strong> night [ITR-QOLN] and insulin tre<strong>at</strong>ment s<strong>at</strong>isfaction questionnaire Japan [ITSQ-J]) and antibodies(NN304 specific antibodies, insulin aspart [IAsp] specific antibodies, NN304-IAsp cross-reacting antibodies)STATISTICAL METHODSAll analyses performed for the 2 nd version of the integr<strong>at</strong>ed clinical trial report were planned after d<strong>at</strong>abase release.Handling of SubjectsAll subjects who received <strong>at</strong> least one dose of trial product were included in the safety analysis. For all efficacyendpoints the analysis was performed on the FAS. The FAS consisted of all randomised subjects who had anyavailable efficacy d<strong>at</strong>a after receiving the trial product. The analysis of the primary endpoint was also performed onthe PPS.St<strong>at</strong>istical MethodsThroughout the analyses a significance level of a two-sided 5% and a confidence coefficient of 95% were used and nomultiplicity adjustment was performed.The last observ<strong>at</strong>ion carried forward (LOCF) approach was used for all endpoints <strong>at</strong> week 48 for subjects who had <strong>at</strong>least one valid post-baseline measurement.All analyses were performed in subjects with type 1 and type 2 diabetes separ<strong>at</strong>ely.Efficacy1) Primary endpointThe primary endpoint, HbA 1C after 48 weeks of tre<strong>at</strong>ment, was performed based on the Analysis of Variance(ANOVA) model with baseline HbA 1C (week 0) as a covari<strong>at</strong>e and tre<strong>at</strong>ment group as a fixed effect. A two-side 95%confidence interval for the difference in HbA 1C (NN304NPH human insulin) was constructed. The criterion forclaiming non-inferiority was defined as follows: the upper limit of the confidence interval is less than 0.4%.Superiority between tre<strong>at</strong>ment groups was evalu<strong>at</strong>ed based on the closed-testing procedure using the same confidenceinterval as the above.2) Secondary endpointsMean FPG derived from 7-day FPG (by self-monitoring <strong>at</strong> home) after 48 weeks of tre<strong>at</strong>ment was analysed in thesame way as the primary endpoint, i.e., using an ANOVA model with corresponding baseline (week 0) as a covari<strong>at</strong>eand the tre<strong>at</strong>ment group as a fixed effect.Within-subject vari<strong>at</strong>ion of 7-day FPG (by self-monitoring <strong>at</strong> home) before week 48 was compared between the twotre<strong>at</strong>ment groups using variance component models as follows:model 1: Y tds(t) = µ + α t + τ⋅w s(t) + σ⋅u tds(t) ,model 2: Y tds(t) = µ + α t + τ⋅w s(t) + σ t ⋅u tds(t) ,Y tds(t) : FPG for tre<strong>at</strong>ment t, day d and subject s(t), and (t) means ‘nest’,µ : overall mean,α t : tre<strong>at</strong>ment effect,τ : between subject standard devi<strong>at</strong>ion,σ : residual common standard devi<strong>at</strong>ion,σ t : residual standard devi<strong>at</strong>ion of tre<strong>at</strong>ment t, and all (w s(t) ) , (u tsd(t) ) being i.i.d. N(0, 1).The test was carried out as a likelihood r<strong>at</strong>io test, comparing the model 2 to the model 1.Daytime 7-point PG profiles within the last 12 weeks of the 48-week tre<strong>at</strong>ment period (by self-monitoring <strong>at</strong> home)and nightly 9-hour PG profiles within the last 12 weeks of 48-week tre<strong>at</strong>ment period (measured by the centrallabor<strong>at</strong>ory) (only in subgroup) were analysed using a repe<strong>at</strong>ed measures ANOVA model including tre<strong>at</strong>ment group,time and the tre<strong>at</strong>ment-by-time interaction as fixed effects and subject as a random effect.Safety1) Hypoglycaemic episodesThe incidence of hypoglycaemic episodes during the maintenance period was evalu<strong>at</strong>ed by estim<strong>at</strong>ing the rel<strong>at</strong>ive riskof having a hypoglycaemic episode in the NN304 group compared to th<strong>at</strong> in the NPH human insulin group. The