Synopsis - Clinical Trials at Novo Nordisk
Synopsis - Clinical Trials at Novo Nordisk
Synopsis - Clinical Trials at Novo Nordisk
Create successful ePaper yourself
Turn your PDF publications into a flip-book with our unique Google optimized e-Paper software.
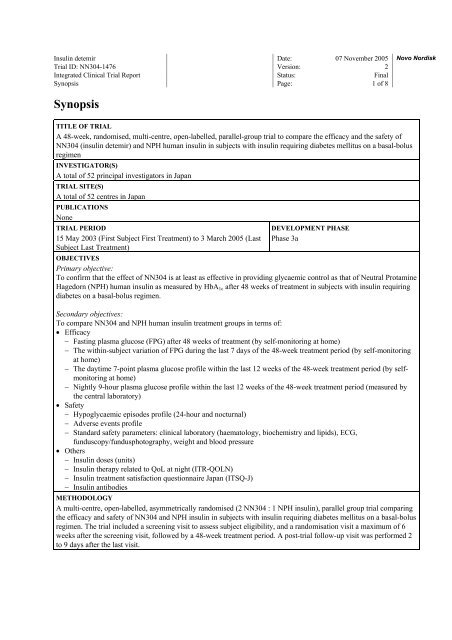
Insulin detemir D<strong>at</strong>e: 07 November 2005Trial ID: NN304-1476 Version: 2Integr<strong>at</strong>ed <strong>Clinical</strong> Trial Report St<strong>at</strong>us: Final<strong>Synopsis</strong> Page: 1 of 8<strong>Novo</strong> <strong>Nordisk</strong><strong>Synopsis</strong>TITLE OF TRIALA 48-week, randomised, multi-centre, open-labelled, parallel-group trial to compare the efficacy and the safety ofNN304 (insulin detemir) and NPH human insulin in subjects with insulin requiring diabetes mellitus on a basal-bolusregimenINVESTIGATOR(S)A total of 52 principal investig<strong>at</strong>ors in JapanTRIAL SITE(S)A total of 52 centres in JapanPUBLICATIONSNoneTRIAL PERIOD15 May 2003 (First Subject First Tre<strong>at</strong>ment) to 3 March 2005 (LastSubject Last Tre<strong>at</strong>ment)DEVELOPMENT PHASEPhase 3aOBJECTIVESPrimary objective:To confirm th<strong>at</strong> the effect of NN304 is <strong>at</strong> least as effective in providing glycaemic control as th<strong>at</strong> of Neutral ProtamineHagedorn (NPH) human insulin as measured by HbA 1c after 48 weeks of tre<strong>at</strong>ment in subjects with insulin requiringdiabetes on a basal-bolus regimen.Secondary objectives:To compare NN304 and NPH human insulin tre<strong>at</strong>ment groups in terms of:• Efficacy− Fasting plasma glucose (FPG) after 48 weeks of tre<strong>at</strong>ment (by self-monitoring <strong>at</strong> home)− The within-subject vari<strong>at</strong>ion of FPG during the last 7 days of the 48-week tre<strong>at</strong>ment period (by self-monitoring<strong>at</strong> home)− The daytime 7-point plasma glucose profile within the last 12 weeks of the 48-week tre<strong>at</strong>ment period (by selfmonitoring<strong>at</strong> home)− Nightly 9-hour plasma glucose profile within the last 12 weeks of the 48-week tre<strong>at</strong>ment period (measured bythe central labor<strong>at</strong>ory)• Safety− Hypoglycaemic episodes profile (24-hour and nocturnal)− Adverse events profile− Standard safety parameters: clinical labor<strong>at</strong>ory (haem<strong>at</strong>ology, biochemistry and lipids), ECG,funduscopy/fundusphotography, weight and blood pressure• Others− Insulin doses (units)− Insulin therapy rel<strong>at</strong>ed to QoL <strong>at</strong> night (ITR-QOLN)− Insulin tre<strong>at</strong>ment s<strong>at</strong>isfaction questionnaire Japan (ITSQ-J)− Insulin antibodiesMETHODOLOGYA multi-centre, open-labelled, asymmetrically randomised (2 NN304 : 1 NPH insulin), parallel group trial comparingthe efficacy and safety of NN304 and NPH insulin in subjects with insulin requiring diabetes mellitus on a basal-bolusregimen. The trial included a screening visit to assess subject eligibility, and a randomis<strong>at</strong>ion visit a maximum of 6weeks after the screening visit, followed by a 48-week tre<strong>at</strong>ment period. A post-trial follow-up visit was performed 2to 9 days after the last visit.
Insulin detemir D<strong>at</strong>e: 07 November 2005Trial ID: NN304-1476 Version: 2Integr<strong>at</strong>ed <strong>Clinical</strong> Trial Report St<strong>at</strong>us: Final<strong>Synopsis</strong> Page: 3 of 8<strong>Novo</strong> <strong>Nordisk</strong>Other criteria: Insulin doses, Insulin tre<strong>at</strong>ment questionnaire (questions concerning glycaemic control, insulin therapyrel<strong>at</strong>ed QoL <strong>at</strong> night [ITR-QOLN] and insulin tre<strong>at</strong>ment s<strong>at</strong>isfaction questionnaire Japan [ITSQ-J]) and antibodies(NN304 specific antibodies, insulin aspart [IAsp] specific antibodies, NN304-IAsp cross-reacting antibodies)STATISTICAL METHODSAll analyses performed for the 2 nd version of the integr<strong>at</strong>ed clinical trial report were planned after d<strong>at</strong>abase release.Handling of SubjectsAll subjects who received <strong>at</strong> least one dose of trial product were included in the safety analysis. For all efficacyendpoints the analysis was performed on the FAS. The FAS consisted of all randomised subjects who had anyavailable efficacy d<strong>at</strong>a after receiving the trial product. The analysis of the primary endpoint was also performed onthe PPS.St<strong>at</strong>istical MethodsThroughout the analyses a significance level of a two-sided 5% and a confidence coefficient of 95% were used and nomultiplicity adjustment was performed.The last observ<strong>at</strong>ion carried forward (LOCF) approach was used for all endpoints <strong>at</strong> week 48 for subjects who had <strong>at</strong>least one valid post-baseline measurement.All analyses were performed in subjects with type 1 and type 2 diabetes separ<strong>at</strong>ely.Efficacy1) Primary endpointThe primary endpoint, HbA 1C after 48 weeks of tre<strong>at</strong>ment, was performed based on the Analysis of Variance(ANOVA) model with baseline HbA 1C (week 0) as a covari<strong>at</strong>e and tre<strong>at</strong>ment group as a fixed effect. A two-side 95%confidence interval for the difference in HbA 1C (NN304NPH human insulin) was constructed. The criterion forclaiming non-inferiority was defined as follows: the upper limit of the confidence interval is less than 0.4%.Superiority between tre<strong>at</strong>ment groups was evalu<strong>at</strong>ed based on the closed-testing procedure using the same confidenceinterval as the above.2) Secondary endpointsMean FPG derived from 7-day FPG (by self-monitoring <strong>at</strong> home) after 48 weeks of tre<strong>at</strong>ment was analysed in thesame way as the primary endpoint, i.e., using an ANOVA model with corresponding baseline (week 0) as a covari<strong>at</strong>eand the tre<strong>at</strong>ment group as a fixed effect.Within-subject vari<strong>at</strong>ion of 7-day FPG (by self-monitoring <strong>at</strong> home) before week 48 was compared between the twotre<strong>at</strong>ment groups using variance component models as follows:model 1: Y tds(t) = µ + α t + τ⋅w s(t) + σ⋅u tds(t) ,model 2: Y tds(t) = µ + α t + τ⋅w s(t) + σ t ⋅u tds(t) ,Y tds(t) : FPG for tre<strong>at</strong>ment t, day d and subject s(t), and (t) means ‘nest’,µ : overall mean,α t : tre<strong>at</strong>ment effect,τ : between subject standard devi<strong>at</strong>ion,σ : residual common standard devi<strong>at</strong>ion,σ t : residual standard devi<strong>at</strong>ion of tre<strong>at</strong>ment t, and all (w s(t) ) , (u tsd(t) ) being i.i.d. N(0, 1).The test was carried out as a likelihood r<strong>at</strong>io test, comparing the model 2 to the model 1.Daytime 7-point PG profiles within the last 12 weeks of the 48-week tre<strong>at</strong>ment period (by self-monitoring <strong>at</strong> home)and nightly 9-hour PG profiles within the last 12 weeks of 48-week tre<strong>at</strong>ment period (measured by the centrallabor<strong>at</strong>ory) (only in subgroup) were analysed using a repe<strong>at</strong>ed measures ANOVA model including tre<strong>at</strong>ment group,time and the tre<strong>at</strong>ment-by-time interaction as fixed effects and subject as a random effect.Safety1) Hypoglycaemic episodesThe incidence of hypoglycaemic episodes during the maintenance period was evalu<strong>at</strong>ed by estim<strong>at</strong>ing the rel<strong>at</strong>ive riskof having a hypoglycaemic episode in the NN304 group compared to th<strong>at</strong> in the NPH human insulin group. The
Insulin detemir D<strong>at</strong>e: 07 November 2005Trial ID: NN304-1476 Version: 2Integr<strong>at</strong>ed <strong>Clinical</strong> Trial Report St<strong>at</strong>us: Final<strong>Synopsis</strong> Page: 4 of 8<strong>Novo</strong> <strong>Nordisk</strong>maintenance period was defined as the interval from 4 weeks after the first d<strong>at</strong>e on trial product [week 4 excluded] toone day after the last doing day. In order to estim<strong>at</strong>e this rel<strong>at</strong>ive risk, all hypoglycaemic episodes occurring during themaintenance period were analysed as recurrent events using a gamma frailty model. This model is an extended Coxregression model including a random effect (following a gamma distribution), which acts multiplic<strong>at</strong>ively on thebaseline hazard function and describes the excess risk (or frailty) for a subject. Tre<strong>at</strong>ment group was included as acovari<strong>at</strong>e in the model.The same analysis was performed for each of the following subsets of hypoglycaemic episodes: major hypoglycaemicepisodes, minor hypoglycaemic episodes, symptoms only hypoglycaemic episodes, biochemical hypoglycaemiadefined as asymptom<strong>at</strong>ic plasma glucose value < 3.1 mmol/L (≤ 55 mg/dL).Nocturnal (23:00-06:00) hypoglycaemic episodes were also analysed in exactly the same way as the above.2) Adverse eventsTre<strong>at</strong>ment emergent adverse events (TEAEs) were summarised by tre<strong>at</strong>ment groups by MedDRA system-organ classand MedDRA preferred term, severity and rel<strong>at</strong>ion to trial product. TEAE was defined as an adverse event reportedfrom the first dosing day to the post-trial visit.3) <strong>Clinical</strong> labor<strong>at</strong>ory variables, ECG, funduscopy/fundusphotography, weight and blood pressure<strong>Clinical</strong> labor<strong>at</strong>ory variables were summarised by descriptive st<strong>at</strong>istics by visit and tre<strong>at</strong>ment group, and changes ofvariables were presented by figures. Shift tables rel<strong>at</strong>ing to the reference range and showing changes from baselinewere presented for each variable. All clinical labor<strong>at</strong>ory values outside normal range were listed.ECG and funduscopy/fundusphotography were summarised by shift tables. Blood pressure was summarised bydescriptive st<strong>at</strong>istics by visit and tre<strong>at</strong>ment group. Weight after 48 weeks of tre<strong>at</strong>ment was analysed in the same wayas the primary endpoint with baseline weight (week 0) as a covari<strong>at</strong>e.Other1) ITR-QOLN and ITSQ-JTotal score was calcul<strong>at</strong>ed, and was analysed in the same way as the primary endpoint with corresponding baselinescore as a covari<strong>at</strong>e. ITR-QOLN and ITSQ-J were composed of several factors including nocturnal hypoglycaemicepisodes. Total score by each factor was also analysed.2) Insulin dosesChanges in mean daily insulin doses were graphically presented by tre<strong>at</strong>ment group. Mean daily insulin doses after 48weeks of tre<strong>at</strong>ment were compared between the two tre<strong>at</strong>ment groups. Dose r<strong>at</strong>io (NN304/NPH) of mean basal insulindose after 48 weeks of tre<strong>at</strong>ment was calcul<strong>at</strong>ed.3) Insulin antibodiesChanges of antibodies was graphically presented for each subject. Tre<strong>at</strong>ment group comparison <strong>at</strong> week 48 wasperformed by Wilcoxon rank sum test.DEMOGRAPHY OF TRIAL POPULATIONBaseline characteristics <strong>at</strong> screening visit for all subjects included in the safety popul<strong>at</strong>ion are shown below:Subjects with type 1 diabetesNN304 NPH human insulin TotalSafety popul<strong>at</strong>ion 196 98 294N (%) N (%) N (%)SexMaleFemale81 (41.3)115 (58.7)49 (50.0)49 (50.0)130 (44.2)164 (55.8)Mean (SD) Mean (SD) Mean (SD)Age (years)42.4 (14.2)Body weight (kg)58.27 (8.95)BMI (kgm 2 )22.35 (2.65)Dur<strong>at</strong>ion of diabetes (years)13.43 (8.18)Dur<strong>at</strong>ion of current basal-bolus regimen (months) 15.20 (17.90)HbA 1C (%) #7.40 (0.97)Mean FPG (mg/dL) # 170.12 (51.18)#: The d<strong>at</strong>a was <strong>at</strong> week 0.41.8 (13.5)60.02 (8.40)22.40 (2.72)13.01 (8.47)16.07 (14.50)7.42 (1.16)176.89 (57.61)42.2 (14.0)58.86 (8.80)22.37 (2.67)13.29 (8.27)15.49 (16.82)7.41 (1.04)172.36 (53.38)
Insulin detemir D<strong>at</strong>e: 07 November 2005Trial ID: NN304-1476 Version: 2Integr<strong>at</strong>ed <strong>Clinical</strong> Trial Report St<strong>at</strong>us: Final<strong>Synopsis</strong> Page: 5 of 8<strong>Novo</strong> <strong>Nordisk</strong>Subjects with type 2 diabetesNN304 NPH human insulin TotalSafety popul<strong>at</strong>ion 67 35 102N (%) N (%) N (%)SexMaleFemale36 (53.7)31 (46.3)25 (71.4)10 (28.6)61 (59.8)41 (40.2)Mean (SD) Mean (SD) Mean (SD)Age (years)55.2 (13.3)Body weight (kg)63.23 (10.98)BMI (kgm 2 )24.21 (3.20)Dur<strong>at</strong>ion of diabetes (years)14.13 (7.54)Dur<strong>at</strong>ion of current basal-bolus regimen (months) 11.88 (6.39)HbA 1C (%) #7.66 (1.11)Mean FPG (mg/dL) # 167.64 (48.54)#: The d<strong>at</strong>a was <strong>at</strong> week 0.58.1 (12.2)62.69 (11.72)23.90 (2.99)15.26 (8.59)10.14 (5.25)7.58 (1.11)154.20 (38.59)56.2 (13.0)63.05 (11.18)24.10 (3.12)14.52 (7.89)11.28 (6.05)7.63 (1.11)163.02 (45.62)Both in subjects with type 1 and type 2 diabetes, a higher proportion of female subjects was seen in the NN304 groupthan in NPH human insulin group. The other demographic characteristics are similar in both groups in type 1 and type2 subjects.EFFICACY RESULTS• Tre<strong>at</strong>ment with NN304 was non-inferior to tre<strong>at</strong>ment with NPH human insulin as measured by HbA 1C after 48weeks of tre<strong>at</strong>ment in subjects with type 1 diabetes on a basal-bolus regimen in the FAS popul<strong>at</strong>ion.− Means (SE) adjusted for baseline HbA 1C were 7.33% (0.05) and 7.29% (0.07) for NN304 and NPH humaninsulin, respectively.− Mean difference (NN304-NPH human insulin) = 0.03% [95% C.I.: -0.14; 0.21]− Tre<strong>at</strong>ment with NN304 was also non-inferior to tre<strong>at</strong>ment with NPH human insulin in the PPS popul<strong>at</strong>ion. Meandifference (NN304–NPH human insulin) was 0.00% [95% C.I.: -0.18; 0.18]• HbA 1C in subjects with type 2 diabetes was comparable for the two tre<strong>at</strong>ment groups, though the sample size of thissubgroup was not large enough to provide st<strong>at</strong>istical power in any analysis.• The mean FPG derived from 7-day FPG by self-monitoring <strong>at</strong> home was lower after 48 weeks of tre<strong>at</strong>ment withNN304 than with NPH human insulin and the difference was st<strong>at</strong>istically significant (p=0.0263) in subjects withtype 1 diabetes.− Means (SE) adjusted for baseline mean FPG were 146.46 mg/dL (2.70) and 156.99 mg/dL (3.86) for NN304 andNPH human insulin, respectively.− Mean difference (NN304-NPH human insulin) = -10.53 mg/dL [95% C.I.: -19.81; -1.25]• The trend th<strong>at</strong> the mean FPG in the NN304 group was lower than in the NPH human insulin group was also seen insubjects with type 2 diabetes.• Within-subject vari<strong>at</strong>ion (CV%) derived from 7-day FPG by self-monitoring <strong>at</strong> home after 48 weeks of tre<strong>at</strong>mentwas lower in the NN304 group than in NPH human insulin, in both subgroups of type 1 and type 2 diabetes.St<strong>at</strong>istical significance between groups was seen in the analysis of SD in both subjects with type 1 and type 2diabetes (for both subgroups, p
Insulin detemir D<strong>at</strong>e: 07 November 2005Trial ID: NN304-1476 Version: 2Integr<strong>at</strong>ed <strong>Clinical</strong> Trial Report St<strong>at</strong>us: Final<strong>Synopsis</strong> Page: 6 of 8<strong>Novo</strong> <strong>Nordisk</strong>during the night.− Increase in plasma glucose concentr<strong>at</strong>ions in the early morning was smaller in the NN304 group compared to theNPH human insulin group.− No substantial result was obtained from nightly glucose profile in subjects with type 2 diabetes, because of thesmall sample size (21 subjects in the NN304 group and 11 in the NPH human insulin group).SAFETY RESULTS• The incidence of daily hypoglycaemic episodes during the maintenance period was comparable for the twotre<strong>at</strong>ment groups in subjects with type 1 diabetes.− A total of 8262 episodes for 178 (92.7%) subjects with NN304 tre<strong>at</strong>ment (50.85 events / subjects*year) and 4130episodes for 95 (96.9%) subjects with NPH human insulin (51.53 events / subjects*year) were reported.− Rel<strong>at</strong>ive risk of having a daily hypoglycaemic episode (NN304 / NPH human insulin) = 0.96 [95% C.I.: 0.65;1.40].• The incidence of nocturnal hypoglycaemic episodes during the maintenance period with NN304 was st<strong>at</strong>isticallysignificantly lower than with NPH human insulin (p=0.0464) in subjects with type 1 diabetes.− A total of 1171 episodes for 133 (69.3%) subjects with NN304 tre<strong>at</strong>ment (7.21 events / subjects*year) and 868episodes for 78 (79.6%) subjects with NPH human insulin (10.83 events / subjects*year) were reported.− Rel<strong>at</strong>ive risk of having a nocturnal hypoglycaemic episode (NN304 / NPH human insulin) = 0.69 [95% C.I.:0.47; 0.99].• In subjects with type 2 diabetes, the incidence of daily hypoglycaemic episodes and th<strong>at</strong> of nocturnalhypoglycaemic episodes during the maintenance period were comparable for two tre<strong>at</strong>ment groups.− A total of 882 daily hypoglycaemic episodes for 54 (81.8%) subjects with NN304 tre<strong>at</strong>ment (15.57 events /subjects*year) and 435 episodes for 27 (77.1%) subjects with NPH human insulin (15.31 events / subjects*year)were reported.− Rel<strong>at</strong>ive risk of having a daily hypoglycaemic episode (NN304 / NPH human insulin) = 1.02 [95% C.I.: 0.42;2.45].− A total of 99 nocturnal hypoglycaemic episodes for 25 (37.9%) subjects with NN304 tre<strong>at</strong>ment (1.75 events /subjects*year) and 56 episodes for 11 (31.4%) subjects with NPH human insulin (1.97 events / subjects*year)were reported.− Rel<strong>at</strong>ive risk of having a nocturnal hypoglycaemic episode (NN304 / NPH human insulin) = 0.85 [95% C.I.:0.26; 2.82].• Adverse event profile in type 1 diabetes was comparable in both tre<strong>at</strong>ment groups.− The proportion of subjects who experienced TEAEs was similar for two tre<strong>at</strong>ment groups. A total of 715 TEAEswere reported from 173 (88.3%) subjects in the NN304 group and 335 TEAEs were reported from 87 (88.8%)subjects in the NPH human insulin group.− Rel<strong>at</strong>ion to tre<strong>at</strong>ment was considered probable/possible for 20 events in 13 (6.6%) subjects in the NN304 groupand for 6 events in 5 (5.1%) subjects in the NPH human insulin group. These evens were sporadic and therewere no differences in their p<strong>at</strong>tern between the two tre<strong>at</strong>ment groups.− A total of 20 SAEs for 13 (6.6%) subjects in the NN304 group and 13 SAEs for 10 (10.2%) subjects in the NPHhuman insulin group were reported. The rel<strong>at</strong>ion to tre<strong>at</strong>ment was considered probable/possible forhypoglycaemia (2 events for 2 subjects with NN304 tre<strong>at</strong>ment, 1 event for 1 subject with NPH human insulintre<strong>at</strong>ment), hypoglycaemic coma (3 events for 2 subjects with NPH human insulin tre<strong>at</strong>ment), and amnesia anddehydr<strong>at</strong>ion (2 events for 1 subject with NN304 tre<strong>at</strong>ment). Four subjects (3 in the NN304 group and 1 in theNPH human insulin group) withdrew from the trial due to the onset of adverse events.• Adverse event profile in type 2 diabetes was also comparable in both tre<strong>at</strong>ment groups.− The proportion of subjects who experienced TEAEs was similar for the two tre<strong>at</strong>ment groups. A total of 249TEAEs were reported from 61 (91.0%) subjects in the NN304 group and 124 TEAEs were reported from 29(82.9%) subjects in the NPH human insulin group.− Rel<strong>at</strong>ion to tre<strong>at</strong>ment was considered probable/possible for 17 events in 6 (9.0%) subjects in the NN304 groupand for 5 events in 3 (8.6%) subjects in the NPH human insulin group. These evens were sporadic and therewere no differences in their p<strong>at</strong>tern between the two tre<strong>at</strong>ment groups.− A total of 4 SAEs (4 subjects, 6.0%) in the NN304 group and 4 SAEs (4 subjects, 11.4%) in the NPH human
Insulin detemir D<strong>at</strong>e: 07 November 2005Trial ID: NN304-1476 Version: 2Integr<strong>at</strong>ed <strong>Clinical</strong> Trial Report St<strong>at</strong>us: Final<strong>Synopsis</strong> Page: 7 of 8<strong>Novo</strong> <strong>Nordisk</strong>insulin group were reported, but all SAEs were considered to be unlikely rel<strong>at</strong>ed to the tre<strong>at</strong>ment. Only onesubject in the NPH human insulin group withdrew from the trial due to the onset of adverse events.• There were no de<strong>at</strong>hs during the trial.• There were no differences in results for clinical labor<strong>at</strong>ory, blood pressure, ECG andfunduscopy/fundusphotography between the two tre<strong>at</strong>ment groups, in both subjects with type 1 and type 2 diabetes.• Mean body weight adjusted for baseline value was lower after 48 weeks of tre<strong>at</strong>ment with NN304 than with NPHhuman insulin and st<strong>at</strong>istical significant difference was seen in subjects with type 1 diabetes.− Means (SE) adjusted for baseline body weight were 58.99 kg (0.17) and 59.91 kg (0.24) for NN304 and NPHhuman insulin, respectively.− Mean difference (NN304-NPH human insulin) = -0.92 kg [95% C.I.: -1.51; -0.33] (p=0.0024).• The similar trend was also found in subjects with type 2 diabetes.− Means (SE) adjusted for baseline body weight were 63.47 kg (0.28) and 64.29 kg (0.38) for NN304 and NPHhuman insulin, respectively.− Mean difference (NN304-NPH human insulin) = -0.82 kg [95% C.I.: -1.76; 0.11] (p=0.0847).OTHER RESULTS• In subjects with type 1 diabetes, the mean daily basal insulin dose <strong>at</strong> end of trial was st<strong>at</strong>istically significantly lowerwith NN304 than with NPH human insulin, although the dose of NN304 increased toward baseline (pre-trial) levelfrom the starting dose (70% of pre-trial basal insulin dose). The r<strong>at</strong>io (NN304 /NPH human insulin) for mean dailybasal insulin dose <strong>at</strong> end of trial was 0.869. The dose of bolus insulin was slightly increased in the NN304 group;while no increase was seen in the NPH human insulin group. As a result, the r<strong>at</strong>io for total daily insulin dose <strong>at</strong> endof trial was 0.983.In subjects with type 2 diabetes, the mean daily basal insulin dose and the mean daily bolus insulin dose, and, as aresult, total daily insulin dose <strong>at</strong> end of trial were increased from baseline in both tre<strong>at</strong>ment groups. All doses wereslightly higher in the NN304 group than in the NPH human insulin group: the r<strong>at</strong>io (NN304/NPH human insulin)was 1.091 for mean daily basal insulin and 1.059 for total daily insulin <strong>at</strong> end of trial.• Total scores for ITR-QOLN and ITSQ-J after 48 weeks of tre<strong>at</strong>ment with NN304 were higher than with NPHhuman insulin and the difference was st<strong>at</strong>istically significant in subjects with type 1 diabetes. In general, the resultsof ITR-QOLN and ITSQ-J in the NN304 group were more favourable than in the NPH human insulin group. Nodifference between the two groups was seen in the results for subjects with type 2 diabetes, though the sample sizewas small.• Subjects with type 1 diabetes in the NN304 group showed form<strong>at</strong>ion of NN304 specific antibodies <strong>at</strong> 49 weeks(LOCF); the change from baseline was st<strong>at</strong>istically significantly larger than th<strong>at</strong> in the NPH human insulin group.However, no correl<strong>at</strong>ion was found between change in antibodies and HbA 1C . The change in NN304-IAsp crossreactingantibodies was positively correl<strong>at</strong>ed with basal insulin dose and total insulin dose; this is considered to beof little clinical significance.CONCLUSIONSTre<strong>at</strong>ment with NN304 or NPH human insulin in subjects with insulin requiring diabetes (type 1 and type 2) on abasal-bolus regimen yielded the following results after 48 weeks of tre<strong>at</strong>ment:• Tre<strong>at</strong>ment with NN304 was non-inferior to tre<strong>at</strong>ment with NPH human insulin as measured by HbA 1C after 48weeks of tre<strong>at</strong>ment in subjects with type 1 diabetes.• The mean FPG was lower in the NN304 group than in the NPH human insulin group; a st<strong>at</strong>istically significantdifference was seen in subjects with type 1 diabetes. Within-subject vari<strong>at</strong>ion of FPG with NN304 was significantlylower than with NPH human insulin both in subjects with type 1 and type 2 diabetes. The overall shape of nightly9-hour plasma glucose profiles was different between the two tre<strong>at</strong>ment groups; fluctu<strong>at</strong>ion in mean plasma glucoseconcentr<strong>at</strong>ion was smaller and the increase in plasma glucose concentr<strong>at</strong>ions in the early morning was smaller withNN304 than with NPH human insulin.• The incidence of daily hypoglycaemic episodes during the maintenance period was comparable for two tre<strong>at</strong>mentgroups in both subjects with type 1 and type 2 diabetes. The incidence of nocturnal hypoglycaemic episodes duringthe maintenance period in the NN304 group was significantly lower than in the NPH human insulin group insubjects with type 1 diabetes.• There were no differences between the two tre<strong>at</strong>ment groups for adverse events, clinical labor<strong>at</strong>ory, blood pressure,
Insulin detemir D<strong>at</strong>e: 07 November 2005Trial ID: NN304-1476 Version: 2Integr<strong>at</strong>ed <strong>Clinical</strong> Trial Report St<strong>at</strong>us: Final<strong>Synopsis</strong> Page: 8 of 8<strong>Novo</strong> <strong>Nordisk</strong>ECG and funduscopy/fundusphotography.• Mean body weight was lower in the NN304 group than in the NPH human insulin group <strong>at</strong> end of study. Thedifference was st<strong>at</strong>istically significant in subjects with type 1 diabetes.• In subjects with type 1 diabetes, the mean daily basal insulin dose in the NN304 group was significantly lower thanin the NPH human insulin group; the dose r<strong>at</strong>io (NN304/NPH human insulin) of basal insulin was 0.869. Insubjects with type 2 diabetes, the doses of basal insulin and bolus insulin were slightly higher in the NN304 groupthan in the NPH human insulin group; the dose r<strong>at</strong>io of basal insulin was 1.091.• The results of ITR-QOLN and ITSQ-J questionnaires in the NN304 group were more favourable than in the NPHhuman insulin group in subjects with type 1 diabetes.• Subjects with type 1 diabetes in the NN304 group showed form<strong>at</strong>ion of NN304 specific antibodies <strong>at</strong> end of trial;the change from baseline was st<strong>at</strong>istically significantly larger than in the NPH human insulin group. However, nocorrel<strong>at</strong>ion was found between change in antibodies and HbA 1C . The change in NN304-IAsp cross-reactingantibodies was positively correl<strong>at</strong>ed with basal insulin dose and total insulin dose; this is considered to be of littleclinical significance.The trial was conducted in accordance with the Declar<strong>at</strong>ion of Helsinki and Good <strong>Clinical</strong> Practice.


