Does Court Efficiency have a Deterrent Effect on Crime - inesad
Does Court Efficiency have a Deterrent Effect on Crime - inesad
Does Court Efficiency have a Deterrent Effect on Crime - inesad
You also want an ePaper? Increase the reach of your titles
YUMPU automatically turns print PDFs into web optimized ePapers that Google loves.
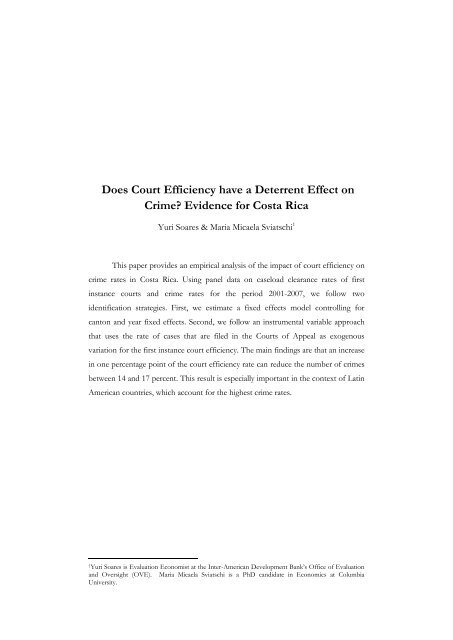
<str<strong>on</strong>g>Does</str<strong>on</strong>g> <str<strong>on</strong>g>Court</str<strong>on</strong>g> <str<strong>on</strong>g>Efficiency</str<strong>on</strong>g> <str<strong>on</strong>g>have</str<strong>on</strong>g> a <str<strong>on</strong>g>Deterrent</str<strong>on</strong>g> <str<strong>on</strong>g>Effect</str<strong>on</strong>g> <strong>on</strong><strong>Crime</strong>? Evidence for Costa RicaYuri Soares & Maria Micaela Sviatschi 1This paper provides an empirical analysis of the impact of court efficiency <strong>on</strong>crime rates in Costa Rica. Using panel data <strong>on</strong> caseload clearance rates of firstinstance courts and crime rates for the period 2001-2007, we follow twoidentificati<strong>on</strong> strategies. First, we estimate a fixed effects model c<strong>on</strong>trolling forcant<strong>on</strong> and year fixed effects. Sec<strong>on</strong>d, we follow an instrumental variable approachthat uses the rate of cases that are filed in the <str<strong>on</strong>g>Court</str<strong>on</strong>g>s of Appeal as exogenousvariati<strong>on</strong> for the first instance court efficiency. The main findings are that an increasein <strong>on</strong>e percentage point of the court efficiency rate can reduce the number of crimesbetween 14 and 17 percent. This result is especially important in the c<strong>on</strong>text of LatinAmerican countries, which account for the highest crime rates.1Yuri Soares is Evaluati<strong>on</strong> Ec<strong>on</strong>omist at the Inter-American Development Bank’s Office of Evaluati<strong>on</strong>and Oversight (OVE). Maria Micaela Sviatschi is a PhD candidate in Ec<strong>on</strong>omics at ColumbiaUniversity.
efficient judicial instituti<strong>on</strong>s able to investigate and solve penal processes in due time. In this sense,several efforts <str<strong>on</strong>g>have</str<strong>on</strong>g> been made by the government to improve the efficiency of courts in the lastdecade. One important reform was the Program for the Modernizati<strong>on</strong> of the Administrati<strong>on</strong> ofJustice in 1996. The objective of this program was to improve the management of judicial officesand public services by building a modern system of administrati<strong>on</strong> that included the developmentof a computerized legal-data system. According to Soares et al. (2009), the reform was associatedwith an increase of 6 percent in clearance rates and with a reducti<strong>on</strong> of 75 dollars per case disposed.This paper makes two important c<strong>on</strong>tributi<strong>on</strong>s. First, while there is an extensive theoreticalliterature that studies the causes and c<strong>on</strong>sequences of court inefficiencies, there is little empiricalevidence that analyze the relati<strong>on</strong>ship between court delays and crime rates. The <strong>on</strong>ly empiricalstudy found was that of Dalla Pellegrina (2006) that studies the impact of the length of trials <strong>on</strong>crime rates in Italy. Using an instrumental variables approach, the author finds that l<strong>on</strong>ger trials canreduce the deterrence effect of justice since criminals discount their punishment when there are trialdelays. The paper suggests that a <strong>on</strong>e-year delay can increase the number of thefts and robberies inabout 18 and 23 percent respectively. Sec<strong>on</strong>d, to the best of our knowledge there are no studies forLatin American countries, the regi<strong>on</strong> with the highest crime rates (see Table 1). According to Soareset al. (2007) mortality rates due to violence in Latin America are approximately 200 percent higherthan in North America and Western Pacific, and 450 percent higher than Western Europe. Inadditi<strong>on</strong>, surveys d<strong>on</strong>e by Latinobarometro in 2008 <str<strong>on</strong>g>have</str<strong>on</strong>g> shown that crime was c<strong>on</strong>sidered theworst problem in the regi<strong>on</strong>, leaving behind unemployment and other ec<strong>on</strong>omic problems.The rest of the paper proceeds as follows: Secti<strong>on</strong> II describes Costa Rica Judicial Systemand reforms, Secti<strong>on</strong> III presents the literature review, Secti<strong>on</strong> IV describes the data, Secti<strong>on</strong> Vpresents the estimati<strong>on</strong> strategy, Secti<strong>on</strong> VI the results and Secti<strong>on</strong> VII some robustness checks.Finally, Secti<strong>on</strong> VII c<strong>on</strong>cludes.II. Costa Rica Judicial SystemThe justice sector in Costa Rica is made up the Judiciary, the Ministry of Justice, TheOffice of the Attorney General of the Republic and the Community Defense Office. The Judiciaryis composed of justices of peace, ordinary and appellate courts, and various chambers of theSupreme <str<strong>on</strong>g>Court</str<strong>on</strong>g> of Justice. The Supreme <str<strong>on</strong>g>Court</str<strong>on</strong>g> is the highest judicial body in Costa Rica, composedof 22 judges that are chosen by the Legislative assembly for an eight-year term. The appellate courts(tribunals) are divided in eight judicial districts: San José, Alajuela, Cartago, Heredia, Guanacaste,Puntarenas, Z<strong>on</strong>a Sur and Z<strong>on</strong>a Atlantica. The <str<strong>on</strong>g>Court</str<strong>on</strong>g>s of first judgment (juzgados) are the lower courtsand are distributed over the 81 cant<strong>on</strong>s. The Justices of Peace are local courts that handle minorcases (c<strong>on</strong>travenci<strong>on</strong>ales y de menor cuantia) and are territorially spread over the districts in which vthecant<strong>on</strong>s are divided.The case of Costa Rica is especially important since, c<strong>on</strong>trary to most Latin Americancountries, it has maintained a democratic traditi<strong>on</strong> and a broad sense of social justice, providing its
inhabitants with a reliable and credible judicial system. According to Kauffman’s governanceindicators, Costa Rica is am<strong>on</strong>g the highest ranked Latin American countries in the Rule of LawIndex. 4 In additi<strong>on</strong>, the Judiciary is composed of 17 judges per 100,000 inhabitants, placing thecountry am<strong>on</strong>g the highest in the regi<strong>on</strong> for this indicator.Despite the fact that Costa Rica has good governance indicators in comparis<strong>on</strong> with otherLatin American countries, its judicial system has a high incidence of backlogs and c<strong>on</strong>gesti<strong>on</strong> incourts that impede effective access to justice. At the beginning of the 1990’s, an ordinarycommercial or civil case could take up to seven years, and a simple executive judgment aroundthree years. 5 The potential causes of this inefficiency were attributed to the centralizati<strong>on</strong> of theadministrative operati<strong>on</strong>s in San Jose, the lack of technology for administering resources, theformalism of judicial procedures, the inefficiency of the judicial offices and the lack of knowledge<strong>on</strong> behalf of the judges.As c<strong>on</strong>sequence, Costa Rica embarked <strong>on</strong> a judicial reform process that had broad supportfrom different political actors such as the state powers, the private sector and civil society. Theobjective of this reform was to enhance access to justice and its efficiency, and mostly c<strong>on</strong>sisted ofthe following elements: the introducti<strong>on</strong> of oral processes in criminal cases, the implementati<strong>on</strong> ofnew criminal procedure, the adopti<strong>on</strong> of alternative dispute resoluti<strong>on</strong> mechanisms, theestablishment of unique case numbers across different actors in the criminal system, theimplementati<strong>on</strong> of informati<strong>on</strong> technology and administrative changes in the management ofcourts, including the creati<strong>on</strong> of “mega-offices” which centralized many back office andadministrative functi<strong>on</strong>s.In 1973, the country adopted hybrid (oral and written) procedures in criminal cases. Thenew system divided the process into two stages: the instructi<strong>on</strong> and the oral and public trial. Thischange in the judicial process from written to oral procedure promoted judicial transparency andefficiency. In 1998, a new Criminal Procedure Code was also implemented that restructured theadministrati<strong>on</strong> of the Judiciary and the Public Ministry, transferring the functi<strong>on</strong>s of investigati<strong>on</strong>and prosecuti<strong>on</strong> of crimes to the latter.Another central comp<strong>on</strong>ent of reform was the implementati<strong>on</strong> of the Law for AlternativeC<strong>on</strong>flict Resoluti<strong>on</strong> Mechanisms, which included arbitrati<strong>on</strong> and c<strong>on</strong>ciliati<strong>on</strong> as alternative ways forsolving c<strong>on</strong>flicts. This law was especially important in the case of Costa Rica, where citizenstraditi<strong>on</strong>ally resort to courts in order to solve many c<strong>on</strong>flicts that do not need to be assessed byjudges, causing a high rate of litigiousness, c<strong>on</strong>gesti<strong>on</strong> and a negative public percepti<strong>on</strong> about theadministrati<strong>on</strong> of justice.4 The same results are found with the indexes: Voice and Accountability, Political and Stability, andGovernment <str<strong>on</strong>g>Effect</str<strong>on</strong>g>iveness.5 Inter American Development Bank (1994). “Proposal for a loan for the modernizati<strong>on</strong> of theadministrati<strong>on</strong> of justice ”
In 1998, the Supreme <str<strong>on</strong>g>Court</str<strong>on</strong>g> approved the creati<strong>on</strong> of “mega-offices” that c<strong>on</strong>sisted of theclustering of services for courts of the same instance into a single office. The mega-officesintroduced many technological improvements, such as computers, Internet access, Intranet andcentralized notificati<strong>on</strong> services. There was also a specializati<strong>on</strong> of functi<strong>on</strong>s achieved by separatingthe offices of family, child support and domestic violence. Another significant change was thecreati<strong>on</strong> of a unique number identifying each civil and criminal case (Número Unico de Expediente);this same identifier is used across the different actors in the legal system, allowing the m<strong>on</strong>itoring ofcourt processes.III. Literature ReviewBased <strong>on</strong> orthodox theories of crime used in ec<strong>on</strong>omics (Beccaria, 1962; Bentham; 1963;Becker, 1968; Gibbs, 1968), we suppose that criminals are rati<strong>on</strong>al individuals that will decide tocommit a crime whenever the benefits associated with the crime are higher than the costs. In thispaper, we will focus <strong>on</strong> the role of costs C , .i tFirst, following this theory, we suppose that costs are an increasing functi<strong>on</strong> of theprobabilities of c<strong>on</strong>victi<strong>on</strong> ( Cn , ), detenti<strong>on</strong> ( D , ) and punishment ( P , ). 6i ti ti tC F Cn , D , P ) (1)i, t ( i,t i,t i,tSec<strong>on</strong>d, we suppose that court efficiency can affectCn i , t andD i , t since it might increase thecertainty and reliability of the legal system. This assumpti<strong>on</strong> is c<strong>on</strong>sistent with the previoustheoretical literature. For example, using an expected utility model, Torre (2003) has analyzed howtrial delays can affect the decisi<strong>on</strong>s of the defendant and prosecutor and found that these delaysmight reduce the probability of c<strong>on</strong>victi<strong>on</strong>. In the same vein, Vereeck et al (2000) <str<strong>on</strong>g>have</str<strong>on</strong>g> argued thatcase backlogs can reduce the criminal likelihood of losing a trial since the quality of evidencedeteriorates with the passing of time. Thus, they argue that court delays might undermine legalcertainty.Another relevant factor that might be affected by the efficiency of courts is P , . If criminalsdiscount the future, court delays might also reduce the value of punishments, undermining thecrime deterrent effect. Listokin (2003) has suggested that the existence of efficient courts mightincrease the present value of punishments since they are able to reduce the lag between when thecrime is committed and when the punishment is imposed. In this sense, a punishment imposedtoday has a larger deterrent and retributive effect than the same punishment imposed in the future.For example, in m<strong>on</strong>etary terms the same fine today does not <str<strong>on</strong>g>have</str<strong>on</strong>g> the same value that the samei t6 According to the ecological models there are other factors that might influence the probability ofcommitting a crime such as educati<strong>on</strong>, genetics, envir<strong>on</strong>ment and social variables (poverty, inequality, lowgovernment etc.)
fine in the future. In additi<strong>on</strong>, the author has also argued that the efficiency of courts not <strong>on</strong>lyincreases the value of punishments but also the respect and reliability of the justice system.Similarly, Darley et al. (2003) <str<strong>on</strong>g>have</str<strong>on</strong>g> pointed out that the delay between crime and punishment canundermine the deterrent effect.In summary, all of the most important factors that affect the costs associated withcommitting a crime are positively related to the efficiency levels of the courts.Cn D , P H(<str<strong>on</strong>g>Court</str<strong>on</strong>g><str<strong>on</strong>g>Efficiency</str<strong>on</strong>g>) (2)i, t , i,t i,ti,tTherefore, crime rates are an increasing functi<strong>on</strong> of the efficiency levels of courts:Cr F H(<str<strong>on</strong>g>Court</str<strong>on</strong>g><str<strong>on</strong>g>Efficiency</str<strong>on</strong>g>)) (3)i, t ( i,tWe could also argue that the decisi<strong>on</strong> to commit an illegal behavior is a functi<strong>on</strong> not of theactual court efficiency rates but of the history of them. That is, criminals internalize in their costfuncti<strong>on</strong> past court behaviors since they <str<strong>on</strong>g>have</str<strong>on</strong>g> more informati<strong>on</strong> about past efficiency levels than ofthe actual <strong>on</strong>es. Indeed, since an improvement <strong>on</strong> the actual efficiency levels can be a permanent ortransitory shock, the criminal might not be able to distinguish between both types and thus hemight prefer to c<strong>on</strong>sider past informati<strong>on</strong> about efficiency levels. Formally,Cr F H(<str<strong>on</strong>g>Court</str<strong>on</strong>g><str<strong>on</strong>g>Efficiency</str<strong>on</strong>g>)) (4)i, t ( i,t1Notice that we are also assuming that criminals <str<strong>on</strong>g>have</str<strong>on</strong>g> some degree of knowledge regardingthe probabilities of being caught, being prosecuted and c<strong>on</strong>victed and serving time, as well asknowledge regarding the durati<strong>on</strong> of criminal cases. This assumpti<strong>on</strong> might not be unrealistic sincecriminals are pr<strong>on</strong>e to live am<strong>on</strong>g other criminals and thus might <str<strong>on</strong>g>have</str<strong>on</strong>g> more informati<strong>on</strong> about theperformance of the Judicial System (Krohn, 1986; Dalla Pellegrina, 2006). Cook (1979) has analyzedthree important channels by which potential criminals can get informati<strong>on</strong> about the certainty andseverity of punishment: the media, the visible presence of enforcers, and by pers<strong>on</strong>al experienceand observati<strong>on</strong>. He has noticed that since offenders accumulate pers<strong>on</strong>al experience during theircriminal lives, they <str<strong>on</strong>g>have</str<strong>on</strong>g> a better percepti<strong>on</strong> about the effectiveness of the system. Furthermore, hehas pointed out that there are peer effects am<strong>on</strong>g criminals, since they also obtain informati<strong>on</strong>about the probability of detenti<strong>on</strong> from their criminal friends.In this paper, we will provide an empirical assessment of functi<strong>on</strong> (4). While there are manytheoretical models, there is little empirical evidence that studies the impact of court delays <strong>on</strong>crime-related outcomes (except for Dalla Pellegrina, 2006).
Most of these studies <str<strong>on</strong>g>have</str<strong>on</strong>g> found that an increase in the certainty and severity ofpunishments can decrease illegal behavior (Gibbs, 1968; Waldo et al, 1972; Pogarsky, 2002). Soareset al (2009) <str<strong>on</strong>g>have</str<strong>on</strong>g> also suggested that the presence of judicial instituti<strong>on</strong>s in rural areas of Peru may<str<strong>on</strong>g>have</str<strong>on</strong>g> reduced the incentives to generate c<strong>on</strong>flict, such as those related to land expropriati<strong>on</strong>s anddebt collecti<strong>on</strong>, by increasing the probability of being punished. In the same line, many studies <str<strong>on</strong>g>have</str<strong>on</strong>g>analyzed how police presence can reduce crime rates. While early studies found a positivecorrelati<strong>on</strong> between both variables (Camer<strong>on</strong>, 1988), they did not take into account the reversecausality problem that arises when police and crime rates are simultaneously defined. In order toaddress this potential endogeneity problem, Di Tella et al. (2004) take advantage of a naturalexperiment in Buenos Aires. They use as an exogenous allocati<strong>on</strong> of police—the fact that all Jewishinstituti<strong>on</strong>s were given police protecti<strong>on</strong> after a terrorist attack—and find that police presence can<str<strong>on</strong>g>have</str<strong>on</strong>g> a large deterrent effect <strong>on</strong> crime. They show that city blocks that <str<strong>on</strong>g>have</str<strong>on</strong>g> police protecti<strong>on</strong>experienced 0.081 fewer car thefts than those that do not <str<strong>on</strong>g>have</str<strong>on</strong>g>.While there is a widespread belief that the severity and certainty of punishment areimportant to deter criminal acts, there is disagreement in the empirical literature regarding themagnitudes of both variables. Many authors <str<strong>on</strong>g>have</str<strong>on</strong>g> pointed out that certainty of punishment is moreeffective in deterring crime than the severity of punishment (Witte, 1983; Title, 1969; Jensen; 1969).IV. DataThe data is comprised of three different sets: judicial office-level data <strong>on</strong> clearance caseloadrates, police-level data <strong>on</strong> crime rates and household level data for c<strong>on</strong>trol variables. We aggregatethe data at the cant<strong>on</strong> level covering the provinces of San Jose, Alajuela, Cartago and Herediaduring the period 2001-07.The judicial office-level data comes from the Planning Department of the Judiciary Power(Departamento de Planificaci<strong>on</strong> del Poder Judicial) and c<strong>on</strong>tains data <strong>on</strong> the number of disposed, filed andpending cases, number of sentences, expenditures of courts, and number of judges in every cant<strong>on</strong>for the period 2001-07. This data is used to c<strong>on</strong>struct our court efficiency indicator: the caseloadclearance rate. We define the caseload clearance rate as the ratio between the number of disposedcases and the sum of new cases filed, re-filed cases and pending cases from the past year.The police level data also comes from the Planning Department of the Judiciary(Departamento de Planificaci<strong>on</strong> del Poder Judicial) and c<strong>on</strong>tains informati<strong>on</strong> <strong>on</strong> the number of filed crimecases and the number of police officers at the cant<strong>on</strong> level for the provinces of San Jose, Alajuela,Cartago and Heredia during the period 2001-07. We distinguish between nine groups: crimesagainst life, property, family, freedom and public duties, public administrati<strong>on</strong>, public faith, sexoffenses, violati<strong>on</strong> of the Psychotropic Substances Act and regulatory violati<strong>on</strong>.Household level data was obtained from Costa Rica Household Surveys for the period2001-06 and c<strong>on</strong>tains data <strong>on</strong> populati<strong>on</strong>, unemployment rates and poverty levels.
Table 2 presents summary statistics for the judicial indicators. We <str<strong>on</strong>g>have</str<strong>on</strong>g> a total of 280observati<strong>on</strong>s and find variability across cant<strong>on</strong>s and time for these outcomes.Table 3 presents summary statistics <strong>on</strong> the different types of crime. There are a total of 280observati<strong>on</strong>s covering 40 cant<strong>on</strong>s and variability across cant<strong>on</strong>s and time. According to the crimeshares in Costa Rica for the period 2001-2007, 77 percent of crimes were against property. Theseinclude thefts, swindles, robberies, frauds, usurpati<strong>on</strong>s and other crimes against property.Table 4 presents the evoluti<strong>on</strong> of crime rates per 100,000 inhabitants. Between the years2001 and 2007, there was an increase in the number of total crimes. Most of this increase is due tocrimes against property (6 percent) and crimes against family (15 percent).Table 5 presents the crime rates by court efficiency quantiles. Results suggest that thosecant<strong>on</strong>s that are at the higher distributi<strong>on</strong> of efficiency present lower crime rates. If we compare thecrime rates between those cant<strong>on</strong>s that are in the lowest quantile to those that in the first, we find adifference of about 42 percent in the crime rates for cant<strong>on</strong>s that <str<strong>on</strong>g>have</str<strong>on</strong>g> the more efficient courts.Nevertheless, it is important to notice that the bivariate relati<strong>on</strong>ship seen in Table 5 does not takeinto account the possible issues with endogeneity of court efficiency. These issues are detailed andaddressed in the next secti<strong>on</strong>.V. Identificati<strong>on</strong> StrategyA. Fixed <str<strong>on</strong>g>Effect</str<strong>on</strong>g>s ModelThe purpose of this study is to estimate the causal effect of court efficiency <strong>on</strong> crime ratesat the cant<strong>on</strong> level. Since this is not an experimental design, we <str<strong>on</strong>g>have</str<strong>on</strong>g> to address several endogeneityproblems. First, we could <str<strong>on</strong>g>have</str<strong>on</strong>g> a reverse causality problem if court inefficiency is the result of alarge number of criminal cases taken to them. Sec<strong>on</strong>d, different particular characteristics in thecant<strong>on</strong>s may <str<strong>on</strong>g>have</str<strong>on</strong>g> affected the crime rates and the productivity of courts. It could be the case thatsome cant<strong>on</strong>s, for example those with more corrupt judges <str<strong>on</strong>g>have</str<strong>on</strong>g> higher crime rates and also moreinefficient courts. 7 In this sense, correlati<strong>on</strong> between court efficiency and certain factors such ascorrupti<strong>on</strong> that influence the crime rates can lead to biased estimates. The same could also happenwith the number of judges per cant<strong>on</strong> since this variable might affect both crime and caseloadclearance rates.In order to c<strong>on</strong>trol for these potential biases that might c<strong>on</strong>found our identificati<strong>on</strong>, we usepanel data and estimate a fixed effects model. This specificati<strong>on</strong> eliminates potential biases thatcould come from those observable and n<strong>on</strong>-observable characteristics that vary between cant<strong>on</strong>sbut are fixed over time, such as number of courts and police stati<strong>on</strong>s, sentencing procedures,geographical characteristics, etc. The model includes year-fixed effects that c<strong>on</strong>trol for potential7 Buscaglia et al (1999) <str<strong>on</strong>g>have</str<strong>on</strong>g> suggested that court delays might allow court pers<strong>on</strong>nel to ask for bribes in order toexpedite the procedure.
comm<strong>on</strong> shocks in a given year and cant<strong>on</strong>-fixed effects that c<strong>on</strong>trol for all differences betweencant<strong>on</strong>s that are time invariant. Formally we estimate the following equati<strong>on</strong>:<strong>Crime</strong> Ratei, t Clearance Ratei,t-1 X i,t Province j * ti ti,t (1)where<strong>Crime</strong> Rate i, t is the crime rate for cant<strong>on</strong> i and year t; Clearance Rate i,t- 1 is the caseloadclearance rate for court i and year t ;X i , t includes those variables that vary across cant<strong>on</strong>s and time;is the time effect comm<strong>on</strong> to all the cant<strong>on</strong>s; i is a cant<strong>on</strong> fixed effect; Province j *tis aninteracti<strong>on</strong> of the province fixed effect andunobserved variati<strong>on</strong> within province over time.Thetthe time fixed effect that c<strong>on</strong>trols for anyX i , t vector includes variables like number of judges, police officers and other courtofficers, expenditures per court, poverty levels, unemployment rates and the number of sentences.We do not include a proxy for corrupti<strong>on</strong> since we can argue that although the corrupti<strong>on</strong> ratesmight differ between cant<strong>on</strong>s, they might also be fixed in time as many instituti<strong>on</strong> related variables.The number of police officers, judges and court officers gives an idea of the expectedprobability of detenti<strong>on</strong> of criminals (Camer<strong>on</strong>, 1998; Levitt, 1995; Di Tella et al. 2004). One couldargue that it is not the effect of efficiency which reduces crime but the effect of enforcers such aspolice officers and judges. These variables can be positively correlated with the efficiency of courtsand negatively correlated with the crime rates.Poverty levels and the unemployment rates are used as proxies for macroec<strong>on</strong>omicc<strong>on</strong>diti<strong>on</strong>s. First, cant<strong>on</strong>s with lower poverty levels may tend to <str<strong>on</strong>g>have</str<strong>on</strong>g> better instituti<strong>on</strong>s and hencemore effective courts. In additi<strong>on</strong>, they may also tend to <str<strong>on</strong>g>have</str<strong>on</strong>g> lower crime rates. Ludwig et al (2001)<str<strong>on</strong>g>have</str<strong>on</strong>g> suggested that teenagers living in neighborhoods with lower poverty levels are less pr<strong>on</strong>e tocommit crimes. In the same line, Land et al. (1990) and Kelly (2000) <str<strong>on</strong>g>have</str<strong>on</strong>g> found that incomeinequality has an important effect <strong>on</strong> violent crime. Sec<strong>on</strong>d, several studies <str<strong>on</strong>g>have</str<strong>on</strong>g> also shown thathigher unemployment rates are positively correlated with higher crime rates (Freeman, 1999;Raphael et al, 2001). It is important to note that by including this variable we are also indirectlyc<strong>on</strong>trolling for educati<strong>on</strong>al attainment since it is correlated with unemployment.Finally, we also include the expenditures per court since we could argue that the mostefficient cant<strong>on</strong>s are the <strong>on</strong>es that spend more resources in courts. Many studies, such as C<strong>on</strong>tini etal. (2007) <str<strong>on</strong>g>have</str<strong>on</strong>g> suggested that <strong>on</strong>e of the most comm<strong>on</strong> factors attributed to the excessive durati<strong>on</strong>of trials or inefficiencies is the lack of resources.The erroris a cant<strong>on</strong> time-varying error that is generally assumed to be independentacross time and space; however, as the analysis uses panel data, the errors could be correlatedacross time in the same cant<strong>on</strong>. In the case of a positive correlati<strong>on</strong>, the standard errors could becomputed smaller and the null hypothesis could be over rejected. To avoid potential biases in their
estimati<strong>on</strong>, standard errors are clustered at the cant<strong>on</strong> level, allowing an arbitrary covariancestructure within cant<strong>on</strong>s over time. 8 This is necessary since we do not observe variability in courtefficiency within each cant<strong>on</strong>.B. Instrumental VariablesDespite the fact that in the fixed effects model we address many of the potential biasesc<strong>on</strong>trolling for many factors that are fixed in time and vary between cant<strong>on</strong>s, there are manyunobservable factors such as the ability of judges that might vary across cant<strong>on</strong>s and across timethat can still affect our estimati<strong>on</strong>. To address this issue, we use an instrumental variable approachin order to capture exogenous variability in the court efficiency variable. According to the theory, aproper instrument should satisfy two important assumpti<strong>on</strong>s. First, it should not be correlated withthe error term and sec<strong>on</strong>d, it should be significantly correlated with the efficiency of courts.Following Dalla Pellegrina (2007), we instrument the caseload clearance rates with the rateof cases filed in the courts of appeal. We define the probability to appeal a case as the ratio betweenthe number of cases filed in the courts of appeal and the number of cases filed in first instancescourts. According to nati<strong>on</strong>al data in 2008 from 1390 crime cases per 100,000 inhabitants,approximately 50 percent are taken into first instances courts, from which 9 percent are taken tocourts of appeal. 9The mechanisms of transmissi<strong>on</strong> between caseload clearance rates and cases taken to theappeal courts are the following. First, if courts <str<strong>on</strong>g>have</str<strong>on</strong>g> a low clearance rate, the durati<strong>on</strong> of cases islikely higher, since they <strong>on</strong>ly finish a small proporti<strong>on</strong> of filed cases. As a c<strong>on</strong>sequence of this delay,the quality of evidence may deteriorate (Vereeck et al (2000) and Chappe (2008)) and thereforeoutcomes may not fulfill plaintiffs’ expectati<strong>on</strong>s. This in turn will lead to a higher probability ofappeal. Sec<strong>on</strong>d, court inefficiency could signal uncertainty about probability of specific outcomes inthe case. This increase in uncertainty in turn may lead parties who are losing a case to believe thatthey would be more successful in an appeal. In this sense, the rate of cases filed in the <str<strong>on</strong>g>Court</str<strong>on</strong>g>s ofAppeal is correlated with crime rates <strong>on</strong>ly through its relati<strong>on</strong>ship with the efficiency of firstinstances courts.On the other hand, the appeals rate might not affect the decisi<strong>on</strong> to commit a crime sinceunder sec<strong>on</strong>d instances defendants are already suffering the legal c<strong>on</strong>sequences for their crime. Inthis sense, the proporti<strong>on</strong> of cases that are taken to the courts of appeal does not affect theprobability of c<strong>on</strong>victi<strong>on</strong>, detenti<strong>on</strong> and punishments through other means that are not theefficiency rates of first instances courts.8 See Bertrand et al. (2004).9 In order to calculate these statistics, we compare the number of filed cases in courts to the number of crime casesreported to the police since we do not <str<strong>on</strong>g>have</str<strong>on</strong>g> a follow up <strong>on</strong> the crime cases that are taken to courts, nor the <strong>on</strong>es that areprosecuted.
VI. ResultsColumn A in Table 6.1 presents the results for the basic model including <strong>on</strong>ly the clearancecaseload rates, the fixed effects for each cant<strong>on</strong>, and the year dummies. Cant<strong>on</strong>s with higher levelsof court productivity experience a reducti<strong>on</strong> in crime rates. However, this reducti<strong>on</strong> is notstatistically significant. One c<strong>on</strong>cern regarding the fixed effects model is that some characteristicsthat vary across time and across cant<strong>on</strong>s can be correlated with crime rates and court efficiencylevels. To address this issue, column B includes a set of socioec<strong>on</strong>omic characteristics such as theunemployment rate, poverty variables, and province time trends. Once we include these c<strong>on</strong>trols,the estimated impact is increased and statistically significant. We find that an increase in <strong>on</strong>epercentage point of the caseload clearance rate is associated with a reducti<strong>on</strong> of about 14 percent incrime rates. Note that the populati<strong>on</strong> is not included as a c<strong>on</strong>trol variable since all the variables arecalculated <strong>on</strong> a per capita basis.Table 6.2 presents the results of the instrumental variable approach. The first observati<strong>on</strong>is that that the parameter estimates for caseload clearance rates are remarkably stable, both acrossFE and IV specificati<strong>on</strong>s, and, more importantly, between specificati<strong>on</strong>s. Estimates for the modelwith police c<strong>on</strong>trols—which is our preferred specificati<strong>on</strong>—show a reducti<strong>on</strong> in crime <strong>on</strong> the orderof 1.3 percent for each 10 percentage point increase in the caseload clearance rate in the case of theIV specificati<strong>on</strong>. This reducti<strong>on</strong> is also of 1.3 percent in the case of the FE specificati<strong>on</strong>. Also notethat the introducti<strong>on</strong> of the number of police slightly reduces the clearance parameter. This is to beexpected, since characteristics of the police can arguably <str<strong>on</strong>g>have</str<strong>on</strong>g> a larger impact <strong>on</strong> deterrence thanthe efficiency of courts. Overall, these results suggest that court efficiency can be an important toolto decrease the crime rates.The results from the first stage of the instrumental variable model provide evidence thatthe efficiency of courts is significantly correlated (at <strong>on</strong>e percent level) with the proporti<strong>on</strong> of casesthat are taken to the Appeal <str<strong>on</strong>g>Court</str<strong>on</strong>g>s. Indeed the sign of the correlati<strong>on</strong> is c<strong>on</strong>sistent with the modelpresented in the previous secti<strong>on</strong>. An increase in the number of filed cases in the Appeal <str<strong>on</strong>g>Court</str<strong>on</strong>g>s isassociated with the inefficiency of first instance courts.As a robustness check, we also follow the same identificati<strong>on</strong> strategy presented in secti<strong>on</strong>V but instead of using the past clearance rates, we use the actual caseload clearance rate. We find nosignificant change in the estimated effect suggesting that our previous estimates are correct. Indeed,we also estimate the fixed effect model including both the actual clearance rates and the <strong>on</strong>es of theyear before. While we find that past clearance rates <str<strong>on</strong>g>have</str<strong>on</strong>g> a negative impact of 12 percent <strong>on</strong> crimerates, we find no impact of the actual clearance rates. This might support our argument thatcriminals <str<strong>on</strong>g>have</str<strong>on</strong>g> better informati<strong>on</strong> about past rates than of the actual <strong>on</strong>es. 1010 Results are available up<strong>on</strong> request.
VII. Heterogeneous <strong>Crime</strong>sAccording to the transmissi<strong>on</strong> mechanism of court efficiency <strong>on</strong> crime rates, criminalsinternalize the higher costs associated with the efficiency of courts and thus following the theory ofrati<strong>on</strong>al choice they decide to commit a crime when the benefits associated with it are higher thanthe cost. Nevertheless, it is important to menti<strong>on</strong> that this argument might differ by type of crime.For some crimes, criminals might not act as rati<strong>on</strong>al decisi<strong>on</strong>-makers that decide to engage in illegalactivity according to the expected utility associated with it. For example, in the case of homicidesand sexual offenses it is difficult to argue that individuals might internalize this increase in theprobability of being punished when they decide to commit a crime. Several studies <str<strong>on</strong>g>have</str<strong>on</strong>g> suggestedthat while property crimes might be lead by rati<strong>on</strong>al factors such as the desire for m<strong>on</strong>etary gainsand might be planned in advance, homicides and sexual offenses might be the result of emoti<strong>on</strong>alfactors or special circumstances that affect the criminal (Borkowitz, 1993, Buvinic et al. 1999;C<strong>on</strong>roy, 2010).To address this issue, the fixed effects model presented in equati<strong>on</strong> (1) is estimated forhomicides and sexual offenses. In additi<strong>on</strong> to check robustness of the results, the instrumentalvariable approach is also followed. If the estimati<strong>on</strong> presented in the previous secti<strong>on</strong> is correct, theefficiency of courts should not operate affecting crimes such as homicides and sexual offenses. 11Results from Table 7 suggest that efficient courts are not able to deter certain types of crimes thatmight be also the product of irrati<strong>on</strong>al factors. This suggests that any other plausible explanati<strong>on</strong>for our main results can be eliminated and strengthens the causal interpretati<strong>on</strong>.IX. C<strong>on</strong>clusi<strong>on</strong>sThis paper suggests that increasing the efficiency of courts can be an important tool todecrease crime rates, supporting the theoretical literature. Since potential criminals are aware of theefficiency level of courts and the higher costs associated with them, they may decide not to performillegal activities. The logic behind this mechanism is that when punishments are certain to happenand are imposed so<strong>on</strong> after the criminal act, individuals are more likely to be deterred fromcommitting crimes. Using a combinati<strong>on</strong> of methods, we found that cant<strong>on</strong>s with more efficientcourts experienced, <strong>on</strong> average, a reducti<strong>on</strong> of between 14 and 19 percent in crime rates. Thisresult is c<strong>on</strong>sistent with the existent theoretical and empirical literature.This result is especially important in the c<strong>on</strong>text of Latin American countries, where crimeis <strong>on</strong>e of the most important public policy problems. In particular, this result is relevant in the caseof Costa Rica, where crime rates <str<strong>on</strong>g>have</str<strong>on</strong>g> been increasing in the last several years (7.3 percent).11 Previous results do not change if we exclude from the sample this type of cases. This could be due to the fact that mostof the frequent crimes are against property where the deterrent logic makes sense.
Many factors suggest that the relati<strong>on</strong> between the efficiency of courts and crime ratesmight be causal. First, the model includes cant<strong>on</strong>, province and time fixed effects and thec<strong>on</strong>clusi<strong>on</strong>s are robust to the inclusi<strong>on</strong> of variables that may affect the probability of committing acrime and may also influence the efficiency of courts. Results are robust to c<strong>on</strong>trolling fordifferences in the province time trends. Sec<strong>on</strong>d, results do not change substantially when weemploy the instrumental variables approach. Third, we find no significant change in the estimatedeffect when we include the caseload clearance rates of the previous year instead of the current rates.Fourth, we dem<strong>on</strong>strate that the efficiency of courts has not affected those crimes that might bethe result of irrati<strong>on</strong>al factors.These results shed light <strong>on</strong> a number of important policy debates regarding the effectivetools to reduce crime rates. This paper suggests that increasing the efficiency of courts can <str<strong>on</strong>g>have</str<strong>on</strong>g> asignificant effect <strong>on</strong> crime. Furthermore, Chappe (2008) has pointed out that there are many othersocial costs apart from crime that can be reduced by increasing the efficiency of courts such as: thelack of compensati<strong>on</strong> for injured parties, the dearth of accurate decisi<strong>on</strong>s in individual cases, thedeterrence of individuals who bring cases to the court, the decrease in the reliability and credibilityof the justice system, the fall in the net value of punishments and the deteriorati<strong>on</strong> in the quality ofevidence. In this sense, more attenti<strong>on</strong> ought to be paid to policies regarding court efficiency sincethese policies may <str<strong>on</strong>g>have</str<strong>on</strong>g> highly beneficial effects.
TablesTable 1. Homicide Rates per 100,000 inhabitantsin the World. Average for 1990sMortality due toViolenceLatin America &Caribbean 21.8North America 6.5Western Europe 4Form. Communist 17.2Western Pacific 7.8Source: Soares et al (2007)Table 2. <str<strong>on</strong>g>Court</str<strong>on</strong>g> Summary StatisticsMean Std. Dev. Min MaxPending Cases 7907.593 27122.66 87 181246Filed Cases 13883.73 41874.42 240 312686Re-filed Cases 319.2321 1167.157 0 9249Disposed Cases 13019.1 38465.34 241 295645Clearance Rate .5822525 .0814032 .3223887 .806082Note: Each mean was calculated taking into account the whole period (2001-2007).Table 3. <strong>Crime</strong> Summary Statistics at the Cant<strong>on</strong> LevelStd.VariableObs. Mean Dev. Min MaxTotal <strong>Crime</strong>s 280 830.41 493.09 132.20 2848.34<strong>Crime</strong>s Against Property 280 638.77 495.60 32.08 4286.66<strong>Crime</strong>s Against Life 276 58.95 57.00 1.92 693.53Psychotropic Substances Actviolati<strong>on</strong> 208 20.14 27.48 1.23 191.55Sexual Offenses 260 26.80 19.57 1.89 204.76Law Violati<strong>on</strong> 212 16.96 22.03 1.23 156.22<strong>Crime</strong>s Against Family 124 3.69 3.11 0.40 21.91<strong>Crime</strong>s Against Freedom 172 6.45 6.16 0.77 52.64<strong>Crime</strong>s Against the Public Admin. 219 16.84 16.93 1.31 110.76<strong>Crime</strong>s Against Public Faith 214 29.49 40.95 0.45 274.11Note: Each mean was calculated taking into account the whole period (2001-2007).
Table 4. <strong>Crime</strong> Rates per 100,000 Inhabitants2001 2002 2003 2004 2005 2006 2007 %Total <strong>Crime</strong>s 780.35 766.99 846.36 848.35 866.15 864.05 841.08 7.78<strong>Crime</strong>s Against Property 614.86 541.82 691.75 594.24 722.96 656.15 649.60 5.65<strong>Crime</strong>s Against Life 55.42 53.66 80.36 58.31 59.48 55.64 50.79 -8.35Psychotropic Substances Actviolati<strong>on</strong> 28.39 23.07 28.37 20.72 17.68 13.97 10.68 -62.38Sexual Offenses 26.37 30.27 34.24 29.54 22.32 19.35 25.21 -4.42Law Violati<strong>on</strong> 21.98 13.35 22.19 16.58 17.54 16.68 11.52 -47.59<strong>Crime</strong>s Against Family 3.40 3.23 3.62 3.43 4.31 3.92 3.91 14.97<strong>Crime</strong>s Against Freedom 6.97 8.12 6.67 5.84 7.39 4.93 5.64 -19.14<strong>Crime</strong>s Against Public Faith 22.83 31.62 50.61 39.39 25.59 13.27 16.00 -29.90<str<strong>on</strong>g>Court</str<strong>on</strong>g> <str<strong>on</strong>g>Efficiency</str<strong>on</strong>g>Table 5. <strong>Crime</strong> Rates per <str<strong>on</strong>g>Efficiency</str<strong>on</strong>g> Quantiles<strong>Crime</strong>s Against <strong>Crime</strong>sTotal <strong>Crime</strong>sProperty Against LifeSexualOffenses<strong>Crime</strong>s AgainstPublic FaithFirst Quantile 1049 825 76 29 34Sec<strong>on</strong>d Quantile 900 670 63 30 32Third Quantile 807 634 60 30 32Fourth Quantile 608 459 32 19 22Note: Each mean was calculated taken into account the period 2001-2007
Table 6.1 <str<strong>on</strong>g>Court</str<strong>on</strong>g> <str<strong>on</strong>g>Efficiency</str<strong>on</strong>g> and <strong>Crime</strong> Rates(A) (B) (C)FE FE FECaseload clearance rate -40.31631 -102.27456** -104.64207***(32.65263) (37.784) (36.920) % in crime rate 12 13Percentage of householdswithout incomePercentage of households inextreme povertyPercentage of householdswith unsatisfied basic needs-988.50593 -1,117.35260(853.577) (941.169)-350.24856 -369.42081(405.040) (410.799)-95.36101 -181.93079(237.856) (244.636)Unemployment rate -1,036.66196 -986.69309(1,093.890) (1,233.465)Unemployment rate^2 949.47623 643.79367(1,443.853) (1,558.789)Sentence rate -0.00034 -0.00038(0.001) (0.001)<str<strong>on</strong>g>Court</str<strong>on</strong>g> expenditure 6.94040 20.07500(22.524) (55.019)Number of judges, policeofficers and other pers<strong>on</strong>nel-0.32855(2.094)Cant<strong>on</strong> Fixed <str<strong>on</strong>g>Effect</str<strong>on</strong>g>s Yes Yes YesYear Fixed <str<strong>on</strong>g>Effect</str<strong>on</strong>g>s Yes Yes YesProvince Trends No Yes YesProvince Fixed <str<strong>on</strong>g>Effect</str<strong>on</strong>g>s No Yes YesC<strong>on</strong>stant 932.7158 1,397.67705*** 1,306.43250***(73.10723) (251.175) (342.262)Observati<strong>on</strong>s 239 189 179R-squared 0.18 0.406 0.413Number of Cant<strong>on</strong>s 40 38 36Note: Standard errors clustered at the cant<strong>on</strong> level are in braces.* Statistically different from zero at the .1 level of significance.** Statistically different from zero at the .05 level of significance.*** Statistically different from zero at the .01 level of significance.
Table 6.2 <str<strong>on</strong>g>Court</str<strong>on</strong>g> <str<strong>on</strong>g>Efficiency</str<strong>on</strong>g> and <strong>Crime</strong> Rates(D)(E)IVIVCaseload clearance rate -136.55536*** -104.86055**(48.596) (39.779)% in crime rate 17 13Percentage of householdswithout incomePercentage of households inextreme povertyPercentage of householdswith unsatisfied basic needs1,007.50113 -362.64679(2,451.700) (1,530.939)-95.24132 239.77853(386.579) (278.774)755.56324 845.71044*(685.588) (497.066)Unemployment rate -5,907.61584 -2,703.93940(3,947.771) (2,662.240)Unemployment rate^2 9,515.21885* 4,678.58837(5,471.289) (3,772.803)Sentence rate 0.01104*** 0.00795**(0.004) (0.003)<str<strong>on</strong>g>Court</str<strong>on</strong>g> expenditure 115.88575*** 42.70948(23.858) (35.367)Number of judges, policeofficers and other pers<strong>on</strong>nel1.04279**(0.420)Cant<strong>on</strong> Fixed <str<strong>on</strong>g>Effect</str<strong>on</strong>g>s No YesYear Fixed <str<strong>on</strong>g>Effect</str<strong>on</strong>g>s Yes YesProvince Trends Yes YesProvince Fixed <str<strong>on</strong>g>Effect</str<strong>on</strong>g>s Yes YesC<strong>on</strong>stant 1,660.85319** 1,051.65169*(816.481) (530.594)Observati<strong>on</strong>s 189 179R-squared 0.623 0.774Number of Cant<strong>on</strong>s 38 36Note: Standard errors clustered at the cant<strong>on</strong> level are in braces.* Statistically different from zero at the .1 level of significance.** Statistically different from zero at the .05 level of significance.*** Statistically different from zero at the .01 level of significance.
Table 6.3 First Stage Results(1)Appeal rate -53.444***(9.628)Sentences rate 0.00008**(0.000)<str<strong>on</strong>g>Court</str<strong>on</strong>g> expenditure 0.19631(0.233)Number of judges, police officers and other-0.00375*pers<strong>on</strong>nel(0.002)Percentage of households without income -18.94658(15.276)Percentage of households in extremepovertyPercentage of households with unsatisfiedbasic needs-2.19763(2.039)8.83292**(3.771)Unemployment rate -20.29347(19.617)Unemployment rate^2 29.69578(24.998)C<strong>on</strong>stant 3.95180(4.063)Observati<strong>on</strong>s 180R-squared 0.517Note: Standard errors clustered at the cant<strong>on</strong> level are in braces.* Statistically different from zero at the .1 level of significance.** Statistically different from zero at the .05 level of significance.*** Statistically different from zero at the .01 level of significance.
Table 7. <str<strong>on</strong>g>Deterrent</str<strong>on</strong>g> <str<strong>on</strong>g>Effect</str<strong>on</strong>g>(A)2001-2007Mean <strong>Crime</strong>Rate per 100,000(B)Estimated ImpactCoefficients of theFE Model(C)Estimated ImpactCoefficients ofthe IV ModelHomicides 12.20 -3.06032 1.487747(3.499403) (1.783337)Sexual Offenses 26.50 5.191448 -1.522643(6.5934) (1.82414)Note: Standard errors clustered at the cant<strong>on</strong> level are in parentheses.* Statistically different from zero at the .1 level of significance.** Statistically different from zero at the .05 level of significance.*** Statistically different from zero at the .01 level of significance.
ReferencesBeccaria, C. (1963). “Essays <strong>on</strong> crimes and punishments.”Bentham, J. (1962). “The Works of Jeremy Bentham.” New York: Russel and Russell.Becker, G. (1968). "<strong>Crime</strong> and Punishment: An Ec<strong>on</strong>omic Approach". The Journal of PoliticalEc<strong>on</strong>omy. Vol. 76, pp. 169–217.Buscaglia, E and Dakolias, M. (1999). “An Analysis of the Causes of Corrupti<strong>on</strong> in the Judiciary.”World Bank publicati<strong>on</strong>.Buscaglia, E. (2001). “Investigating the Links between Access to justice and Governance Factors:An Objective Indicator’s Approach.” Paper presented at the World Bank C<strong>on</strong>ference <strong>on</strong> Justice, St.Petersburg, Russia.Buscaglia, E. and Dakolias, M. (1999). “Comparative Internati<strong>on</strong>al Study of <str<strong>on</strong>g>Court</str<strong>on</strong>g> Performance.”World Bank publicati<strong>on</strong>.Chappe, N. (2008). “<str<strong>on</strong>g>Court</str<strong>on</strong>g> C<strong>on</strong>gesti<strong>on</strong> and the Decisi<strong>on</strong> to Litigate or Settle.” SSRN workingpaper.Chiricos, T.G. (1987). “Rates of <strong>Crime</strong> and Unemployment: An Analysis of Aggregate ResearchEvidence.” Social Problems, Vol. 34, No. 2, pp. 187-212.Chiricos, T. G. and Waldo, G. P. (1972). “Perceived Penal Sancti<strong>on</strong> and Self Reported Criminality:A Neglected Approach to Deterrence Research.” Social Problems, Vol. 19, pp. 522-540.Dalla Pellegrina, L. (2006). “<str<strong>on</strong>g>Court</str<strong>on</strong>g>s Delays and <strong>Crime</strong> Deterrence (An Applicati<strong>on</strong> to <strong>Crime</strong>sAgainst Property in Italy).” SSRN working paper.Darley M. J., Robins<strong>on</strong> P. H., (2003). “The Role of Deterrence in the Formulati<strong>on</strong> of Criminal LawRules: At Its Worst When Doing Its Best.” Georgetown Law Journal.Fenn, P. and Rickman N. (1999). “Delay and Settlement in Litigati<strong>on</strong>.” The Ec<strong>on</strong>omic Journal, Vol.109, No. 457, pp. 476-491.
Gibbs, J. P. (1968). “<strong>Crime</strong>, Punishment, and Deterrence.” Southwestern Social Science Quaterly,Vol. 48, pp. 515-530.Grasmick, H. G. and Bryjak G. J. (1980). “The <str<strong>on</strong>g>Deterrent</str<strong>on</strong>g> <str<strong>on</strong>g>Effect</str<strong>on</strong>g> of Perceived Severity ofPunishment”. Social Forces, Vol. 59, No. 2, pp. 471-491.Inter American Development Bank (1994). “Proposal for a loan for the modernizati<strong>on</strong> of theadministrati<strong>on</strong> of justice”.Inter American Development Bank (2003). “Informe de terminación de operaci<strong>on</strong>es. Costa Rica:Programa de Modernización Administración de Justicia”.Jensen, G. F. (1969). “<strong>Crime</strong> <str<strong>on</strong>g>Does</str<strong>on</strong>g>n’t Pay: Correlates of a Shared Misunderstanding.” SocialProblems, Vol. 17, pp. 189-201.Kessler, D. (1996). “Instituti<strong>on</strong>al Causes of Delay in the Settlement of Legal Disputes.” StanfordUniversity and Nati<strong>on</strong>al Bureau of Ec<strong>on</strong>omic Research, Vol. 12, No. 2.Krohn, M.D. (1986). “The Web of C<strong>on</strong>formity: A Network Approach to the Explanati<strong>on</strong> ofDelinquent Behavior.” Social Problems, Vol. 33, No. 6, Special Theory Issue, pp. S81-S93.Listokin, Y. (2004). “<strong>Crime</strong> and (with a Lag) Punishment: Equitable Sentencing and theImplicati<strong>on</strong>s of Discounting.” SSRN working paper.Muhl M. and Vereeck, L. (2000). “An Ec<strong>on</strong>omic Theory of <str<strong>on</strong>g>Court</str<strong>on</strong>g> Delay.” European Journal ofLaw and Ec<strong>on</strong>omics, Vol. 10, No. 3, pp. 243-268.Nagin, D. and Pogarsky, G. (2003).” An Experimental Investigati<strong>on</strong> of Deterrence: Cheating,Selfservicing Bias and Impulsivity.” Criminology, Vol. 41, No. 1, pp. 167-194.Pogarsky, G. (2002). “Identifying “deterrable” offenders: implicati<strong>on</strong>s for research <strong>on</strong> deterrence.”Justice Quarterly, Vol. 19, No. 3, pp. 431-452.Raphael S. and Winter-Ebmer R. (2001). “Identifying the <str<strong>on</strong>g>Effect</str<strong>on</strong>g> of Unemployment <strong>on</strong> <strong>Crime</strong>.”Journal of Law and Ec<strong>on</strong>omics, Vol. 44, pp. 259. 283.Soares, R. and Naritomi, J. (2007). “Understanding high crime rates in Latin America: the role ofsocial and policy factors.” Mimeo, PUC-Rio.
Tittle, C. R. (1969). “<strong>Crime</strong> Rates and Legal Sancti<strong>on</strong>s.” Social Problems, Vol. 16, No. 4, pp. 409-423.Torre A. (2003). “The Impact of <str<strong>on</strong>g>Court</str<strong>on</strong>g> Delays <strong>on</strong> the Prosecutor and the Defendant: An Ec<strong>on</strong>omicAnalysis.” European Journal of Law and Ec<strong>on</strong>omics, Vol. 16, No. 1, pp. 91-111.Torre (2008). “Socially Optimal Criminal <str<strong>on</strong>g>Court</str<strong>on</strong>g> Waiting Times: A Partial Investigati<strong>on</strong>.” AustralianEc<strong>on</strong>omic Papers.Urban, Lynn S. (2009). “Identifying “Deterrable” Offenders in a Sample of Active JuvenileOffenders.” The Southwest Journal of Criminal Justice, Vol. 6(1).Witte, A. D. (1983). “Ec<strong>on</strong>omic Theories.” Encyclopedia of <strong>Crime</strong> and Justice, Vol. 1.Wright, B. R.E., Caspi, A., Moffitt, T.E. and Paternoster, R. (2004). “<str<strong>on</strong>g>Does</str<strong>on</strong>g> the perceivedrisk of punishment deter criminally pr<strong>on</strong>e individuals? Rati<strong>on</strong>al choice, self-c<strong>on</strong>trol, andcrime.” Journal of Research in <strong>Crime</strong> & Delinquency, Vol.41, No. 2, pp. 180-214.


