English
English
English

You also want an ePaper? Increase the reach of your titles
YUMPU automatically turns print PDFs into web optimized ePapers that Google loves.
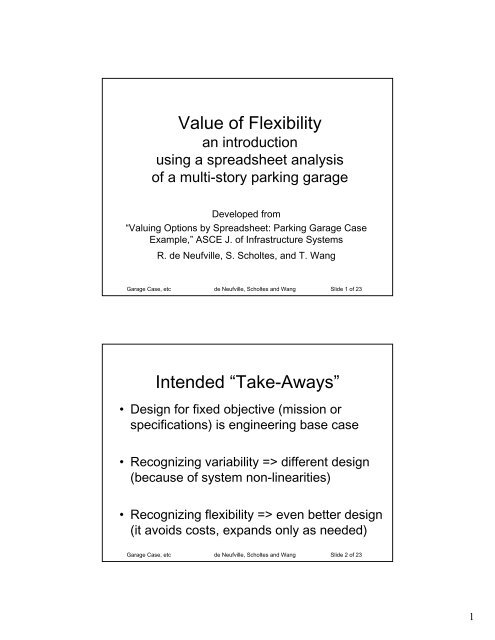
Value of Flexibilityan introductionusing a spreadsheet analysisof a multi-story parking garageDeveloped from“Valuing Options by Spreadsheet: Parking Garage CaseExample,” ASCE J. of Infrastructure SystemsR. de Neufville, S. Scholtes, and T. WangGarage Case, etc de Neufville, Scholtes and Wang Slide 1 of 23Intended “Take-Aways”• Design for fixed objective (mission orspecifications) is engineering base case• Recognizing variability => different design(because of system non-linearities)• Recognizing flexibility => even better design(it avoids costs, expands only as needed)Garage Case, etc de Neufville, Scholtes and Wang Slide 2 of 231
Value at Risk Concept• Value at Risk (VAR) recognizesfundamental reality: actual value of anydesign can only be known probabilistically• Because of inevitable uncertainty in– Future demands on system– Future performance of technology– Many other market, political factorsGarage Case, etc de Neufville, Scholtes and Wang Slide 3 of 23Value at Risk Definition• Value at Risk (VAR) definition:– A loss that will not be exceeded at somespecified confidence level– “We are p percent certain that we will not losemore than V dollars for this project.”• VAR easy to see on cumulative probabilitydistribution (see next figure)Garage Case, etc de Neufville, Scholtes and Wang Slide 4 of 232
CDFCumulative Probability100%80%60%40%20%0%-400 -200 0 200 400 600NPVA NPVBNPV90% VAR for NPVA90%VAR for NPVB 10% Probability• Look at distribution of NPV of designs A, B:– 90% VAR for NPVA is -$91– 90% VAR for NPVB is $102Garage Case, etc de Neufville, Scholtes and Wang Slide 5 of 23Notes:• Cumulative distribution function (CDF)shows the probability that the value of avariable is < or = to quantity on x axis• VAR can be found on the CDF curve:– 90% VAR => 10% probability the value isless or equal– NPV corresponding to the 10% CDF is90% VARGarage Case, etc de Neufville, Scholtes and Wang Slide 6 of 233
VAR and Flexibility• VAR is a common financial concept• It stresses downside losses, risks• However, designers also need to look atupside potential: “Value of Gain”• Flexible design provides value by both:– Decreasing downside risk– Increasing upside potential– See next figureGarage Case, etc de Neufville, Scholtes and Wang Slide 7 of 23Sources of value for flexibilityCut downside ; Expand UpsideCumulative ProbabilityExpand upside potentialOriginaldistributionDistribution withflexibilityCut downside risksValueGarage Case, etc de Neufville, Scholtes and Wang Slide 8 of 234
Excel Analysis Sequence toillustrate value of flexibility1: Examine situation without flexibility– This is Base case design2: Introduce variability (simulation)=> a different design (in general)3: Introduce flexibility=> a even different and better design• Note: Excel simulation techniques taught in ESD.70Garage Case, etc de Neufville, Scholtes and Wang Slide 9 of 23Parking Garage Case• Garage in area where population expands• Actual demand is necessarily uncertain• Design Opportunity: Stronger structure– enables future addition of floor(s) (flexibility)– Requires extra features (bigger columns, etc)– May cost less !!! Because can build smaller• Design issue: is flexibility worthwhile?Garage Case, etc de Neufville, Scholtes and Wang Slide 10 of 235
Parking Garage Case details• Demand– At start is for 750 spaces– Over next 10 years is expected to rise exponentially byanother 750 spaces– After year 10 may be 250 more spaces– could be 50% off the projections, either way;– Annual volatility for growth is 10%• Average annual revenue/space used = $10,000• The discount rate is taken to be 12%Garage Case, etc de Neufville, Scholtes and Wang Slide 11 of 23Parking Garage details (Cont)• Costs– annual operating costs (staff, cleaning, etc.) =$2,000 /year/space available(note: spaces used is often < spaces available)– Annual lease of the land = $3.6 Million– construction cost = $16,000/space + 10% for eachlevel above the ground level• Site can accommodate 200 cars per levelGarage Case, etc de Neufville, Scholtes and Wang Slide 12 of 236
Step 1: Set up base caseDemand growth as predicted, no variabilityYear0 1 2 3 19 20Demand 750 893 1,015 1,688 1,696Capacity 1,200 1,200 1,200 1,200 1,200Revenue $7,500,000 $8,930,000 $10,150,000 $12,000,000 $12,000,000Recurring CostsOperating cost $2,400,000 $2,400,000 $2,400,000 $2,400,000 $2,400,000Land leasing cost $3,600,000 $3,600,000 $3,600,000 $3,600,000 $3,600,000 $3,600,000Cash flow $1,500,000 $2,930,000 $4,150,000 $6,000,000 $6,000,000Discounted Cash Flow $1,339,286 $2,335,778 $2,953,888 $696,641 $622,001Present value of cash flow $32,574,736Capacity costs for up to two levels $6,400,000Capacity costs for levels above 2 $16,336,320Net present value $6,238,416Garage Case, etc de Neufville, Scholtes and Wang Slide 13 of 23Optimal design for base case(no uncertainty) is 6 floors10Expected NPV ($, Millions)50-5-10-152 3 4 5 6 7 8 9Number of FloorsTraditional NPVRecognizing uncertaintyGarage Case, etc de Neufville, Scholtes and Wang Slide 14 of 237
Step 2: Simulate uncertaintyLower demand => Loss600Higher demand => Gain limited by garage sizeFrequency5004003002005-floor designSimulated Mean6-floor designDeterministicResult1000-17.8 -15.6 -13.5 -11.3 -9.2 -7.0 -4.9 -2.7 -0.6 1.6 3.7 5.9 8.0Garage Case, etc de Neufville, Scholtes and Wang Slide 15 of 23NPV Cumulative DistributionsCompare Actual (5 Fl) with unrealistic fixed 6 Fl design10.90.8Probability0.70.60.50.40.3CDF for Result ofSimulation Analysis (5-floor)Implied CDF forResult of0.20.1Deterministic NPVA l i (6 fl )0-20 -15 -10 -5 0 5 10Garage Case, etc de Neufville, Scholtes and Wang Slide 16 of 238
Recognizing uncertainty =>different design (5 floors)10Expected NPV ($, Millions)50-5-10-152 3 4 5 6 7 8 9Number of FloorsTraditional NPVRecognizing uncertaintyGarage Case, etc de Neufville, Scholtes and Wang Slide 17 of 23Step 3: Introduce flexibility intodesign (expand when needed)Year0 1 2 3 19 20Demand 820 924 1,044 1,519 1,647Capacity 800 800 1,200 1,600 1,600Decision on expansionexpandExtra capacity 400Revenue $8,000,000 $8,000,000 $10,440,000 $15,190,000 $16,000,000Recurring CostsOperating cost $1,600,000 $1,600,000 $2,400,000 $3,200,000 $3,200,000Land leasing cost $3,600,000 $3,600,000 $3,600,000 $3,600,000 $3,600,000 $3,600,000Expansion cost $8,944,320Cash flow $2,800,000 -$6,144,320 $4,440,000 $8,390,000 $9,200,000Discounted Cash Flow $2,500,000 -$4,898,214 $3,160,304 $974,136 $953,734Present value of cash flow $30,270,287Capacity cost for up to two levels $6,400,000Capacity costs for levels above 2 $7,392,000Price for the option $689,600Net present value $12,878,287Including Flexibility => Another, better design:4 Floors with strengthened structure enabling expansionGarage Case, etc de Neufville, Scholtes and Wang Slide 18 of 239
Summary of design resultsfrom different perspectivesPerspective Simulation Option Embedded Design Estimated Expected NPVDeterministic No No 6 levels $6,238,416Recognizing Uncertainty Yes No 5 levels $3,536,474Incorporating Flexibilty Yes Yes4 levels with strengthenedstructure$10,517,140Why is the optimal design much betterwhen we design with flexibility?Garage Case, etc de Neufville, Scholtes and Wang Slide 19 of 23Sources of value for flexibility:1) Minimize exposure to downside riskProbability10.90.80.70.60.50.40.30.20.10-20 -15 -10 -5 0 5 105-Floor Design4-Floor DesignGarage Case, etc de Neufville, Scholtes and Wang Slide 20 of 2310
Sources of value for flexibility:2) Maximize potential for upside gain100.0%Probability90.0%80.0%70.0%60.0%50.0%40.0%30.0%20.0%10.0%Mean for NPVwithout FlexibilityCDF for NPVwithout FlexibilityMean for NPVwith FlexibilityCDF for NPVwith Flexibility0.0%-20 -15 -10 -5 0 5 10 15 20 25 30 35Garage Case, etc de Neufville, Scholtes and Wang Slide 21 of 23Comparison of designswith and without flexibilityDesign Design with Flexibility Thinking Design without Flexibility thinking Comparison(4 levels, strengthened structure) (5 levels)Initial Investment $18,081,600 $21,651,200 Better with optionsExpected NPV $10,517,140 $3,536,474 Better with optionsMinimum Value -$13,138,168 -$18,024,062 Better with optionsMaximum Value $29,790,838 $8,316,602 Better with optionsWow! Everything is better! How did it happen?Root cause: change the framing of design problemFrom: focus on a (mythical) forecast or set of specsTo: managing (realistic) uncertainties by flexibilityGarage Case, etc de Neufville, Scholtes and Wang Slide 22 of 2311
Summary• Sources of value for flexibility– Cut downside risk– Expand upside potential• VAR chart is a neat way to representthe sources of value for flexibility• Spreadsheet with simulation is apowerful tool for estimating value offlexibilityGarage Case, etc de Neufville, Scholtes and Wang Slide 23 of 2312