Adelaide Brighton Limited (ABC) - Taylor Collison Limited
Adelaide Brighton Limited (ABC) - Taylor Collison Limited
Adelaide Brighton Limited (ABC) - Taylor Collison Limited

You also want an ePaper? Increase the reach of your titles
YUMPU automatically turns print PDFs into web optimized ePapers that Google loves.
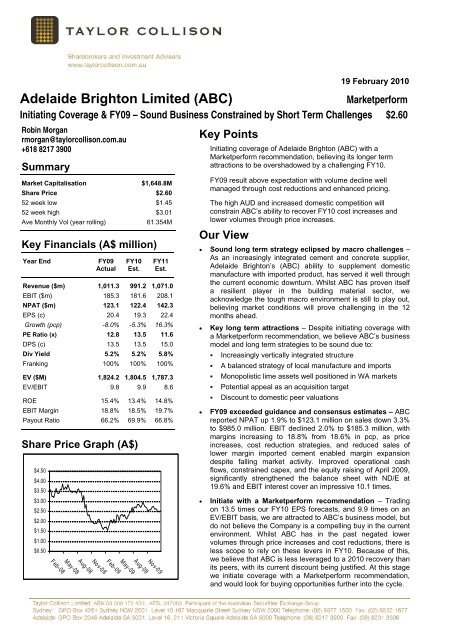
19 February 2010<br />
<strong>Adelaide</strong> <strong>Brighton</strong> <strong>Limited</strong> (<strong>ABC</strong>) Marketperform<br />
Initiating Coverage & FY09 – Sound Business Constrained by Short Term Challenges $2.60<br />
Robin Morgan<br />
rmorgan@taylorcollison.com.au<br />
+618 8217 3900<br />
Summary<br />
Market Capitalisation $1,648.8M<br />
Share Price $2.60<br />
52 week low $1.45<br />
52 week high $3.01<br />
Ave Monthly Vol (year rolling) 61.354M<br />
Key Financials (A$ million)<br />
Year End FY09<br />
Actual<br />
FY10<br />
Est.<br />
FY11<br />
Est.<br />
Revenue ($m) 1,011.3 991.2 1,071.0<br />
EBIT ($m) 185.3 181.6 208.1<br />
NPAT ($m) 123.1 122.4 142.3<br />
EPS (c) 20.4 19.3 22.4<br />
Growth (pcp) -8.0% -5.3% 16.3%<br />
PE Ratio (x) 12.8 13.5 11.6<br />
DPS (c) 13.5 13.5 15.0<br />
Div Yield 5.2% 5.2% 5.8%<br />
Franking 100% 100% 100%<br />
EV ($M) 1,824.2 1,804.5 1,787.3<br />
EV/EBIT 9.8 9.9 8.6<br />
ROE 15.4% 13.4% 14.8%<br />
EBIT Margin 18.8% 18.5% 19.7%<br />
Payout Ratio 66.2% 69.9% 66.8%<br />
Share Price Graph (A$)<br />
$4.50<br />
$4.00<br />
$3.50<br />
$3.00<br />
$2.50<br />
$2.00<br />
$1.50<br />
$1.00<br />
$0.50<br />
No v-0 9<br />
Aug-09<br />
May-09<br />
Feb-09<br />
No v-0 8<br />
Aug-08<br />
May-08<br />
Feb-08<br />
Key Points<br />
Initiating coverage of <strong>Adelaide</strong> <strong>Brighton</strong> (<strong>ABC</strong>) with a<br />
Marketperform recommendation, believing its longer term<br />
attractions to be overshadowed by a challenging FY10.<br />
FY09 result above expectation with volume decline well<br />
managed through cost reductions and enhanced pricing.<br />
The high AUD and increased domestic competition will<br />
constrain <strong>ABC</strong>’s ability to recover FY10 cost increases and<br />
lower volumes through price increases.<br />
Our View<br />
• Sound long term strategy eclipsed by macro challenges –<br />
As an increasingly integrated cement and concrete supplier,<br />
<strong>Adelaide</strong> <strong>Brighton</strong>’s (<strong>ABC</strong>) ability to supplement domestic<br />
manufacture with imported product, has served it well through<br />
the current economic downturn. Whilst <strong>ABC</strong> has proven itself<br />
a resilient player in the building material sector, we<br />
acknowledge the tough macro environment is still to play out,<br />
believing market conditions will prove challenging in the 12<br />
months ahead.<br />
• Key long term attractions – Despite initiating coverage with<br />
a Marketperform recommendation, we believe <strong>ABC</strong>’s business<br />
model and long term strategies to be sound due to:<br />
� Increasingly vertically integrated structure<br />
� A balanced strategy of local manufacture and imports<br />
� Monopolistic lime assets well positioned in WA markets<br />
� Potential appeal as an acquisition target<br />
� Discount to domestic peer valuations<br />
• FY09 exceeded guidance and consensus estimates – <strong>ABC</strong><br />
reported NPAT up 1.9% to $123.1 million on sales down 3.3%<br />
to $985.0 million. EBIT declined 2.0% to $185.3 million, with<br />
margins increasing to 18.8% from 18.6% in pcp, as price<br />
increases, cost reduction strategies, and reduced sales of<br />
lower margin imported cement enabled margin expansion<br />
despite falling market activity. Improved operational cash<br />
flows, constrained capex, and the equity raising of April 2009,<br />
significantly strengthened the balance sheet with ND/E at<br />
19.6% and EBIT interest cover an impressive 10.1 times.<br />
• Initiate with a Marketperform recommendation – Trading<br />
on 13.5 times our FY10 EPS forecasts, and 9.9 times on an<br />
EV/EBIT basis, we are attracted to <strong>ABC</strong>’s business model, but<br />
do not believe the Company is a compelling buy in the current<br />
environment. Whilst <strong>ABC</strong> has in the past negated lower<br />
volumes through price increases and cost reductions, there is<br />
less scope to rely on these levers in FY10. Because of this,<br />
we believe that <strong>ABC</strong> is less leveraged to a 2010 recovery than<br />
its peers, with its current discount being justified. At this stage<br />
we initiate coverage with a Marketperform recommendation,<br />
and would look for buying opportunities further into the cycle.
<strong>Adelaide</strong> <strong>Brighton</strong> <strong>Limited</strong> Page 2 of 10<br />
A resilient player, but the<br />
tough macro environment is<br />
still to play out for <strong>ABC</strong>.<br />
<strong>Limited</strong> leverage when<br />
compared with peers in FY10.<br />
Less scope to rely on cost<br />
reductions and increased<br />
prices to negate FY10 volume<br />
decline.<br />
Trading in line with<br />
international cement players.<br />
Discount to domestic peers.<br />
<strong>ABC</strong>’s multiples unlikely to<br />
move towards domestic peers,<br />
in the short term at least.<br />
Initiating Coverage with a Marketperform Recommendation<br />
As an increasingly integrated cement and concrete supplier to the Australian<br />
construction market, <strong>Adelaide</strong> <strong>Brighton</strong>’s (<strong>ABC</strong>) ability to supplement domestic<br />
manufacture with imported product, has served it well through the current<br />
economic downturn.<br />
Whilst <strong>ABC</strong> has proven itself a resilient player in the building material sector, we<br />
acknowledge the tough macro environment is still to play out. We initiate<br />
coverage with a Marketperform recommendation believing market conditions will<br />
prove challenging in the 12 months ahead. We will be carefully monitoring<br />
<strong>ABC</strong>’s share price and any changes in industry conditions, and will review our<br />
recommendation as appropriate.<br />
Trading on 13.5 times our FY10 EPS forecasts, and 9.9 times on an<br />
EV/EBIT basis, we view <strong>ABC</strong>’s business model and long term strategies<br />
favourably, but believe the Company’s leverage to a construction industry<br />
recovery to be limited in FY10, when compared with building sector peers.<br />
Macro Environment Caution for FY10<br />
We expect a challenging year ahead for <strong>ABC</strong>. Cement demand is forecast to<br />
decline a further 5%, with improving residential construction activity in 2H10,<br />
likely to be more than offset by constrained commercial and industrial demand.<br />
Whilst <strong>ABC</strong> has in the past negated lower volumes through price increases and<br />
cost reductions, there is less scope to rely on these levers in FY10.<br />
Rising FY10 energy prices will make the task of reducing <strong>ABC</strong>’s cost base all the<br />
more difficult. Furthermore, the combination of an historically high AUD, lower<br />
shipping costs, and increased domestic competition in the cement market is<br />
placing downward pressure on import parity pricing. This constrains <strong>ABC</strong>’s ability<br />
to recover cost increases and lower expected volumes through enhanced<br />
pricing. The arrival of imported lime into the WA market is a further risk to prices,<br />
volumes and margins, and <strong>ABC</strong>’s FY10 year therefore merits some caution.<br />
Peer Group Comparison<br />
The table below compares <strong>ABC</strong> with both international and domestic peers.<br />
Despite <strong>ABC</strong>’s discount, we believe it to be less leveraged to a 2010 recovery<br />
than its peers who are not subject to the same magnitude of import parity price<br />
pressures and are typically more diversified. We note BLD and FBU have June<br />
year ends, exaggerating <strong>ABC</strong>’s discount to its domestic peer average.<br />
Mkt Cap<br />
PE EV/EBIT<br />
(AU$m) FY1 FY2 FY1 FY2<br />
International<br />
Heidelberg Cement 11,476 12.4 10.5 11.7 9.0<br />
Holcim N 19,122 14.5 13.4 10.6 8.9<br />
Lafarge 21,863 12.6 11.3 10.8 9.8<br />
International Average 13.1 11.8 11.0 9.2<br />
<strong>ABC</strong> Prem/(Disc) to Intl Av. 2.5% (1.2%) (9.7%) (7.0%)<br />
Domestic<br />
Boral <strong>Limited</strong> 3,298 25.3 15.8 17.9 12.3<br />
CSR <strong>Limited</strong> 2,522 10.3 9.7 8.3 7.9<br />
Fletcher Building 3,788 16.2 12.4 11.4 9.3<br />
James Hardie Indust 3,372 17.9 13.6 12.3 9.2<br />
<strong>Adelaide</strong> <strong>Brighton</strong> 1,629 13.5 11.6 9.9 8.6<br />
Domestic Average (excl. <strong>ABC</strong>) 17.4 12.9 12.5 9.7<br />
<strong>ABC</strong> Prem/(Disc) to Dom Av. (22.8%) (9.8%) (20.4%) (11.1%)<br />
Overall Average (excl. <strong>ABC</strong>) 17.9 12.6 11.9 9.5<br />
<strong>ABC</strong> Prem/(Disc) to Overall Av. (24.7%) (7.8%) (16.2%) (9.4%)<br />
Note: FY1 relates to the following yr ends: <strong>ABC</strong> & intl peers - 31 Dec 2010; BLD & FBU - 30 Jun 2010; CSR & JHX - 31 Mar 2011<br />
<strong>ABC</strong> typically trades at a discount to peers. Historically, <strong>ABC</strong> operated solely as<br />
a cement manufacturer, lacking growth opportunities or diversity. Even when<br />
lime and downstream concrete were introduced, <strong>ABC</strong>’s register was cramped by<br />
Barro and Boral. Having diversified its product offering, and with a register more<br />
open than it has been for over a decade (following Boral’s exit in May 09), <strong>ABC</strong>’s<br />
multiple may more closely align with peers. However, given the FY10 pressures<br />
on demand, pricing and costs are perhaps more excessive than those on peers<br />
– and with <strong>ABC</strong> less equipped to counter them – the current discount is justified.<br />
<strong>Taylor</strong> <strong>Collison</strong> <strong>Limited</strong> 19 February 2010
<strong>Adelaide</strong> <strong>Brighton</strong> <strong>Limited</strong> Page 3 of 10<br />
Attractive long term business<br />
model and strategies.<br />
Increasing vertical integration<br />
provides greater security to<br />
end market demand.<br />
Using imports as a balance<br />
against changing demand,<br />
enables full capacity<br />
utilisation.<br />
Longer Term Business Attractions<br />
Despite initiating coverage with a Marketperform recommendation based on<br />
challenging FY10 market conditions, we believe <strong>ABC</strong>’s business model and long<br />
term strategies to be sound. The following factors are key long term attractions:<br />
1. Increasingly vertically integrated structure<br />
2. Sensible balancing of domestic clinker manufacturing and overseas import<br />
3. Monopolistic lime assets serving the WA alumina and gold sectors<br />
4. Discount to peers and potential appeal as an acquisition target<br />
We first detail the above key attractions, before providing a business overview,<br />
and finally a summary of FY09 and the key risks facing the business.<br />
1. Increasing vertical integration across cement, aggregates & concrete<br />
Vertical integration is the key to long-term success in the cement industry,<br />
providing security of cement and clinker outlets and an extra avenue for<br />
diversified growth. Since its 2002 acquisition of Premier Resources, <strong>ABC</strong> has<br />
built an integrated portfolio of quarrying, clinker grinding and pre-mixed concrete<br />
assets. The charts below highlight the successful execution of <strong>ABC</strong>’s<br />
downstream strategy over the past 10 years.<br />
Segment Turnover - 2000<br />
20%<br />
12%<br />
68%<br />
Cement Lime Other<br />
Segment Turnover - 2009<br />
<strong>Taylor</strong> <strong>Collison</strong> <strong>Limited</strong> 19 February 2010<br />
16%<br />
14%<br />
16%<br />
54%<br />
Cement Lime<br />
Concrete & Agg's Masonry Prod's<br />
<strong>ABC</strong>’s strategy has provided market leverage, a greater security to end market<br />
demand, and exposure to existing facilities along Australia’s east coast. <strong>ABC</strong><br />
now derives integration benefits across the entire value chain. We note that<br />
whilst this is a major improvement for <strong>ABC</strong>, it simply brings it more into line with<br />
its already integrated competitors both in Australia and overseas.<br />
2. Two-pronged strategy of local manufacture with supplementary imports<br />
<strong>ABC</strong>’s focus on domestic clinker manufacture and long term import agreements<br />
provides some protection from both the vagaries of a fragile construction market,<br />
and the downside leverage associated with a high fixed cost cement industry.<br />
Using imports as a balancing factor against changing demand, <strong>ABC</strong> has<br />
maintained full utilisation at its local manufacturing facilities. The benefits of this<br />
strategy are further enhanced as imports command a lower margin, and are the<br />
first to be cut in a declining demand environment. In 2009, <strong>ABC</strong> manufactured<br />
1.9 mt of clinker and imported approx. 0.4 mt, maintaining its domestic<br />
manufacture at close to 2008 levels, but reducing its imports by approx. 45%.<br />
12.0<br />
10.0<br />
8.0<br />
6.0<br />
4.0<br />
2.0<br />
0.0<br />
2000<br />
2001<br />
Clinker Capacity vs. Demand<br />
2002<br />
2003<br />
2004<br />
2005<br />
2006<br />
2007<br />
2008<br />
2009<br />
Domestic clinker capacity (mtpa) Market Demand (mtpa)<br />
The chart above details the Australian clinker market over the past decade. With<br />
the exception of the 2001 recession, demand has consistently outstripped<br />
production, even in 2009’s GFC affected slowdown. Market commentators are<br />
currently calling a bottom in construction market demand with a predicted late<br />
2010 recovery, with <strong>ABC</strong> likely to maintain its clinker plants at full capacity.
<strong>Adelaide</strong> <strong>Brighton</strong> <strong>Limited</strong> Page 4 of 10<br />
<strong>ABC</strong>’s lime assets dominate<br />
the Australian marketplace.<br />
Low cost production means<br />
high profitability.<br />
Security of customers given<br />
their low global refining costs.<br />
Demand growth expected<br />
over medium term.<br />
More open register and<br />
attractive lime assets provide<br />
some acquisition appeal.<br />
3. Monopolistic lime assets serving the WA alumina and gold industries<br />
<strong>ABC</strong> has a leading position in the lime market with continuing expected strength<br />
in Australian lime demand:<br />
� <strong>ABC</strong>’s lime producing assets dominate the Australian lime market –<br />
Quicklime consumption by WA’s four alumina refineries (operated by Alcoa<br />
and Worsley) account for approximately 70% of <strong>ABC</strong>’s lime demand. The<br />
gold industry currently represents 15-20% of demand.<br />
� Low cost production – With <strong>ABC</strong>’s Cockburn lime business sourcing local low<br />
cost sea sands and utilising modern fuel efficient pre-heater kilns firing on<br />
local low cost coal, we understand <strong>ABC</strong>’s lime assets to be highly profitable.<br />
The capital costs involved in setting up a plant, and the difficulties in locating<br />
suitable resources near to suitable markets, provide high barriers to entry.<br />
� Only supplier of scale – With no other source able to logistically or<br />
economically supply 0.55 mt of lime to the Australian alumina industry (and<br />
0.35 mt to the WA gold industry), <strong>ABC</strong> is in a strong position. Major long term<br />
contracts with Alcoa and Worsley are to be renegotiated in 2011 and 2013<br />
and we believe <strong>ABC</strong> will achieve significant price increases. There is a risk<br />
that the arrival of import competition may affect price negotiations, but <strong>ABC</strong>’s<br />
low cost domestic operations put it at a competitive advantage.<br />
� Supplier to lowest quartile alumina cost producers – The security of BHP’s<br />
Worsley and Alcoa’s WA refineries is assured given they are in the lowest<br />
quartile of alumina refining cost worldwide. Even through the lowest points of<br />
a resources trough, risks to capacity are limited. In fact, during a resource<br />
downturn, marginal high-cost producers are forced out of production, only<br />
enhancing the prospects for the competitive Australian refineries.<br />
� Refinery expansion should drive demand – The medium term requirements<br />
for lime in the WA market are set to increase with the expansion of BHP’s<br />
Worsley alumina refinery currently underway. The expansion project is<br />
expected to lift Worsley’s alumina output capacity from the current 3.5 mtpa<br />
to 4.6 mtpa, increasing its lime consumption by some 60,000 to 70,000<br />
tonnes per year, and making it one of the largest alumina refineries in the<br />
world.<br />
4. Discount to peers and potential appeal as an acquisition target<br />
Following Boral’s sell down of its 17.6% stake in May 2009, <strong>ABC</strong>’s register is<br />
now more open with only Barro Group holding a substantial 23% position. There<br />
is a general consensus from our industry discussions that the structure of the<br />
Australian cement industry is likely to change over the medium term. We<br />
question Cement Australia’s current 75:25 Holcim:Hanson JV structure, and<br />
whether Holcim will take full ownership in time. We also note that Lafarge is the<br />
last major cement manufacturer without Australian exposure, although its Asian<br />
operations and the Australian market’s limited size, perhaps means it does not<br />
necessarily need a presence here. We believe industry change is likely, and<br />
whilst it is impossible to predict if this will involve <strong>ABC</strong> or not, <strong>ABC</strong>’s open<br />
register, smaller size, and its unique lime assets do make it a viable player in<br />
any medium term industry consolidation.<br />
<strong>Taylor</strong> <strong>Collison</strong> <strong>Limited</strong> 19 February 2010
<strong>Adelaide</strong> <strong>Brighton</strong> <strong>Limited</strong> Page 5 of 10<br />
Integrated construction<br />
materials and lime producer.<br />
Complicated Australian<br />
cement industry structure, but<br />
it works efficiently.<br />
Increasing downstream<br />
operations on the east coast.<br />
<strong>Adelaide</strong> <strong>Brighton</strong> - Business Overview<br />
<strong>ABC</strong> is an integrated construction materials and lime producer. The business can<br />
be split into three broad divisions involving: clinker (a raw material of cement)<br />
and lime production; pre-mixed concrete and aggregate manufacture; and a<br />
masonry products business.<br />
Clinker, cement and lime involves the production of clinker and cement in SA<br />
(1.5 mtpa capacity) and WA (0.6 mtpa capacity), and quicklime through <strong>ABC</strong>’s<br />
Cockburn operations at Kwinana in WA (1.0 mtpa capacity). Limestone is<br />
sourced from various quarry operations across SA, WA and the Northern<br />
Territory, with lime sand dredged from Owen Anchorage near Perth by Cockburn<br />
Cement.<br />
Ownership of the Australian cement industry is dominated by three domestic<br />
manufacturers – Blue Circle Southern Cement (100% Boral); Cement Australia<br />
(75% Holcim; 25% Hanson); and <strong>ABC</strong>. There are also two major independents<br />
importing clinker and cement directly – Buckeridge Group (WA) and Wagners<br />
(Qld). Given the numerous JV’s existing within the industry, the structure is best<br />
represented in a flow chart as below. Whilst complicated, we understand the<br />
Australian cement industry to work remarkably efficiently.<br />
Australian Cement Industry Ownership<br />
Source: <strong>Adelaide</strong> <strong>Brighton</strong> <strong>Limited</strong><br />
Concrete and aggregates is involved in the pre-mixed concrete markets of Vic,<br />
NSW and SE Qld through <strong>ABC</strong>’s 100% owned Hy-Tec business, and a 50:50 JV<br />
with the Mawson Group. Emerging positions exist in aggregates supply with<br />
strategic reserves of aggregates west of Sydney and in Northern NSW.<br />
Masonry products incorporates <strong>ABC</strong>’s Adbri Masonry brand which holds a<br />
market leading position in Australia in the masonry products markets with<br />
operations in Qld, NSW, Vic, Tasmania and SA.<br />
<strong>Taylor</strong> <strong>Collison</strong> <strong>Limited</strong> 19 February 2010
<strong>Adelaide</strong> <strong>Brighton</strong> <strong>Limited</strong> Page 6 of 10<br />
Resilient FY09 sales and<br />
earnings performance.<br />
EBIT margin expansion.<br />
EPS decline on equity raising.<br />
Tight control of working<br />
capital.<br />
Undergeared balance sheet.<br />
FY09 Result above Expectations<br />
Sales decline of 3.3% despite lower cement and concrete volumes. Lower<br />
demand for cement, concrete and concrete products was partially offset by<br />
enhanced pricing. The level of sales decline is commendable given cement<br />
volumes contracted by 11%, concrete volumes by 15%, and concrete product<br />
demand by 15%. The key components of <strong>ABC</strong>’s FY09 result are detailed below.<br />
($ million) FY08A FY09A FY10E FY11E<br />
Sales 1,018.3 985.0 979.3 1,059.0<br />
Growth (%) 15.1% -3.3% -0.6% 8.1%<br />
EBIT 189.1 185.3 181.6 208.1<br />
EBIT Margin (%) 18.6% 18.8% 18.5% 19.7%<br />
NPAT 120.8 123.1 122.4 142.3<br />
Growth (%) 6.1% 1.9% -0.6% 16.3%<br />
EBIT down 2.0%, but 9.0% ahead of our forecasts. FY09 margins increased<br />
to 18.8% from 18.6% in pcp. Price increases, cost reduction strategies<br />
(delivering $15 million of EBIT improvements), and reduced sales of lower<br />
margin imported cement enabled margin expansion despite falling market<br />
activity.<br />
NPAT increased 1.9% to $123.1 million, ahead of guided $105-115 million.<br />
<strong>ABC</strong>’s tax rate reverted back to a more typical 27%, following the 22% of pcp,<br />
further highlighting the quality of FY09’s earnings resilience.<br />
EPS decline to 20.4 cents from 22.2 cents in pcp, due to the dilutionary<br />
effects of 2009’s institutional equity raising and share purchase plan.<br />
Dividend of 8.0 cents declared, bringing FY09 payment to 13.5 cents, with<br />
the Board maintaining <strong>ABC</strong>’s 60-70% payout ratio. The 2.5% discounted DRP<br />
was suspended. At current prices <strong>ABC</strong> offers a 5.2% fully franked dividend yield.<br />
Operating cash flows of $188.1 million, up from $150.1 million in pcp.<br />
Focused working capital management enabled inventories to be reduced 7.1%,<br />
with tight control over engineering spare parts in particular.<br />
Net debt reduced to $175 million from $388 million in pcp, through improved<br />
operational cash flows, constrained capex, and the $111 million equity raising of<br />
April 2009. <strong>ABC</strong>’s balance sheet is now significantly undergeared with gearing<br />
(ND/E) of 19.6% well below management’s comfort range of 40-60%, and EBIT<br />
interest cover at an impressive 10.1 times. The chart below details <strong>ABC</strong>’s<br />
improving EBIT interest cover and gearing levels together with our forecasts.<br />
60%<br />
40%<br />
20%<br />
0%<br />
Gearing (ND/E) & EBIT Interest Cover<br />
FY06A<br />
<strong>Taylor</strong> <strong>Collison</strong> <strong>Limited</strong> 19 February 2010<br />
FY07A<br />
FY08A<br />
FY09A<br />
FY10E<br />
Gearing EBIT Interest Cover<br />
<strong>ABC</strong> operates in a high fixed cost industry with substantial cash tied up in clinker<br />
and lime producing assets. Cement and lime plants require ongoing and at times<br />
major capital works and this is represented in <strong>ABC</strong>’s rolling five year FCF cash<br />
conversion averaging a moderate, albeit consistent, 50-60%. <strong>ABC</strong>’s well<br />
documented WA lime kiln expansion plans have the potential to tie up $25-30<br />
million over a three year period when committed. We have factored this spend<br />
into our FY10 and FY11 numbers with <strong>ABC</strong>’s balance sheet flexibility and cash<br />
flow positions more than adequate to cover its downstream integration strategy.<br />
FY11E<br />
20<br />
15<br />
10<br />
5<br />
0
<strong>Adelaide</strong> <strong>Brighton</strong> <strong>Limited</strong> Page 7 of 10<br />
Cement to experience a 5%<br />
volume decline in FY10.<br />
Price increases constrained<br />
by higher AUD and lower<br />
shipping rates.<br />
Lack of funding in commercial<br />
and industrial sector.<br />
Flat lime demand in FY09,<br />
with expectations for the same<br />
in FY10.<br />
New entrant to WA lime<br />
market a threat to prices.<br />
Energy costs to rise $8-10<br />
million in FY10.<br />
Integration synergies now<br />
being delivered.<br />
FY09 Segmental Performance<br />
Cement, Lime & Concrete reported a 3.5% decline in EBIT on sales down<br />
4.7% as detailed below. EBIT margins expanded to 17.4% from 17.2% in pcp.<br />
Cement, Lime & Concrete FY08A FY09A FY10E FY11E<br />
Sales 1,114.7 1,062.5 1,035.9 1,121.4<br />
Sales Growth (%) 39.0% -4.7% -2.5% 8.3%<br />
EBIT 191.8 185.1 180.3 205.8<br />
EBIT Growth (%) 22.9% -3.5% -2.6% 14.2%<br />
EBIT Margin (%) 17.2% 17.4% 17.4% 18.4%<br />
Although this division is not split into cement, concrete and lime operations,<br />
management did disclose FY09 sales trends and provide an FY10 commentary.<br />
� Cement – Despite a 15% decline in FY09 Australian cement demand, <strong>ABC</strong>’s<br />
cement volumes declined only 11% with modest cement price increases<br />
achieved early in the year. Predictions are for a 5% national decline in cement<br />
volumes in FY10, although <strong>ABC</strong>’s greater SA, WA and mining exposure<br />
means it will be less impacted than its east coast centric peers. Lost volumes<br />
through BHP’s Olympic Dam shaft malfunction will however continue in 1Q10<br />
as the shaft remains under repair. We understand <strong>ABC</strong>’s quarterly supply of<br />
cement to Olympic Dam to be approx. 30,000 tonnes. Overall we forecast a<br />
3.5% reduction in <strong>ABC</strong> cement volumes during FY10.<br />
Price increases in FY10 will be more difficult given the combined effects that<br />
AUD strength and lower shipping rates have on import parity pricing, as well<br />
as the competitive pressures of Wagners’ new Qld clinker grinding facilities.<br />
� Concrete & Aggregates – With pre-mixed concrete volumes down 15% in<br />
FY09, commercial construction still constrained by funding, and any<br />
meaningful residential sector demand not expected until 2H10, <strong>ABC</strong>’s concrete<br />
business is likely to remain under pressure over the next six months. Pricing<br />
was increased early in FY09, but management indicate pressures were<br />
evident towards the end of the year.<br />
Aggregates demand in FY09 increased as the Pacific Highway upgrade and<br />
regional NSW infrastructure demand consumed volumes. Price increases<br />
were ahead of inflation, and this is likely to continue in FY10.<br />
� Lime – Lime volumes were flat in FY09 as demand from the gold and alumina<br />
sectors offset decreases in nickel. Demand is expected to remain flat in FY10.<br />
Lime pricing improved by 6% in FY09, enabling margins to be sustained. The<br />
ability to implement future price rises is expected to be impacted by the arrival<br />
of an overseas lime importer in to the WA market. With lime being the most<br />
profitable part of <strong>ABC</strong>’s business, management will aggressively protect<br />
market share. This is likely to see any new entrant crowded out of the market<br />
over the medium term, but short term price risks are a real threat.<br />
Energy costs are a major concern for FY10, effecting both cement and lime<br />
manufacture. Gas prices in particular are expected to increase energy costs by<br />
$8-10 million in FY10, adding to the headwinds currently facing <strong>ABC</strong>.<br />
Masonry Products reported 3.3% EBIT growth on 8.7% sales growth as<br />
detailed below. 2H09 earnings improved to $4.4 million following 1H09’s<br />
breakeven EBIT, although FY09 margins still fell to 3.3% from 7.0% in pcp.<br />
Masonry Products FY08A FY09A FY10E FY11E<br />
Sales 122.2 132.8 141.4 152.4<br />
Sales Growth (%) 48.1% 8.7% 6.5% 7.8%<br />
EBIT 8.5 4.4 5.7 6.9<br />
EBIT Growth (%) 372.2% -48.2% 28.6% 21.2%<br />
EBIT Margin (%) 7.0% 3.3% 4.0% 4.5%<br />
Industry volumes declined 25% on average. Price increases offset some of the<br />
input cost pressures, whilst the final stages of the integration of the Hanson/C&M<br />
acquisition successfully delivered $3.0 million of annualised synergies.<br />
<strong>Taylor</strong> <strong>Collison</strong> <strong>Limited</strong> 19 February 2010
<strong>Adelaide</strong> <strong>Brighton</strong> <strong>Limited</strong> Page 8 of 10<br />
Greatest risk is to industry<br />
stability.<br />
Industry conditions unlikely to<br />
improve in FY10.<br />
Imported clinker and lime a<br />
threat to volumes and pricing.<br />
AUD strength is placing<br />
downward pressure on import<br />
price parity.<br />
Gas price rises a risk for<br />
<strong>ABC</strong>’s energy intensive<br />
operations.<br />
Uncertainty over a future<br />
emissions trading scheme<br />
(ETS).<br />
Maintenance downtime and<br />
plant failures an ongoing<br />
industry risk.<br />
Key Risks<br />
Industry stability<br />
In the current environment of lower construction material demand, with a new<br />
CEO in place at Boral, and a new market entrant (Wagners) importing cement<br />
into the Qld market, the biggest risk to <strong>ABC</strong> currently is stability within the<br />
Australian cement industry.<br />
Market demand risks<br />
Whilst there are encouraging early signs for Australian residential markets, the<br />
next six months are likely to prove challenging. The commercial and industrial<br />
sectors remain impacted by funding constraints, with our industry discussions<br />
confirming the immediate outlook for commercial construction looks far from<br />
encouraging. Government stimulus packages are certainly helping, but need to<br />
be supported by the private sector.<br />
Imported Asian clinker and lime<br />
The Asian dumping of cement that was hugely problematic for the cement<br />
industry in 2000 are long gone, but the threat of independents importing product<br />
remains, as highlighted with Wagners in Qld. The arrival of imported lime in WA<br />
places pressure on <strong>ABC</strong>’s highly profitable lime operations and is a clear<br />
reminder of the risks associated with import competition.<br />
AUD strength<br />
With Australian cement prices linked to import price parity, the strengthening<br />
AUD is placing downward pressure on cement prices. In <strong>ABC</strong>’s case, sharp<br />
spikes in the AUD can in fact benefit its imported cement earnings, but longer<br />
term lower AUD rates are preferred. As previously indicated, historically high<br />
AUD levels, in combination with lower shipping costs and increased domestic<br />
competition, are placing downward pressure on import price parity.<br />
Cost inflation on higher energy prices<br />
With energy estimated at approximately 30% of cement and lime plant COGS,<br />
<strong>ABC</strong> is significantly exposed to energy price rises. The rising cost of gas has to<br />
some extent been managed through the conversion of <strong>ABC</strong>’s lime kilns to coal in<br />
the past 18 months, and <strong>ABC</strong>’s yearly maintenance shutdown being rescheduled<br />
to February each year when energy demand and energy costs can be at their<br />
most extreme. This however only mitigates a portion of energy cost pressures.<br />
<strong>ABC</strong>’s confirmation of an $8-10 million impact from gas costs in FY10 clearly<br />
highlights the risks for energy intensive industries.<br />
Emissions Trading Scheme...or lack thereof<br />
Uncertainty surrounding the Government’s failed ETS and what may replace it is<br />
cause for some caution. Any impacts are likely to still be some years away, but<br />
the ETS has potentially significant repercussions for highly energy intensive<br />
industries such as cement and lime. <strong>ABC</strong> has estimated the possible impacts of<br />
an ETS as anywhere from a $5-14 million EBIT reduction by 2016. We will<br />
continue to monitor developments over coming months.<br />
Operational issues<br />
With cement and lime being highly capital intensive industries there is the<br />
ongoing risk of plant failures, maintenance downtime, and the requirement for<br />
major capital investment. We do however understand <strong>ABC</strong>’s main cement plant<br />
at Birkenhead in SA to be well maintained, despite aging, whilst <strong>ABC</strong>’s lime<br />
assets are for the most part modern and efficient.<br />
<strong>Taylor</strong> <strong>Collison</strong> <strong>Limited</strong> 19 February 2010
<strong>Adelaide</strong> <strong>Brighton</strong> <strong>Limited</strong> Page 9 of 10<br />
<strong>Adelaide</strong> <strong>Brighton</strong> <strong>Limited</strong> - Summary of Forecasts <strong>ABC</strong> $ 2.60<br />
PROFIT & LOSS SUMMARY (A$m) BALANCE SHEET SUMMARY<br />
Period FY08A FY09A FY10E FY11E Period FY08A FY09A FY10E FY11E<br />
Total Revenue 1,034.1 1,011.3 991.2 1,071.0 Cash 23.1 25.5 29.1 31.9<br />
Growth (pcp) 15.5% -2.2% -2.0% 8.0% Receivables 151.6 162.8 175.9 192.8<br />
EBITDA 245.9 242.1 240.2 266.8 Inventories 116.1 107.8 114.0 128.5<br />
Dep'n/Other Amort'n (56.8) (56.8) (58.6) (58.7) Other 0.0 12.7 12.7 12.7<br />
EBIT 189.1 185.3 181.6 208.1 Total Current Assets 290.8 308.8 331.8 365.9<br />
Net Interest (33.8) (16.7) (13.9) (13.1) Receivables 28.4 30.4 34.7 37.5<br />
Pre-Tax Profit 155.3 168.6 167.7 195.0 Investments 67.6 72.5 72.5 72.5<br />
Tax Expense (34.5) (45.4) (45.3) (52.6) Inventories 0.0 0.0 0.0 0.0<br />
Minorities 0.0 (0.1) 0.0 0.0 Property Plant & Equip 801.9 774.3 775.7 787.0<br />
NPAT Adj. 120.8 123.1 122.4 142.3 Intangibles 169.4 169.0 169.0 169.0<br />
Growth (pcp) 6.1% 1.9% -0.6% 16.3% Other 0.0 0.0 1.0 1.6<br />
Abnormals 0.0 0.0 0.0 0.0 Total Non-Current Assets 1,067.3 1,046.2 1,052.9 1,067.6<br />
Reported Profit 120.8 123.1 122.4 142.3 TOTAL ASSETS 1,358.1 1,355.0 1,384.7 1,433.5<br />
Accounts Payable 98.0 106.1 114.0 123.2<br />
PER SHARE DATA Borrowings 0.4 0.4 0.4 0.4<br />
Period FY08A FY09A FY10E FY11E Provisions 23.6 24.4 29.7 30.0<br />
EPS Adj. (c) 22.2 20.4 19.3 22.4 Other 20.9 31.0 26.1 26.6<br />
Growth (pcp) 5.6% -8.0% -5.3% 16.3% Total Current Liab 142.9 161.9 170.2 180.2<br />
Dividend (c) 15.0 13.5 13.5 15.0 Borrowings 410.5 200.5 184.5 170.0<br />
Franking 100% 100% 100% 100% Provisions 32.7 29.9 29.7 31.1<br />
Gross CF per Share (c) 25.2 30.3 26.1 27.8 Other 70.1 65.7 64.7 63.7<br />
NTA per share (c) 97.0 121.0 120.9 129.2 Total Non-Current Liab 513.3 296.1 278.9 264.7<br />
TOTAL LIABILITIES 656.2 458.0 449.2 444.9<br />
KEY RATIOS TOTAL EQUITY 701.9 897.0 935.5 988.6<br />
Period FY08A FY09A FY10E FY11E<br />
EBITDA/Sales Margin % 24.1% 24.6% 24.5% 25.2% CASH FLOW SUMMARY<br />
EBIT/Sales Margin % 18.6% 18.8% 18.5% 19.7% Period FY08A FY09A FY10E FY11E<br />
EBIT Interest cover (x) 5.1 10.1 12.5 15.0 EBIT (excl Abs/Extr) 189.1 185.3 181.6 208.1<br />
Free CF / NPAT (5 yr avg) 56.9% 66.5% 79.7% 80.8% Add: Depreciation 56.8 56.8 58.6 58.7<br />
Current ratio (x) 2.0 1.9 1.9 2.0 Change in Pay. 13.2 8.1 7.9 9.2<br />
Net Debt : Equity (%) 55.3% 19.6% 16.7% 14.0% Less: Tax paid (34.5) (45.4) (45.3) (52.6)<br />
ROE (%) 17.6% 15.4% 13.4% 14.8% Net Interest (33.8) (16.7) (13.9) (13.1)<br />
Dividend Payout Ratio (%) 67.7% 66.2% 69.9% 66.8% Change in Rec. (21.7) (13.2) (17.4) (19.6)<br />
Change in Inv. (31.8) 8.3 (6.2) (14.5)<br />
VALUATION MULTIPLES Gross Cashflows 137.3 183.2 165.2 176.1<br />
Period FY08A FY09A FY10E FY11E Capex (56.0) (43.1) (60.0) (70.0)<br />
PER (x) 11.7 12.8 13.5 11.6 Free Cashflows 81.3 140.1 105.2 106.1<br />
Dividend Yield (%) 5.8% 5.2% 5.2% 5.8% Dividends Paid (76.4) (45.6) (85.6) (88.8)<br />
FCF Yield (%) 5.7% 8.9% 6.4% 6.4% Net Cash Flow 4.9 94.5 19.6 17.3<br />
EV/EBITDA (x) 8.3 7.5 7.5 6.7<br />
EV/EBIT (x) 10.8 9.8 9.9 8.6<br />
<strong>Taylor</strong> <strong>Collison</strong> <strong>Limited</strong> 19 February 2010
<strong>Adelaide</strong> <strong>Brighton</strong> <strong>Limited</strong> Page 10 of 10<br />
Disclaimer<br />
Disclaimer<br />
The following Warning, Disclaimer and Disclosure relate to all material presented in this document and should be read before<br />
making any investment decision.<br />
Warning (General Advice Only): Past performance is not a reliable indicator of future performance. This report is a<br />
private communication to clients and intending clients and is not intended for public circulation or publication or for the use of<br />
any third party, without the approval of <strong>Taylor</strong> <strong>Collison</strong> <strong>Limited</strong> ABN 53 008 172 450 ("<strong>Taylor</strong> <strong>Collison</strong>"), an Australian<br />
Financial Services Licensee and Participant of the ASX Group. While the report is based on information from sources that<br />
<strong>Taylor</strong> <strong>Collison</strong> considers reliable, its accuracy and completeness cannot be guaranteed. This report does not take into<br />
account specific investment needs or other considerations, which may be pertinent to individual investors, and for this reason<br />
clients should contact <strong>Taylor</strong> <strong>Collison</strong> to discuss their individual needs before acting on this report. Those acting upon such<br />
information and recommendations without contacting one of our advisors do so entirely at their own risk.<br />
This report may contain “forward-looking statements". The words "expect", "should", "could", "may", "predict", "plan" and<br />
other similar expressions are intended to identify forward-looking statements. Indications of and guidance on, future earnings<br />
and financial position and performance are also forward looking statements. Forward-looking statements, opinions and<br />
estimates provided in this report are based on assumptions and contingencies which are subject to change without notice, as<br />
are statements about market and industry trends, which are based on interpretations of current market conditions.<br />
Any opinions, conclusions, forecasts or recommendations are reasonably held at the time of compilation but are subject to<br />
change without notice and <strong>Taylor</strong> <strong>Collison</strong> assumes no obligation to update this document after it has been issued. Except<br />
for any liability which by law cannot be excluded, <strong>Taylor</strong> <strong>Collison</strong>, its directors, employees and agents disclaim all liability<br />
(whether in negligence or otherwise) for any error, inaccuracy in, or omission from the information contained in this document<br />
or any loss or damage suffered by the recipient or any other person directly or indirectly through relying upon the information.<br />
Disclosure: Analyst remuneration is not linked to the rating outcome. <strong>Taylor</strong> <strong>Collison</strong> may solicit business from any company<br />
mentioned in this report. For the securities discussed in this report, <strong>Taylor</strong> <strong>Collison</strong> may make a market and may sell or buy<br />
on a principal basis. <strong>Taylor</strong> <strong>Collison</strong>, or any individuals preparing this report, may at any time have a position in any securities<br />
or options of any of the issuers in this report and holdings may change during the life of this document.<br />
Analyst Interests: The Analyst(s) may hold the product(s) referred to in this document, but <strong>Taylor</strong> <strong>Collison</strong> <strong>Limited</strong> considers<br />
such holdings not to be sufficiently material to compromise the rating or advice. Analyst(s)’ holdings may change during the<br />
life of this document.<br />
Analyst Certification: The Analyst(s) certify that the views expressed in this document accurately reflect their personal,<br />
professional opinion about the financial product(s) to which this document refers.<br />
Date Prepared: 19 February 2010<br />
Analyst: Robin Morgan<br />
Release Authorised by: Mark Pittman<br />
<strong>Taylor</strong> <strong>Collison</strong> <strong>Limited</strong> 19 February 2010