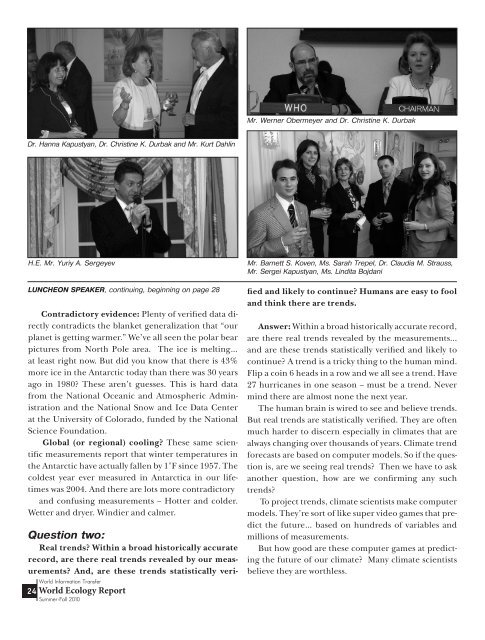
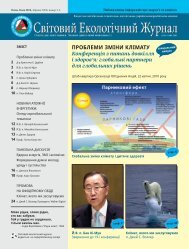
Mr. Werner Obermeyer and Dr. Christine K. DurbakDr. Hanna Kapustyan, Dr. Christine K. Durbak and Mr. Kurt DahlinH.E. Mr. Yuriy A. SergeyevLUNCHEON SPEAKER, continuing, beginning on page 28Contradictory evidence: Plenty of verified data directlycontradicts the blanket generalization that “ourplanet is getting warmer.” We’ve all seen the polar bearpictures from <strong>No</strong>rth Pole area. The ice is melting…at least right now. But did you know that there is 43%more ice in the Antarctic today than there was 30 yearsago in 1980? These aren’t guesses. This is hard datafrom the National Oceanic and Atmospheric Administrationand the National Snow and Ice Data Centerat the University of Colorado, funded by the NationalScience Foundation.Global (or regional) cooling? These same scientificmeasurements report that winter temperatures inthe Antarctic have actually fallen by 1°F since 1957. Thecoldest year ever measured in Antarctica in our lifetimeswas 2004. And there are lots more contradictoryand confusing measurements – Hotter and colder.Wetter and dryer. Windier and calmer.<strong>World</strong> <strong>Information</strong> <strong>Transfer</strong>24 <strong>World</strong> Ecology ReportSummer-Fall 2010Mr. Barnett S. Koven, Ms. Sarah Trepel, Dr. Claudia M. Strauss,Mr. Sergei Kapustyan, Ms. Lindita BojdaniQuestion two:Real trends? Within a broad historically accuraterecord, are there real trends revealed by our measurements?And, are these trends statistically verifiedand likely to continue? Humans are easy to fooland think there are trends.Answer: Within a broad historically accurate record,are there real trends revealed by the measurements...and are these trends statistically verified and likely tocontinue? A trend is a tricky thing to the human mind.Flip a coin 6 heads in a row and we all see a trend. Have27 hurricanes in one season – must be a trend. Nevermind there are almost none the next year.The human brain is wired to see and believe trends.But real trends are statistically verified. They are oftenmuch harder to discern especially in climates that arealways changing over thousands of years. Climate trendforecasts are based on computer models. So if the questionis, are we seeing real trends? Then we have to askanother question, how are we confirming any suchtrends?To project trends, climate scientists make computermodels. They’re sort of like super video games that predictthe future… based on hundreds of variables andmillions of measurements.But how good are these computer games at predictingthe future of our climate? Many climate scientistsbelieve they are worthless.
Question three:Potentially catastrophic? If there are real trends,how likely are they to be potentially catastrophic?Or, are these trends part of an ever-changing fluctuationin our climate?Answer: The single most famous graph of the wholeglobal warming controversy is the infamous ‘hockeystick’ chart. It was created by Penn State climatologistMichael Mann. However, Professor David Hand, Presidentof Great Britain’s Royal Statistical Society, largelyinvalidated the infamous ‘hockey stick’ graph. Hesaid this graph strongly “exaggerated” warming trendsacross the whole 20th century. He said that the data, ifaccurate, shows that the 20th century was slightly warmer…but nowhere near the alarmist numbers.Trends take time to see. One reason we don’t knowif trends are meaningful is because climate trends takecenturies to really become clear. When you try to makepredictions based on a few decades, you risk beingwildly wrong. History proves this.History tells us that the climate alarmists have beenwrong before about supposedly dire “trends.” Theycan be wrong again. And if you were to make a bet, thesmart money would say they are wrong again.If we can’t verify significant trends, then we certainlycan’t know if we face potential catastrophe. You can’tbuild certainty on top of uncertainty. Yes, we can allforecast that a 6-degree temperature increase wouldmean melting ice and rising seas. But if it’s not basedon facts, it’s not a useful projection.Question four:How much human impact? If there is a potentiallycatastrophic trend, how much of trend is likely to beattributable to human activity? We could be largelyresponsible or a minor element.Answer: Carbon dioxide (CO 2) is the most importantgreenhouse gas; Human beings are mostly responsiblefor the steady increase in CO 2measurements inthe atmosphere. This argument is unproven at everypoint. Ounce for ounce, a molecule of methane is 20xmore effective at trapping heat than CO 2. Methane productionmay be far more important than CO 2. Amongother things, enormous amounts of methane are producedby the billions of cows, pigs, and other animalswe farm to eat. Also, 60% or more of CO 2in the air isnot human-caused but is naturally caused by the biologyof the earth. CO 2increased dramatically in Europe600 years ago. This was not due to cars or industrialmanufacturing.Question five:What can we do? If human activity is a significantpart of a catastrophic trend toward potentially catastrophicclimate change, specifically more globalwarming… What can we do to help reduce the potentialfor serious global harm?As individuals?As companies?As economies?As nations?Answer: We don’t need policies unless we can clearlyidentify the problems. You know who loves big newtrillion-dollar programs? Bureaucrats who administerthem, politicians who tell us we need them and companiesand especially consultants who want to sell usthings.“Extraordinary claims requireextraordinary evidence.”- 20th century astronomer Carl SaganQuestion six:If there are things we can do to reduce the chancesof climate catastrophe, what are the costs andtradeoffs in doing so?Financial resources aren’t infinite so there are alwaystradeoffs. Classic tradeoffs are more schools vs.more hospitals…More drug research vs. more clean waterplants.Answer: <strong>No</strong>w it’s about lives, not science. Up untilnow, the discussion has been about science.From here on out, it becomes about life and death.We have to weigh the potential risk of “killing the planet”against the potential risk of condemning millionsof people who could be saved with that money. Moneyused properly can feed children, discover cures, buildhospitals and provide clean water.Question seven:Does our normal calculus apply? When we evaluatethe possible tradeoffs, do we use an ordinary<strong>World</strong> <strong>Information</strong> <strong>Transfer</strong><strong>World</strong> Ecology ReportSummer-Fall 201025