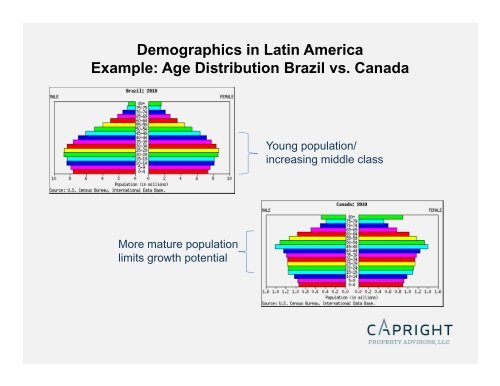
Demographics in Latin America Example: Age Distribution Brazil vs ...
Demographics in Latin America Example: Age Distribution Brazil vs ...
Demographics in Latin America Example: Age Distribution Brazil vs ...

Create successful ePaper yourself
Turn your PDF publications into a flip-book with our unique Google optimized e-Paper software.
Travel Times and Time ChangesRoute Travel Time Time Difference Route Travel Time Time DifferenceToronto to Beij<strong>in</strong>g 14 hours 13 hours Toronto to Sao Paulo 12 hours 1 - 3 hoursToronto to Delhi 22 hours 11 hours Toronto to Mexico City 5 hours 1 hourToronto to Moscow 15 hours 9 hours Toronto to Bogotá 6 hours None
BRAZIL IS NOW AN ECONOMIC POWERHOUSE<strong>Brazil</strong> is now a major economic power
<strong>Brazil</strong>Natural Resource Advantage
<strong>Brazil</strong>3500%3000%2500%Historical Inflation Rate2011 TotalForeign Direct Investment2000%1500%1000%500%0%September 2012: 5.28%In the 3% ‐ 7% ranges<strong>in</strong>ce 200519851987198919911993199519971999200120032005200720092011Country World Rank US$ (Billions)Ch<strong>in</strong>a 7 776.0<strong>Brazil</strong> 13 426.4Russia 16 343.4India 20 225.0Source: CIA World Factbook<strong>Brazil</strong>’s Stable Economy Attract<strong>in</strong>g Foreign Investment
<strong>Brazil</strong>Socio-economic Disparities
<strong>Brazil</strong>Infrastructure Deficiencies
<strong>Brazil</strong>Retail Market Trends<strong>Brazil</strong> only has about 400shopp<strong>in</strong>g centers (+/- 1 per450,000 people)Little variety <strong>in</strong> retail formatsGROC ratios for satellitetenants <strong>in</strong> the 12% – 15%range at well run malls.Expected annual retail salesgrowth <strong>in</strong> the 8% to 10%range for the next 3 years.Over 20 transactions so farthis year, cap rates rangefrom 5% - 10%
<strong>Brazil</strong>Office Market TrendsVery little office vacancy <strong>in</strong> the best districts of São Paulo and Rio de Janeiro.175,000 square meters of new office space has been delivered <strong>in</strong> São Paulo thisyear. Only 12,000 square meters added to <strong>in</strong>ventory <strong>in</strong> Rio de Janeiro.Market Rents for Class A space <strong>in</strong> São Paulo and Rio range from R$120 – R$200per square meter/month ($65 – $110 per square foot per year).Cap rates <strong>in</strong> the 7% - 10% range.
<strong>Brazil</strong>Hous<strong>in</strong>g Market TrendsIncreased access to f<strong>in</strong>anc<strong>in</strong>ghas <strong>in</strong>creased demand forhous<strong>in</strong>g, especially <strong>in</strong> the middle<strong>in</strong>come segment.Government subsidizedprograms have been good forhome buyers, but bad fordevelopers.Construction costs haveskyrocketed due to labor andmaterials shortages.Hous<strong>in</strong>g <strong>in</strong> the upper-<strong>in</strong>comesegment may be reach<strong>in</strong>gsaturation po<strong>in</strong>t.Trend towards smaller unit size.
<strong>Brazil</strong>Logistics Market TrendsSignificant spec construction activity <strong>in</strong> São Paulo. Less availableland <strong>in</strong> Rio de Janeiro. Strong demand for modern product <strong>in</strong> bothmarkets.Rio and São Paulo rents R$20 – R$27 per square meter per month($11 – $15 per square foot per year).Cap rates <strong>in</strong> the 8.5% - 10.0% range.Construction is underway <strong>in</strong> many secondary markets.
MexicoSecurity Concerns Persist
MexicoTijuana$3.96‐$0.23 Juarez$3.87‐$0.13Monterrey$4.24+$0.22Reynosa$3.62‐$0.49Bajio$4.39‐$0.11MX City$5.77+$0.49Ask<strong>in</strong>g Rent (US$/SF/YR) as of 2Q12Rental Rates <strong>in</strong> Major Industrial Markets
MexicoPublic and privatecompetition result<strong>in</strong>g <strong>in</strong> caprate compressionPublic markets buy<strong>in</strong>g +/-100bps lower than private marketsFIBRAs focused on acquisitionCKDs focused on developmentImpact of FIBRAs and CKDs
ColombiaPro-bus<strong>in</strong>ess GovernmentOil Reserves/ExportsInfrastructure InvestmentGrow<strong>in</strong>g Middle ClassFavorable Risk Profile
Colombia$20$18$16$14$12$10$8$6$4$2$02002 2003 2004 2005 2006 2007 2008 2009 2010 2011 2012 eSource: Proexporta ColombiaHistorical FDI (US$Billions)26% YOY <strong>in</strong>crease as of mid-2012Equity International <strong>in</strong>vestsUS$75M <strong>in</strong> Terranum (Aug 11)Celf<strong>in</strong> plans to launch 2 nd fundfor US$100M <strong>in</strong> 1Q13Acon Investments seek<strong>in</strong>g toraise US$500MBogotá-based AltraInvestments aim<strong>in</strong>g to raiseUS$300M <strong>in</strong> 4Q12Foreign Direct Investment on the Rise
Other Lat<strong>in</strong> <strong>America</strong>n MarketsPeru: One of the fastest grow<strong>in</strong>geconomies <strong>in</strong> the world, but stillseek<strong>in</strong>g political stability.Chile: The most stable andsophisticated bus<strong>in</strong>ess environment<strong>in</strong> Lat<strong>in</strong> <strong>America</strong>, but it is a smallmarket.Argent<strong>in</strong>a: Strong populistmovement, high <strong>in</strong>flation, and adifficult bus<strong>in</strong>ess environment.
Conclud<strong>in</strong>g Thoughts…Different selloff/leas<strong>in</strong>g riskProperty rights that favor the tenantFractured <strong>in</strong>terestsCurrency/sovereign riskConstruction cost/tim<strong>in</strong>g risk fordevelopment assetsThe Risks are Different <strong>in</strong> Lat<strong>in</strong> <strong>America</strong>