Capitol Hill briefing - National Climatic Data Center - NOAA
Capitol Hill briefing - National Climatic Data Center - NOAA
Capitol Hill briefing - National Climatic Data Center - NOAA

You also want an ePaper? Increase the reach of your titles
YUMPU automatically turns print PDFs into web optimized ePapers that Google loves.
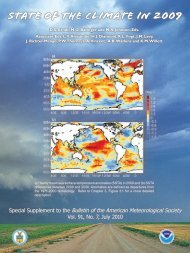
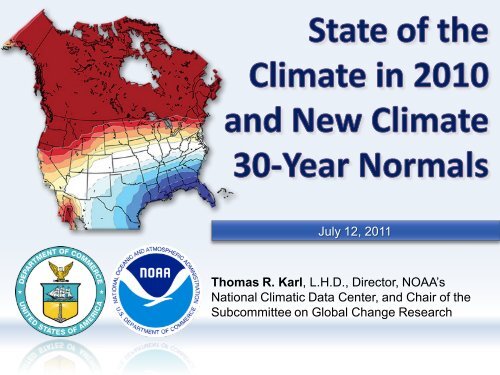
Global average surface temperature among thetwo warmest of the instrumental recordAir samples collected weekly at<strong>NOAA</strong>’s Mauna Loa observatorycontinue to show a rise in theconcentration of carbon dioxide.Three data sets show globalsurface temperatures continue torise; 2010 was one of the twowarmest years on record.Greenland's ice sheet lost moremass in 2010 than at any time inthe past ten years.July 2011 State of the Climate in 20103
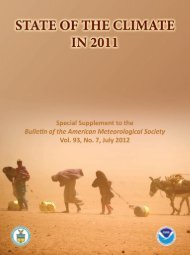
• Multiple indicators, same bottom line conclusion– Consistent and unmistakable signal from the top of theatmosphere to the bottom of the oceansJan-Dec Global Mean Temperature over Land & OceanYearJuly 2011 State of the Climate in 20107
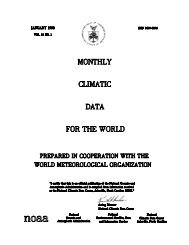
• Lingering effects of El Niño were responsible, in part, for 2010being one of two warmest years on record• Relationship between emerging La Niña and very slow tropicalcyclone season in the Pacific• La Niña also associated withAustralia floodingYellow indicates El Niño; Blue indicates La NiñaJuly 2011State of the Climate in 20109
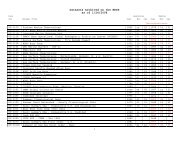
• Used to understand typical climateconditions for thousands of locations acrossthe United States– <strong>Data</strong> from 7500 weather stations fortemperature; 9300 stations for precipitation• The "normal" of a particular variable, suchas temperature, is defined as the 30-yearaverage– NCDC uses robust standardization and qualitycontrol methodology• Widely used by broadcast meteorologists,energy industry and agricultural/gardeningsectorNormals Include:• Maximum andMinimum Temperatures• Precipitation, Snowfall,and Snow Depth• Heating and CoolingDegree DaysJuly 2011State of the Climate in 201014
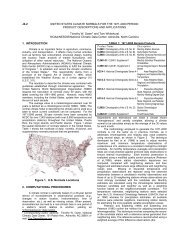
July Maximum Temperature (F): 1981-2010 Minus 1971-200015
January Minimum Temperature (F): 1981-2010 Minus 1971-200016
Percent Changes in Annual Normal Precipitation17