Current online water quality monitoring methods and their suitability ...
Current online water quality monitoring methods and their suitability ...
Current online water quality monitoring methods and their suitability ...

You also want an ePaper? Increase the reach of your titles
YUMPU automatically turns print PDFs into web optimized ePapers that Google loves.
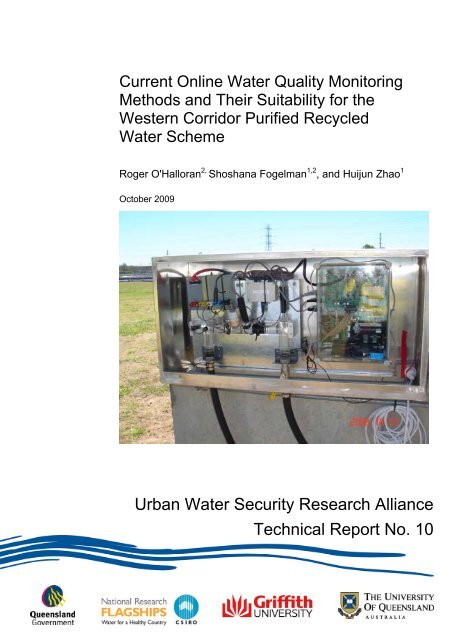
<strong>Current</strong> Online Water Quality MonitoringMethods <strong>and</strong> Their Suitability for theWestern Corridor Purified RecycledWater SchemeRoger O'Halloran 2, Shoshana Fogelman 1,2 , <strong>and</strong> Huijun Zhao 1October 2009Urban Water Security Research AllianceTechnical Report No. 10
Urban Water Security Research Alliance Technical Report ISSN 1836-5566 (Online)Urban Water Security Research Alliance Technical Report ISSN 1836-5558 (Print)The Urban Water Security Research Alliance (UWSRA) is a $50 million partnership over five years between theQueensl<strong>and</strong> Government, CSIRO’s Water for a Healthy Country Flagship, Griffith University <strong>and</strong> TheUniversity of Queensl<strong>and</strong>. The Alliance has been formed to address South-East Queensl<strong>and</strong>'s emerging urban<strong>water</strong> issues with a focus on <strong>water</strong> security <strong>and</strong> recycling. The program will bring new research capacity toSouth-East Queensl<strong>and</strong> tailored to tackling existing <strong>and</strong> anticipated future issues to inform the implementation ofthe Water Strategy.For more information about the:UWSRA - visit http://www.urban<strong>water</strong>alliance.org.au/Queensl<strong>and</strong> Government - visit http://www.qld.gov.au/Water for a Healthy Country Flagship - visit www.csiro.au/org/HealthyCountry.htmlThe University of Queensl<strong>and</strong> - visit http://www.uq.edu.au/Griffith University - visit http://www.griffith.edu.au/Enquiries should be addressed to:The Urban Water Security Research AlliancePO Box 15087CITY EAST QLD 4002Ph: 07-3247 3005; Fax: 07-3405 3556Email: Sharon.Wakem@qwc.qld.gov.auAuthors: 1 - Griffith School of Environment <strong>and</strong> Australian Rivers Institute, Gold Coast Campus, GriffithUniversity, Queensl<strong>and</strong>; 2 - CSIRO L<strong>and</strong> <strong>and</strong> Water, Clayton South, VictoriaRoger O'Halloran, Shoshana Fogelman <strong>and</strong> Huijun Zhao (2009). <strong>Current</strong> Online Water Quality MonitoringMethods <strong>and</strong> Their Suitability for the Western Corridor Purified Recycled Water Scheme. Urban Water SecurityResearch Alliance Technical Report No. 10.Copyright <strong>and</strong> Disclaimer© 2009 CSIRO To the extent permitted by law, all rights are reserved <strong>and</strong> no part of this publication covered bycopyright may be reproduced or copied in any form or by any means except with the written permission ofCSIRO.DisclaimerThe partners in the UWSRA advise that the information contained in this publication comprises generalstatements based on scientific research <strong>and</strong> does not warrant or represent the accuracy, currency <strong>and</strong>completeness of any information or material in this publication. The reader is advised <strong>and</strong> needs to be aware thatsuch information may be incomplete or unable to be used in any specific situation. No action shall be made inreliance on that information without seeking prior expert professional, scientific <strong>and</strong> technical advice. To theextent permitted by law, UWSRA (including its Partner’s employees <strong>and</strong> consultants) excludes all liability toany person for any consequences, including but not limited to all losses, damages, costs, expenses <strong>and</strong> any othercompensation, arising directly or indirectly from using this publication (in part or in whole) <strong>and</strong> any informationor material contained in it.Cover Photograph:Description: <strong>Current</strong> system configuration of six self-contained sensing probesPhotographer: CSIRO© CSIRO
ACKNOWLEDGEMENTSThis research was undertaken as part of the South East Queensl<strong>and</strong> Urban Water Security ResearchAlliance, a scientific collaboration between the Queensl<strong>and</strong> Government, CSIRO, The University ofQueensl<strong>and</strong> <strong>and</strong> Griffith University.Funding for this research was provided by the SEQ Urban Water Security Research Alliance, GriffithUniversity <strong>and</strong> CSIRO.<strong>Current</strong> Online Water Quality Monitoring Methods <strong>and</strong> Their Suitability for the Western CorridorPurified Recycled Water SchemePage i
FOREWORDWater is fundamental to our <strong>quality</strong> of life, to economic growth <strong>and</strong> to the environment. With itsbooming economy <strong>and</strong> growing population, Australia's South-East Queensl<strong>and</strong> (SEQ) region facesincreasing pressure on its <strong>water</strong> resources. These pressures are compounded by the impact of climatevariability <strong>and</strong> accelerating climate change.The Urban Water Security Research Alliance, through targeted, multidisciplinary research initiatives,has been formed to address the region’s emerging urban <strong>water</strong> issues.As the largest regionally focused urban <strong>water</strong> research program in Australia, the Alliance is focused on<strong>water</strong> security <strong>and</strong> recycling, but will align research where appropriate with other <strong>water</strong> researchprograms such as those of other SEQ <strong>water</strong> agencies, CSIRO’s Water for a Healthy Country NationalResearch Flagship, Water Quality Research Australia, eWater CRC <strong>and</strong> the Water ServicesAssociation of Australia (WSAA).The Alliance is a partnership between the Queensl<strong>and</strong> Government, CSIRO’s Water for a HealthyCountry National Research Flagship, The University of Queensl<strong>and</strong> <strong>and</strong> Griffith University. It bringsnew research capacity to SEQ, tailored to tackling existing <strong>and</strong> anticipated future risks, assumptions<strong>and</strong> uncertainties facing <strong>water</strong> supply strategy. It is a $50 million partnership over five years.Alliance research is examining fundamental issues necessary to deliver the region's <strong>water</strong> needs,including:ensuring the reliability <strong>and</strong> safety of recycled <strong>water</strong> systems.advising on infrastructure <strong>and</strong> technology for the recycling of waste<strong>water</strong> <strong>and</strong> storm<strong>water</strong>.building scientific knowledge into the management of health <strong>and</strong> safety risks in the <strong>water</strong> supplysystem.increasing community confidence in the future of <strong>water</strong> supply.This report is part of a series summarising the output from the Urban Water Security ResearchAlliance. All reports <strong>and</strong> additional information about the Alliance can be found athttp://www.urban<strong>water</strong>alliance.org.au/about.html.Chris DavisChair, Urban Water Security Research Alliance<strong>Current</strong> Online Water Quality Monitoring Methods <strong>and</strong> Their Suitability for the Western CorridorPurified Recycled Water SchemePage ii
CONTENTSAcknowledgements.................................................................................................................iForeword .................................................................................................................................iiContents .................................................................................................................................iiiList of Figures........................................................................................................................ivList of Tables..........................................................................................................................ivExecutive Summary................................................................................................................11. Aim of the Review .........................................................................................................42. Overview of the PRW System ......................................................................................43. Online Water Quality Requirements for the WCRW Scheme ....................................6Barrier 1............................................................................................................................................. 7Barrier 2............................................................................................................................................. 7Barrier 3............................................................................................................................................. 8Barrier 4............................................................................................................................................. 8Barrier 5............................................................................................................................................. 8Barrier 6............................................................................................................................................. 9Barrier 7............................................................................................................................................. 94. Review of Existing Online Monitoring Analysers.....................................................104.1 <strong>Current</strong> Online Water Quality Monitoring System Performance....................................... 124.2 Overview of Measuring Principles of Commercially Available Online MonitoringSystems ............................................................................................................................ 13Photometric Sensors ....................................................................................................................... 13Ion Selective Electrodes (ISE)......................................................................................................... 144.3 Desirable Autonomous Water Quality Monitoring of WCRW Scheme ............................. 144.4 Advanced Approaches to improve the <strong>suitability</strong> of Online Instruments for <strong>their</strong>intended purpose .............................................................................................................. 15Improving Sensor Selectivity ........................................................................................................... 15Improving Stability <strong>and</strong> Consumption of Reagents.......................................................................... 15Overcoming Matrix Interferences .................................................................................................... 16Simplification of Calibration ............................................................................................................. 16Reducing Sample Pre-Treatment .................................................................................................... 16Sensor Fouling <strong>and</strong> Failure ............................................................................................................. 17Other Issues .................................................................................................................................... 175. Commercially Available Sensors – Suitability for WCRW Project..........................175.1 Organic Load Indicators.................................................................................................... 18Commercially Available Sensors ..................................................................................................... 18BOD 5 ............................................................................................................................................... 18COD ................................................................................................................................................ 19Total Organic Carbon (TOC) (including dissolved organic carbon, DOC) ....................................... 20Turbidity........................................................................................................................................... 20Suspended Solids ........................................................................................................................... 205.2 Nutrients............................................................................................................................ 21Nitrogen........................................................................................................................................... 21Phosphorus ..................................................................................................................................... 22Ammonia ......................................................................................................................................... 225.3 Inorganic parameters........................................................................................................ 23Research <strong>and</strong> Development ............................................................................................................ 235.4 Heavy Metals .................................................................................................................... 24Research <strong>and</strong> Development ............................................................................................................ 255.5 Physicochemical Sensors................................................................................................. 265.6 Microbial Contaminants .................................................................................................... 27Research <strong>and</strong> Development ............................................................................................................ 285.7 Pesticides.......................................................................................................................... 29Research <strong>and</strong> Development ............................................................................................................ 29<strong>Current</strong> Online Water Quality Monitoring Methods <strong>and</strong> Their Suitability for the Western CorridorPurified Recycled Water SchemePage iii
5.8 Endocrine Disrupting Compounds (EDCs) ....................................................................... 29Research <strong>and</strong> Development ............................................................................................................ 295.9 Trihalomethanes (THMs) .................................................................................................. 29Research <strong>and</strong> Development ............................................................................................................ 295.10 Nitrosamines ..................................................................................................................... 305.11 Pharmaceuticals ............................................................................................................... 30Research <strong>and</strong> Development ............................................................................................................ 305.12 Volatile Organic Carbon (VOC) ........................................................................................ 30Research <strong>and</strong> Development ............................................................................................................ 305.13 Early Warning Systems .................................................................................................... 30Research <strong>and</strong> Development ............................................................................................................ 316. Conclusions <strong>and</strong> Recommendations ........................................................................316.1 Conclusions ...................................................................................................................... 316.2 Summary of Recommendations ....................................................................................... 33Recommendation 1: ........................................................................................................................ 33Recommendation 2: ........................................................................................................................ 33Recommendation 3: ........................................................................................................................ 33Recommendation 4: ........................................................................................................................ 33Recommendation 5: ........................................................................................................................ 33Recommendation 6: ........................................................................................................................ 33Recommendation 7: ........................................................................................................................ 33Recommendation 8: ........................................................................................................................ 34Recommendation 9: ........................................................................................................................ 347. References ...................................................................................................................35Appendix 1: Review of Commercially Available Sensors for WCRW Project................39Appendix 2: Review of Research Developments for Contaminants of Concern...........43LIST OF FIGURESFigure 1Figure 2Schematic diagram of the 7 Barrier treatment process employed in the WCRW Project(Queensl<strong>and</strong> Water Commission Fact Sheet 4 1 )............................................................................... 4Schematic diagram of the South East Queensl<strong>and</strong> (SEQ) Water Grid, which will include theWCRW project. (Urban Water Supply Arrangement in South East Queensl<strong>and</strong> 2 )............................. 5LIST OF TABLESTable 1Table 2Table 3Number of <strong>water</strong> <strong>quality</strong> parameters required at each barrier to verify the treated <strong>water</strong> is ofa specified <strong>quality</strong> for its intended use............................................................................................. 11Organic parameters or indicators required to be measured at each barrier to indicate organicloadings........................................................................................................................................... 18Nutrient parameters or indicators required to be measured at each barrier in the WCRWproject.............................................................................................................................................. 21Table 4 Inorganic parameters required at each treatment barrier within the WCRW project........................ 23Table 5Heavy metal parameters required to be measured at each treatment barrier within theWCRW project................................................................................................................................. 24Table 6 Physicochemical parameters required to be measured at each barrier........................................... 26Table 7 Microbial parameters required to be measured in PRW closed loop system for each barrier ......... 27<strong>Current</strong> Online Water Quality Monitoring Methods <strong>and</strong> Their Suitability for the Western CorridorPurified Recycled Water SchemePage iv
EXECUTIVE SUMMARYThis report forms part of the Water Quality Monitoring Technology <strong>and</strong> Information CollectionSystem research project jointly undertaken by CSIRO <strong>and</strong> Griffith University under the Urban WaterSecurity Research Alliance. The report presents a broad overview of the current state of <strong>online</strong> <strong>water</strong><strong>quality</strong> <strong>monitoring</strong> systems from both research <strong>and</strong> commercial perspectives. It provides a summaryof commercially available <strong>methods</strong>, <strong>and</strong> details the strengths <strong>and</strong> limitations of existing <strong>online</strong><strong>monitoring</strong> technology for the purpose of real-time <strong>water</strong> <strong>quality</strong> <strong>monitoring</strong> within different treatmentbarriers of the Western Corridor Recycled Water (WCRW) scheme. There has been a shift towards<strong>online</strong> <strong>water</strong> <strong>quality</strong> <strong>monitoring</strong> in the WCRW scheme because of the new Queensl<strong>and</strong> RecycledWater Guidelines (QRWG), which specify that continuous or <strong>online</strong> analysers are preferred to discreteor grab sampling at critical control points (CCPs) to mitigate health hazards associated with the PRWscheme.The report briefly describes why <strong>online</strong> <strong>water</strong> <strong>quality</strong> <strong>monitoring</strong> is important to guarantee a consistentsupply of PRW, <strong>and</strong> also gives an overview of uses <strong>and</strong> applications of <strong>online</strong> <strong>monitoring</strong> tools for theWCRW project that can identify particular hazards <strong>and</strong> provide early warning of treatment failure or adecline in system performance. A summary of <strong>water</strong> <strong>quality</strong> parameters that are required to bemonitored at each treatment barrier is presented, along with details of ideal <strong>online</strong> analyserrequirements to obtain continuous, reliable <strong>water</strong> <strong>quality</strong> information.It was found that obtaining reliable low maintenance continuous <strong>online</strong> analysers for Barriers 1 <strong>and</strong> 2is problematic, <strong>and</strong> is a real challenge for commercial systems currently available due to the difficultnature of the measurement environment.In addition, due to the geographic separation of the PRW components <strong>and</strong> the diversified measurementconditions associated with each treatment barrier, a large number of widely separated instruments arerequired. Consequently, to obtain reliable <strong>online</strong> <strong>water</strong> <strong>quality</strong> information, it is recommended that<strong>online</strong> analysers must be capable of autonomous operation, especially at Barriers 1, 6 <strong>and</strong> 7. Theymust also be capable of maintaining <strong>their</strong> calibration status for lengthy periods <strong>and</strong> have acceptable(low) maintenance costs. The analysers must be resistant to biofouling, signal drift <strong>and</strong> blockages. Inaddition, the analytical performance must not be significantly affected by matrix interferences, so thatthe results can be directly used to optimise operational management procedures. For Barriers 1 <strong>and</strong> 2,biofouling <strong>and</strong> blockages are likely to be a major issue due to the harsh nature of the measurementenvironment. For Barriers 5-7 the analysers must have the resolution required to ensure compliance ofthe parameters measured with the Australian Drinking Water Guidelines (ADWG) <strong>and</strong> AustralianRecycled Water Guidelines (ARWG).During the review it became evident that most <strong>online</strong> analysers have difficulty obtaining continuous,accurate <strong>and</strong> cost-effective <strong>water</strong> <strong>quality</strong> information, as most were based on direct adaptations ofst<strong>and</strong>ard laboratory-based <strong>methods</strong>, which were not originally designed for field applications.Consequently, the <strong>online</strong> <strong>monitoring</strong> techniques/analysers available generally suffer from moreproblems than when used for laboratory-based analysis. Online systems require frequent calibration<strong>and</strong> maintenance, <strong>and</strong> may be prone to matrix interferences, biofouling, blockages <strong>and</strong> signal drift, asthey must operate in variable non-ideal measurement environments. Therefore, there are significanteconomic <strong>and</strong> logistics costs associated with maintaining the equipment, especially for remote<strong>monitoring</strong> locations. These factors have greatly limited the widespread application of <strong>online</strong>instrumentation, especially for large-scale remote <strong>water</strong> <strong>quality</strong> <strong>monitoring</strong>, since there is no costeffective <strong>online</strong> <strong>monitoring</strong> technology currently available that can operate autonomously for extendedperiods of time.In light of this, it is recommended that when selecting <strong>online</strong> analysers for the PRW system, specialcare should be taken to ensure that the analysers employed are appropriate for <strong>their</strong> intended use.<strong>Current</strong> Online Water Quality Monitoring Methods <strong>and</strong> Their Suitability for the Western CorridorPurified Recycled Water Scheme Page 1
1. AIM OF THE REVIEWThe aim of this report is to review <strong>methods</strong> currently available for <strong>online</strong> <strong>monitoring</strong> of environmental<strong>water</strong> <strong>quality</strong>, with specific applications to waste<strong>water</strong>, fresh <strong>water</strong> <strong>and</strong> purified recycled <strong>water</strong>(PRW). This report addresses: Water <strong>quality</strong> <strong>monitoring</strong> <strong>and</strong> sensing requirements for the PRW closed loop system; <strong>Current</strong> <strong>online</strong> <strong>water</strong> <strong>quality</strong> <strong>monitoring</strong> <strong>methods</strong>;Commercially available sensors <strong>and</strong> <strong>their</strong> <strong>suitability</strong> for the seven barrier approach; <strong>and</strong><strong>Current</strong> developments in <strong>online</strong> <strong>water</strong> <strong>quality</strong> technology that may have potential applications inthe WCRW project to further strengthen the baseline <strong>water</strong> <strong>quality</strong> <strong>monitoring</strong> practices.2. OVERVIEW OF THE PRW SYSTEMThe Western Corridor Recycled Water (WCRW) Scheme is designed to supplement the traditionalSouth East Queensl<strong>and</strong> (SEQ) fresh<strong>water</strong> supplies with purified recycled <strong>water</strong> (PRW). It isAustralia’s largest recycled <strong>water</strong> project <strong>and</strong> the Advanced Water Treatment Project is considered thethird largest project of its kind in the world. The WCRW project will deliver up to 232 ML/day ofPRW to power stations, industry, agriculture <strong>and</strong> the Wivenhoe Dam, which will be achieved using amulti-barrier treatment process to mitigate the hazards associated with <strong>water</strong> recycling. The closedloop PRW system will process raw waste<strong>water</strong> from 6 sewer catchments through a seven-barriertreatment process to produce PRW to supplement existing fresh<strong>water</strong> resources at Wivenhoe Dam(Figure 1). The WCRW project will form part of the SEQ <strong>water</strong> grid (see Figure 2).Figure 1 Schematic diagram of the Seven-Barrier treatment process employed in the WCRW Project(source: Queensl<strong>and</strong> Water Commission Fact Sheet 4 1 )<strong>Current</strong> Online Water Quality Monitoring Methods <strong>and</strong> Their Suitability for the Western CorridorPurified Recycled Water Scheme Page 4
The multi-barrier treatment process employed for the PRW scheme can only be effective when timelyinformation is available to determine if the <strong>water</strong> <strong>quality</strong> is fit for its intended use prior to it beingreleased to the next treatment barrier. This is to ensure that the treated <strong>water</strong> produced within eachbarrier of the supply chain complies from both a human health <strong>and</strong> environmental health perspective,under the Water Supply (Safety <strong>and</strong> Reliability) Act 2008 3 , to ensure a consistent safe supply of PRW.It is therefore essential that each stakeholder operating within each treatment barrier obtains theappropriate <strong>water</strong> <strong>quality</strong> information in real-time, to ensure the integrity of each barrier can bemaintained according to a Hazard Analysis Critical Control Point (HACCP) based managementapproach 3 . To achieve this, the Queensl<strong>and</strong> Recycled Water Guidelines (QRWG) recommend <strong>online</strong>or continuous analysers be employed for operational <strong>monitoring</strong>, in preference to discrete or grabsamples for Critical Control Points (CCPs), Quality Control Points (QCP) <strong>and</strong> Critical Measures (CM)that have been identified through HACCP 3 . This is to ensure that the recycled <strong>water</strong> produced withineach barrier is of a <strong>quality</strong> specified for its intended use, <strong>and</strong> to shift to a more preventativemanagement approach for the PRW system. If the <strong>monitoring</strong> is not continuous <strong>and</strong> non-conformanceis detected, the corrective action will have to be applied to all non-conforming recycled <strong>water</strong> since thelast sample was taken 3 . Therefore, a consistent supply of PRW can only be achieved effectively whencontinuous, real-time, accurate <strong>water</strong> <strong>quality</strong> information is employed for operational <strong>monitoring</strong>purposes.Figure 2 Schematic diagram of the South East Queensl<strong>and</strong> (SEQ) Water Grid, which will include theWCRW project. (Urban Water Supply Arrangement in South East Queensl<strong>and</strong> 2 )<strong>Current</strong> Online Water Quality Monitoring Methods <strong>and</strong> Their Suitability for the Western CorridorPurified Recycled Water Scheme Page 5
3. ONLINE WATER QUALITY REQUIREMENTS FOR THE WCRWSCHEMEAs the <strong>quality</strong> of PRW produced within the WCRW project should be consistent, irrespective ofseasonal, diurnal <strong>and</strong> temporal variations 3 , there are a number of <strong>water</strong> <strong>quality</strong> parameters that must bemonitored operationally to assess the treatment performance of each barrier. This means that reliable<strong>online</strong> measurements of critical <strong>water</strong> <strong>quality</strong> parameters that cover its microbial, physical <strong>and</strong>chemical properties are of high importance. They would also improve baseline <strong>water</strong> <strong>quality</strong><strong>monitoring</strong> strategies <strong>and</strong> assist operators <strong>and</strong> grid managers to maintain the integrity of each barrier.Online <strong>water</strong> <strong>quality</strong> <strong>monitoring</strong> tools are required that assist operators to:Identify non-conformance <strong>and</strong> implement corrective actions;Identify if particular hazards are compromising the system;Provide early warning identification of hazards that may cause system failure;Indicate CCP <strong>and</strong> Critical Operation Points (COP), or can be used as surrogate indicators. COPare used to control <strong>water</strong> quantity hazards, whereas CCP are used for controlling the <strong>quality</strong>associated with a health based hazard;Provide real-time trend analysis to indicate a decline in system performance;Identify false positive <strong>and</strong> false negative errors;Optimise treatment processes according to diurnal, seasonal <strong>and</strong> temporal variations, given thatthere may be a lack of suitable historical information available to operators;Identify cross connection or infiltration problems; <strong>and</strong>Assist trade waste operators to identify <strong>and</strong> track illegal discharges.In the transition to a closed loop PRW system, over 360 Indirect Potable Reuse (IPR) contaminants ofconcern have been identified, in addition to conventional parameters of importance. These can beclassified into the following categories: Organic Loads (with emphasis on BOD <strong>and</strong> COD) Suspended Solids Total Nitrogen Total Phosphorus Inorganics Heavy metals Physicochemical parameters Microbiological contaminant indicators, such as E. Coli Pesticides Endocrine Disrupting Compounds (EDCs) Radioactive materials Volatile Organic Carbons (VOC) <strong>and</strong> Trihalomethanes (THM) Haloacetic acids (HAA) Nitrosamines Pharmaceuticals.These parameters were identified based on a number of factors:Review of current scientific literature on reuse applications;Sewer catchment characterisation;Those which may affect the treatment processes within the Waste<strong>water</strong> Treatment Plant(WWTP) or the Advanced Water Treatment Plant (AWTP);Those which could be produced during the treatment processes;Those intentionally or incidentally designed to be removed within each barrier; <strong>and</strong>Those that may impair the <strong>quality</strong> of product <strong>water</strong> produced if the contaminants exceed theAustralian Drinking Water Guidelines 4 or Australian Recycled Water Guidelines 5 .<strong>Current</strong> Online Water Quality Monitoring Methods <strong>and</strong> Their Suitability for the Western CorridorPurified Recycled Water Scheme Page 6
The number of parameters per category that are required to be measured within each barrier to ensurethat treatment efficiency can be maintained is shown in Table 1.0. While it is difficult to monitor forall parameters, especially IPR contaminants of concern, it is highly recommended that specific hazardswhich may influence the final <strong>quality</strong> should be monitored continuously. In addition, <strong>online</strong> sensorsthat could be used as surrogate parameters for important contaminants that cannot be currentlymeasured in real-time would also be highly desirable. Therefore it is recommended that wherepossible, <strong>online</strong> <strong>monitoring</strong> of treated <strong>water</strong> should be instituted for all contaminants or indicators thatpose a human health risk 3 .The following section briefly describes each treatment barrier within the WCRW scheme <strong>and</strong> detailsideal <strong>online</strong> analyser requirements.Barrier 1Barrier 1 focuses on the control of industrial, commercial <strong>and</strong> residential source waste<strong>water</strong> enteringthe sewer catchment from a significant number of entry points. It is one of the most important barriers<strong>and</strong> it must be controlled effectively 3 , as production of high <strong>quality</strong> PRW is dependent on the <strong>quality</strong>of source <strong>water</strong> obtained from the sewer catchment.Therefore, <strong>online</strong> <strong>water</strong> <strong>quality</strong> <strong>monitoring</strong> technology required for Barrier 1 must be capable ofoperating:Reliably <strong>and</strong> accurately for prolonged periods of times;Robustly in a range of harsh measurement environments from industrial, commercial <strong>and</strong>residential sources, without being affected by matrix interferences; <strong>and</strong> Continuously <strong>and</strong> reliably in highly turbid environments where suspended solids concentrationsare high. Hence, <strong>online</strong> analysers employed in this barrier must be resistant to biofouling, signaldrift <strong>and</strong> blockages.It should be noted that obtaining reliable, low maintenance, continuous <strong>online</strong> analysis at this barrier isa real challenge using currently available commercial systems due to the complex nature of themeasurement environment.Barrier 2The WWTPs are responsible for the treatment processes associated with Barrier 2. These are existinginfrastructure <strong>and</strong> have been primarily designed for the removal of suspended solids, organic matter<strong>and</strong> nutrients. Treatment effectiveness has traditionally been monitored using parameters such asBiochemical Oxygen Dem<strong>and</strong> (BOD), Chemical Oxygen Dem<strong>and</strong> (COD), Total Nitrogen <strong>and</strong> TotalPhosphorous. Although there is only one entry <strong>and</strong> exit point to the WWTP, the measurementenvironment is still considered extreme <strong>and</strong> harsh for <strong>online</strong> analysers 6 due to the complexity of thesample matrix 7 . In addition, the treatment processes are exposed to ambient conditions <strong>and</strong> as aconsequence the analysers may also be influenced by environmental factors such as temperature <strong>and</strong>humidity 8 .To enable reliable <strong>and</strong> continuous <strong>online</strong> <strong>water</strong> <strong>quality</strong> information at this treatment barrier, <strong>online</strong>analysers must:Function in raw sewage influents of heterogeneous <strong>and</strong> variable compositions, with high <strong>and</strong>variable turbidity, nutrients, COD, BOD <strong>and</strong> suspended solids concentrations.Function in a treated waste<strong>water</strong> sample matrix, which has a significantly lower turbidity, COD,BOD, suspended solids <strong>and</strong> nutrient concentration.Function reliably irrespective of seasonal, diurnal <strong>and</strong> temporal variations, including widevariations in hydraulic flow.Be resistant to sensor biofouling <strong>and</strong> signal drift to ensure that calibration can be maintained.Calibration intervals must be at most daily, however longer periods of time would be preferred.Must be able to function adequately irrespective of sample matrix conditions, to reducemeasurement errors.<strong>Current</strong> Online Water Quality Monitoring Methods <strong>and</strong> Their Suitability for the Western CorridorPurified Recycled Water Scheme Page 7
Therefore <strong>online</strong> analysers that are prone to fouling, blockages, matrix interferences <strong>and</strong> signal driftmay not be suitable for this measurement barrier due to high costs associated with maintaininginstruments to obtain reliable data.Barrier 3Barrier 3 will use Micro-Filtration (MF), which is designed for the removal of viruses, bacteria <strong>and</strong>protozoa with a minimum log removal efficiency of 3 Log 10. If treatment is successful, it will thenbe used as the feed <strong>water</strong> to Barrier 4, Reverse Osmosis (RO). Online analysers used in Barrier 3 mustoperate reliably in a relatively closed measurement environment with one defined entry <strong>and</strong> exit point.The <strong>online</strong> analysers will have to function reliably at the inlet where there may be source <strong>water</strong>variations, <strong>and</strong> after subsequent pre-treatment steps will operate in a more controlled measurementenvironment than at Barrier 2.At Barrier 3, <strong>online</strong> analysers must have the following characteristics: Function reliably at the raw <strong>water</strong> inlet, in addition to the MF raw <strong>water</strong> <strong>and</strong> permeate. This isespecially important for Bundamba AWTP that will receive raw <strong>water</strong> from four WWTPswithin the scheme. Maintain <strong>their</strong> calibrated status irrespective of sample matrix conditions. For example, at theBundamba AWTP, analysers must be capable of functioning accurately in a changeablemeasurement environment, as the raw source <strong>water</strong> is derived from four different WWTPs. Operate reliably at low concentration levels.It is preferable for maintenance <strong>and</strong> calibration to be minimal, particularly as there are a number of<strong>online</strong> <strong>monitoring</strong> systems employed at this treatment barrier.Barrier 4Barrier 4 involves treatment using RO, which is designed to remove turbidity, organics, viruses,bacteria, <strong>and</strong> protozoa from the feed <strong>water</strong> through a molecular size exclusion process 9 . Once the ROpermeate is treated to the required specification it will be subject to Advanced Oxidation (AO) inBarrier 5 for the purpose of producing Class A + PRW. The <strong>online</strong> analysers operating in thismeasurement environment must be capable of reliable, high sensitivity measurements in a relativelyconsistent measurement environment, with one defined entry <strong>and</strong> exit point.Online analysers must have the following capabilities:Barrier 5Operate reliably in a high purity <strong>water</strong> matrix.Have adequate sensitivity for low level contaminants.It is imperative that sensors can function accurately <strong>and</strong> are capable of providing reliableinformation that can detect a decline in treatment performance or identify if a hazard iscompromising the system.Preferable for maintenance <strong>and</strong> calibration requirements to be minimal, as large numbers of<strong>online</strong> analysers are employed for operational <strong>monitoring</strong> purposes.Barrier 5 uses AO to produce <strong>water</strong> of a higher <strong>quality</strong> than conventional <strong>water</strong> treatment processes,<strong>and</strong> will remove trace organics, pathogens, viruses, <strong>and</strong> protozoa in addition to NDMA <strong>and</strong> 1,4-dioxane. The treatment process has one defined entry <strong>and</strong> exit point. Once the PRW has been treated<strong>and</strong> the <strong>water</strong> stabilised <strong>and</strong> disinfected, it will be transported through the western corridor pipeline fortreatment in the natural environment (Barrier 6). It is very important for Barrier 5 to maintain itsintegrity, <strong>and</strong> <strong>online</strong> analysers must be capable of reliable, continuous measurements to monitor the<strong>quality</strong> of PRW produced before it is released to Barrier 6.<strong>Current</strong> Online Water Quality Monitoring Methods <strong>and</strong> Their Suitability for the Western CorridorPurified Recycled Water Scheme Page 8
Online analysers operating within this barrier must have the following capabilities:They must function accurately <strong>and</strong> reliably so that they can adequately maintain barrier integrity<strong>and</strong> detect failure before PRW is released into the natural environment.Analysers used for pH dosing, disinfection <strong>and</strong> <strong>water</strong> stabilisation must be reliable <strong>and</strong>insensitive to matrix interferences, to ensure that effective dosing is maintained.Must be robust enough to operate reliably in a low ionic strength environment, irrespective ofenvironmental conditions.Preferable if maintenance <strong>and</strong> calibration requirements are minimal, as a large number of <strong>online</strong>analysers are employed for operational <strong>monitoring</strong> purposes.Barrier 6This comprises the second largest barrier within the supply chain of PRW in the WCRW project.Approximately 50-100 ML/day of PRW from 3 AWTPs will be delivered to Wivenhoe dam for aperiod of natural treatment. This treatment process involves retention in the dam for extended periodswhich will provide an additional environmental buffer to ensure the <strong>water</strong> is suitable for drinkingpurposes. The treatment barrier is open to the natural environment with a number of entry points, withPRW comprising one of the entry points. Hence the source <strong>water</strong> <strong>quality</strong> may vary depending on theinlet <strong>and</strong> environmental conditions such as high rainfall events.Online analysers in this barrier should be capable of the following:Capable of functioning autonomously for prolonged periods of time in remote, unattendedlocations.Capable of functioning accurately <strong>and</strong> reliably irrespective of sample matrix conditions, as thereare many sources of entry <strong>and</strong> the PRW will be blended with existing variable fresh<strong>water</strong>resources.As many of the sensors employed may be in situ, they need to maintain <strong>their</strong> calibrated statusfor extended periods.Sensors must be capable of operating reliably in high nutrient environments, especially in highrainfall events, without being prone to sensor fouling, signal drift or failure.Barrier 7The <strong>water</strong> treatment plant is the last treatment process in the PRW closed loop system. It will involvefiltration, pH adjustment <strong>and</strong> disinfection of blended PRW prior to distribution to residential,industrial <strong>and</strong> commercial entities in SEQ. Once the <strong>water</strong> has been used, it will be discharged intoBarrier 1 <strong>and</strong> the treatment process will commence once again. Online analysers must be capable ofreliable measurements to ensure the potable <strong>water</strong> produced is fit for human consumption according toADWG. In addition, if <strong>online</strong> analysers are installed in the distribution network, they must be capableof functioning:Autonomously for prolonged periods of time, as the distribution network covers an extendedgeographic area.Capable of responding accurately irrespective of climatic or environmental conditions such astemperature or changes in sample matrix.Must be able to maintain calibration in situ or <strong>online</strong> for prolonged periods of time with limitedmaintenance.Must have minimal occurrence of false positive <strong>and</strong> false negative events.Provide early warning on deteriorations in <strong>water</strong> <strong>quality</strong> irrespective of seasonal <strong>and</strong> diurnaltrends.Due to the wide geographic spread of the PRW project <strong>and</strong> diversified measurement conditions, alarge number of widely separated instruments are required. Consequently any <strong>online</strong> analysers mustbe capable of autonomous, reliable <strong>and</strong> accurate measurements, <strong>their</strong> calibration status must bemaintained at each barrier <strong>and</strong> they must have acceptable (low) maintenance costs.<strong>Current</strong> Online Water Quality Monitoring Methods <strong>and</strong> Their Suitability for the Western CorridorPurified Recycled Water Scheme Page 9
4. REVIEW OF EXISTING ONLINE MONITORING ANALYSERSOnline <strong>water</strong> <strong>quality</strong> <strong>monitoring</strong> is a rapidly advancing field due to a number of strong driversincluding those associated with global fresh<strong>water</strong> shortages. The scope of this review provides abroad overview of the current status of <strong>online</strong> <strong>monitoring</strong> systems from both a commercial <strong>and</strong>research perspective for the context of WCRW project. The following issues are discussed <strong>and</strong>addressed:<strong>Current</strong> performance of <strong>online</strong> analysers for continuous <strong>water</strong> <strong>quality</strong> <strong>monitoring</strong>;Future research directions <strong>and</strong> requirements to improve <strong>online</strong> analyser performance;Review of currently available commercial analysers <strong>and</strong> <strong>their</strong> <strong>suitability</strong> for each treatmentbarrier; <strong>and</strong> Review of current research <strong>and</strong> development pertaining to key <strong>water</strong> <strong>quality</strong> indicators.The review has aimed to evaluate the commercial sensors currently available from the key majorplayers based on <strong>their</strong> <strong>suitability</strong> for each barrier. Sensors have been classified according to <strong>their</strong>ability to address the analytical requirements for each barrier outlined as follows, based on the currentmanufacturers’ specifications:Ability to operate in the relevant sample matrix <strong>and</strong> environmental conditions;Ability to achieve the level of sensitivity required to monitor the treatment processes withineach barrier; Calibration <strong>and</strong> maintenance requirements for each barrier; <strong>and</strong> Type of method <strong>and</strong> its <strong>suitability</strong> for each barrier.It should be noted that the manufacturers’ specifications sometimes do not adequately reflect theactual performance of analysers in continuous, real-world measurement environments. Therefore, thisevaluation is based on the ideal performance characteristics of the analysers, as presented by themanufacturers. However, the common experience is that commercially available <strong>online</strong> analysersrequire frequent calibration <strong>and</strong> maintenance to enable continuous, reliable measurements overprolonged periods of time. Consequently, it is recommended that when <strong>water</strong> utilities are selectinganalysers for specific <strong>water</strong> <strong>quality</strong> <strong>monitoring</strong> purposes, they should thoroughly investigate theoperation <strong>and</strong> performance of the instruments to ensure that they are suitable for <strong>their</strong> intended usebased on the following factors:Economic costs associated with maintenance <strong>and</strong> calibration;Robustness to reliably <strong>and</strong> continuously operate in non-ideal environmental conditions;Ability to be linked with a centralised Supervisory Control <strong>and</strong> Data Acquisition (SCADA)system; <strong>and</strong>Ability to process data in real-time <strong>and</strong> provide accurate <strong>water</strong> <strong>quality</strong> information.It is recommended that <strong>water</strong> utilities should also engage with other <strong>water</strong> utilities that have employedparticular <strong>online</strong> analysers to obtain honest feedback on the instruments performance <strong>and</strong> reliability.<strong>Current</strong> Online Water Quality Monitoring Methods <strong>and</strong> Their Suitability for the Western CorridorPurified Recycled Water Scheme Page 10
Table 1Number of <strong>water</strong> <strong>quality</strong> parameters required at each barrier to verify the treated <strong>water</strong> is of a specified <strong>quality</strong> for its intended useWater Quality Indicators Classes Barrier 1 Barrier 2 Barrier 2/ 3 Barrier 3ROF = Reserves Osmosis Feed Water; ROP = Reverse Osmosis PermeatePlease note that for Barrier 6 the information was not made available to the project at the time the report was written.Barrier 4 (RO Feed <strong>and</strong>Permeate) Barrier 5 Barrier 6 Barrier 7Microbiological 4 4 7Inorganic Disinfection By-Products 5Metals 26 24 10 21 10Inorganic Anions 5 7 5 5Radionuclides 1 3Nutrients 5 8 5 5 4 3Organics 2 4 2 1 1Physical Parameters 4 8 5 1 5 6Physical Parameters Online Monitored 1 1 5 5 6 (ROF) <strong>and</strong> 1 ROP 7Phenolics 16 (ROF) 16Herbicides/Pesticides by LCMS 19 19Pesticides, Phenoxyacid Herbicides, Dalapon 11 11Pesticides - Glyphosate 2 2Pesticides - Haloacetic Acids 6 6Trihalomethanes 5 5 1Nitrosamines 5 5 5EDTA 1 1Endocrine Disrupting Compounds 12 12Pharmaceuticals 50 50PCBs <strong>and</strong> Dioxins 7Organochlorine Pesticides 32Pesticides, Organophosphorous 17Flow 1 (inlet) 1<strong>Current</strong> Online Water Quality Monitoring Methods <strong>and</strong> Their Suitability for the Western CorridorPurified Recycled Water Scheme Page 11
4.1 <strong>Current</strong> Online Water Quality Monitoring SystemPerformanceIn recent years <strong>online</strong> <strong>water</strong> <strong>quality</strong> <strong>monitoring</strong> technology has been rapidly exp<strong>and</strong>ing, with thespecific purpose of providing accurate <strong>and</strong> continuous <strong>water</strong> <strong>quality</strong> information for the protection ofnatural <strong>and</strong> man made fresh <strong>water</strong> supplies. For example, there are already commercially availablesystems on the market for parameters such as Fluoride 10 , Sodium 11 , pH 12 , Conductivity 13 , Redox 14 ,Ammonia 15 , Ammonium 16 , Chlorine 15, 17 , TOC 18 , Nitrate 19 <strong>and</strong> Dissolved Oxygen 20 . Some <strong>methods</strong>are based on electrochemical detection 10, 11, 21, 22 , with specific emphasis on voltametric <strong>and</strong>23, 24amperometric techniques, as well as Ion-Selective Electrodes (ISE) for parameters such asFluoride 10 , pH 12 <strong>and</strong> Sodium 11 . Other <strong>online</strong> <strong>monitoring</strong> systems are based on optical detectiontechniques 20 such as UV adsorption 15, 19, 25 with the majority employing colorimetric detectionprinciples 15, 25 (e.g. COD 25 , Ammonia 15 <strong>and</strong> Chlorine 15, 17 ).Online <strong>monitoring</strong> systems have the advantage over traditional laboratory-based <strong>and</strong> portable field<strong>methods</strong> in that they are capable of obtaining continuous measurement data autonomously for periodsof time, at the <strong>monitoring</strong> site of interest, without skilled staff being required to perform the analyses 26 .This is because sample collection <strong>and</strong> laboratory bench processes such as sample pre-treatment,calibration, reagent addition <strong>and</strong> sample analyses procedures have all been automated 26-30 . The <strong>water</strong><strong>quality</strong> information is usually transmitted to the <strong>water</strong> authority through <strong>their</strong> existing SCADAsystems. This eliminates the need for sample collection, preservation <strong>and</strong> transportation, <strong>and</strong> hencereduces costs.Real-time continuous measurements can be acquired by two main <strong>methods</strong>: <strong>online</strong>; <strong>and</strong> inline or insitu30 . Online measurements are in most cases based on automated laboratory-based measurementtechniques. The sample is usually injected using rotation valves or peristaltic pumps into theinstrument using Flow Injection Analysis (FIA) 29 or Sequential Flow Injection (SIA) techniques 29 , viaa separate analytical line which is connected to the main process stream 29, 30 . The sample is thenextracted, pre-treated if required <strong>and</strong> presented to the analytical instruments for the analyses required.This system can be either calibrated <strong>online</strong> automatically, or off-line by a skilled operator 30 . Onlineanalysers usually require a suitable temperature <strong>and</strong> pressure, fixed background measurementconditions <strong>and</strong> frequent calibration to obtain analytically valid results 30 .In-line analysers are simpler in design <strong>and</strong> can measure directly in the process line, using a probe thatis reasonably chemically insensitive 30 . However they are more susceptible to physical <strong>and</strong> chemicalinterferences from the sample matrix, as measurement backgrounds are more changeable <strong>and</strong> theyusually require ex-situ calibration.However, despite the ability to acquire continuous, real-time data, <strong>their</strong> widespread application hasbeen limited due to an inability to reliably obtain accurate, cost-effective <strong>water</strong> <strong>quality</strong> data 24, 26, 28, 31-33 .Online <strong>monitoring</strong> suffers from more problems than laboratory-based <strong>methods</strong> 8, 24, 28, 32 because to date,the majority of <strong>online</strong> <strong>monitoring</strong> technologies developed are direct adaptations of traditional,laboratory-based analytical <strong>methods</strong> 10-12, 15, 17, 23, 24, 34 , which were not originally designed for fieldapplications. Instead they are required to operate in extreme <strong>and</strong> variable measurement environmentswhilst still obtaining accurate <strong>and</strong> reproducible results 8, 26, 35 . Consequently, these <strong>methods</strong> requirefrequent calibration <strong>and</strong> maintenance 8, 23, 24, 26, 28, 33, 36 <strong>and</strong> often consume large quantities of chemicalreagents 26, 28, 37, 38 . They often require reagents such as st<strong>and</strong>ards <strong>and</strong> buffers which produce secondaryforms of pollution that require safe disposal. In addition the analysers often suffer from crossresponses due to matrix variations between the st<strong>and</strong>ards <strong>and</strong> samples analysed, as the measurementconditions are not controlled. There are also significant economic <strong>and</strong> logistics costs associated withmaintaining remote equipment, as it is difficult for operators <strong>and</strong> grid managers to detect problemssuch as sensor fouling.Another issue is that <strong>online</strong> analysers usually do not include a data processing element to provide ameasurement context for making decisions. For instance, this could incorporate:Hydraulic models, in order to underst<strong>and</strong> the dynamics of the <strong>water</strong> system <strong>and</strong> relationshipsbetween different <strong>water</strong> <strong>quality</strong> environments;<strong>Current</strong> Online Water Quality Monitoring Methods <strong>and</strong> Their Suitability for the Western CorridorPurified Recycled Water Scheme Page 12
Additional background information (referred to as metadata) to provide a measurement context,such as information concerning known changes in system performance including publicholidays, major system failure, calibration <strong>and</strong> maintenance events; <strong>and</strong> Historical information to assist in discerning what might have caused short-term or long-termchanges.If the <strong>online</strong> analysers are not capable of acquiring reliable, continuous <strong>water</strong> <strong>quality</strong> information, itcan lead to the following problems:Increased likelihood of false positive <strong>and</strong> false negative events;Decreased likelihood of detecting short <strong>and</strong> long-term deviations from baseline <strong>monitoring</strong>conditions; <strong>and</strong> Large volumes of redundant data being produced but not being useable for optimisingoperational processes.The problems associated with conventional <strong>online</strong> analysers stem from the fact that univariate linearcalibration models derived from Gauss’s theory of least squares are employed to determine unknownconcentrations 36, 39 . Therefore, the samples <strong>and</strong> st<strong>and</strong>ards must be measured with equal care, under thesame measurement conditions, to obtain reproducible <strong>and</strong> accurate results 36, 39 . Seeing that consistentmeasurement conditions are rarely present in the field, this invalidates the operating conditionsrequired for reliable performance, <strong>and</strong> causes a high degree of unreliability in the results from <strong>online</strong>instrumentation. Consequently, many <strong>water</strong> authorities need to frequently validate <strong>their</strong> <strong>online</strong> resultswith laboratory based or portable field instruments 24 . Therefore, it is recommended that care be takenwhen using these results to make critical management decisions.The cost associated with maintaining these conventional instruments has also greatly limited <strong>their</strong>widespread application, especially in regards to large-scale remote <strong>water</strong> <strong>quality</strong> <strong>monitoring</strong> in placeslike the European Union (EU) 31, 33, 40 . For example, the EU Water Framework Directive (WFD) isprobably the most significant piece of <strong>water</strong> protection legislation to be introduced on an internationalscale for many years 31, 40 . This directive takes a broad view of <strong>water</strong> management, <strong>and</strong> its keyobjective is the prevention of further deterioration of all <strong>water</strong> bodies. The successful implementationof the WFD will rely heavily on the <strong>monitoring</strong> programme, but will only achieve its full potentialwhen the <strong>online</strong> <strong>monitoring</strong> data is reliable, accurate <strong>and</strong> cost effective 31, 33 .The major problem with such <strong>water</strong> <strong>quality</strong> initiatives is that there is no cost effective <strong>online</strong><strong>monitoring</strong> technology currently available that can operate autonomously for extended periods oftime 26, 28, 32, 33, 41 . Consequently, the WDF has not m<strong>and</strong>ated any particular <strong>monitoring</strong> method. Itsimply provides a framework listing of <strong>water</strong> parameters that should be monitored 31, 33 , because thereare no agreed international st<strong>and</strong>ards or <strong>methods</strong> developed that allow for large-scale, <strong>online</strong>, reliable<strong>and</strong> cost-effective <strong>water</strong> <strong>quality</strong> information to be obtained 31, 33, 40 .In light of this, it is recommended that when selecting <strong>online</strong> analysers for the PRW system, specialcare should be taken to ensure the analysers employed are appropriate for <strong>their</strong> intended use.4.2 Overview of Measuring Principles of Commercially AvailableOnline Monitoring SystemsPhotometric SensorsPhotometric sensors are among the most commonly used measurement principles for <strong>online</strong> analysers.These <strong>methods</strong> are based on measuring the interaction of light with the sample <strong>and</strong> the measurementprinciple is usually based on Beer’s Law 7, 42-44 . They are often employed because of <strong>their</strong> simplicity<strong>and</strong> rapid response. The majority of commercially available photometric sensors fall into three maincategories: Colorimetric; UV Absorption; <strong>and</strong> UV-Visible Absorption. Optical sensors, such as nondestructivesensor arrays, also have the advantage over ISE (ion-selective electrodes) for <strong>water</strong> <strong>quality</strong><strong>monitoring</strong> in that gross fouling <strong>and</strong> potential problems or contamination can be detected by colourchanges in the sample 45 .<strong>Current</strong> Online Water Quality Monitoring Methods <strong>and</strong> Their Suitability for the Western CorridorPurified Recycled Water Scheme Page 13
ColorimetricThese are largely based on direct adaptations of APHA st<strong>and</strong>ard <strong>methods</strong> 103 , which use reagents toobtain desired complex ion formation to quantify the concentration at a specific wavelength. Theyrequire regular calibration with st<strong>and</strong>ard reagents using Beer’s law to maintain <strong>their</strong> calibrated <strong>online</strong>status.UV absorptionThe measurement principle is based on the specific absorption at a specified wavelength in theultraviolet range. They require conventional calibration according to Beer’s Law <strong>and</strong> st<strong>and</strong>ardreagents. For example, they include some turbidity sensors as well as a new type of DissolvedOxygen (DO) sensor 20 which employs a Light Emitting Diode (LED) to measure the DO concentrationinstead of using a conventional membrane based sensor.UV-Vis absorptionThis is based on semi-quantitative/selective information obtained from UV-Visible spectra. The<strong>methods</strong> usually employ pattern recognition techniques (PRT) to quantify the absorption profile <strong>and</strong>convert it to an equivalent concentration for the particular <strong>water</strong> <strong>quality</strong> parameter of interest. Itshould be noted that this method is only suitable for <strong>water</strong> <strong>quality</strong> parameters that have suitable UVabsorptionb<strong>and</strong>s (e.g. nitrate). Usually these <strong>methods</strong> do not require sample pre-treatment or dailycalibration at the <strong>monitoring</strong> site of interest. They are employed mainly because samples can beanalysed with very little sample preparation, no chemicals are required, <strong>and</strong> they have low operationalcosts. Such <strong>methods</strong> have been developed for <strong>monitoring</strong> Chemical Oxygen Dem<strong>and</strong> (COD), TotalOrganic Carbon (TOC), Biochemical Oxygen Dem<strong>and</strong> (BOD) <strong>and</strong> Nitrate.Ion Selective Electrodes (ISE)ISEs are commonly employed as <strong>online</strong> sensors due to <strong>their</strong> speed <strong>and</strong> simplicity, as well as lowmaintenance <strong>and</strong> purchase costs. With careful use, frequent calibration <strong>and</strong> ideal measurementconditions being maintained, they can achieve accuracy <strong>and</strong> precision in the order of 2-3%. Hence,in theory the configuration <strong>and</strong> embodiment of an ISE makes itan ideal sensing probe for on-site, realtime<strong>monitoring</strong> applications.Data obtained from <strong>online</strong> ISE measurements, although continuous, is usually semi-quantitative innature. This is because the analytical signal of the ISE is known to be affected by matrixinterferences, drift, contamination (e.g. by organic molecules), n<strong>online</strong>ar responses at the lower end ofdetection, <strong>and</strong> temperature in non-ideal measurement conditions. These factors in turn causemeasurement errors. To improve its reliability, especially in the field, an ISE must be regularlycalibrated with st<strong>and</strong>ards (e.g. every two hours) <strong>and</strong> samples should be analysed according toprescribed measurement conditions. However, the economic costs associated with calibration,especially for instruments that require ex-situ calibration with skilled personnel, have greatly limitedits adoption. This is especially the case in the <strong>water</strong> industry.4.3 Desirable Autonomous Water Quality Monitoring of WCRWSchemeIdeally, operators <strong>and</strong> grid managers require <strong>water</strong> <strong>quality</strong> instruments that are capable of operatingautonomously for prolonged periods of time. They should also be easy to operate <strong>and</strong> maintain, <strong>and</strong>use limited reagents, so that they are cost effective to implement for large-scale <strong>water</strong> <strong>quality</strong><strong>monitoring</strong> purposes 24, 26, 28, 32, 33, 40 . It is crucial that they are able to produce analytically valid results<strong>and</strong> can flag sensor faults 8, 24, 26 . This is required so that they can competently detect real system8, 24,problems, <strong>and</strong> so that the data is useful for managing <strong>water</strong> resources across large geographic areas26, 32, 33 , as is the case for the PRW scheme in SEQ. Hence, as the distribution networks of Barriers 1<strong>and</strong> 7 are very large, prolonged autonomous operation (i.e. for approximately 6 months) would bepreferred.The instruments should be robust <strong>and</strong> rugged, so that they are capable of operating in variable <strong>and</strong>extreme measurement conditions, whilst still maintaining <strong>their</strong> calibrated status 24, 26, 33, 41 . This isespecially important in Barriers 1 <strong>and</strong> 2 as the measurement environments are extreme. Therefore,<strong>Current</strong> Online Water Quality Monitoring Methods <strong>and</strong> Their Suitability for the Western CorridorPurified Recycled Water Scheme Page 14
sensors that are stable slow to drift <strong>and</strong> maintain <strong>their</strong> calibration are required. This is also the case forBarriers 6 <strong>and</strong> 7 as they can be still prone to sample matrix interference, signal drift <strong>and</strong> sensor foulingthat can produce measurement errors, despite the treated <strong>water</strong> being of a higher <strong>quality</strong> 23, 24, 30 . It iscrucial that the instruments are able to provide analytically valid results, so that any harmful eventscan be accurately detected, <strong>and</strong> the data is useful for managing <strong>water</strong> resources across largegeographic locations 26, 28, 33, 46 . They should also be easy to operate <strong>and</strong> maintain <strong>and</strong> use limitedreagents, so that they are cost effective to implement for large-scale <strong>water</strong> <strong>quality</strong> <strong>monitoring</strong>purposes 26, 28, 33, 37 . Essentially, <strong>online</strong>/in situ <strong>water</strong> <strong>quality</strong> <strong>monitoring</strong> sensors should be sufficientlyrobust to cope with changing environmental conditions <strong>and</strong> matrix interferences. They should also becapable of adequately <strong>monitoring</strong> changes in baseline performance that may indicate deterioration in<strong>water</strong> <strong>quality</strong>.4.4 Advanced Approaches to improve the <strong>suitability</strong> of OnlineInstruments for <strong>their</strong> intended purposeAdvances in materials science, microelectronics, miniaturisation, electro-optics, data analysis <strong>and</strong>computing power over the last two decades have enabled development of more robust <strong>and</strong> reliable<strong>online</strong> <strong>water</strong> <strong>monitoring</strong> systems 47 . In the following sections, approaches <strong>and</strong> advances associatedwith improving the performance of current <strong>online</strong> <strong>monitoring</strong> systems based on traditional analyticalprinciples are discussed.Improving Sensor SelectivityOne of the traditional approaches commonly employed to improve the reliability <strong>and</strong> accuracy of<strong>online</strong> <strong>water</strong> <strong>quality</strong> <strong>monitoring</strong> systems is to develop <strong>and</strong> synthesize more selective sensors 48-50 . Thisis because the majority of sensing surfaces suffer cross responses from interferences or are altered bythe sample matrix composition. This in turn affects the output of the sensing system <strong>and</strong> hence itsaccuracy 23, 28 . Accordingly, research scientists <strong>and</strong> technologists have focused on developing novelsensing materials 51 , colorimetric detection principles 43, 52 <strong>and</strong> even new measurement principles 22 .However, as research outcomes have indicated, it has been very difficult to develop an entirelyselective sensor that can operate in a diverse range of measurement conditions such as the WCRWproject. This is because the majority of new <strong>methods</strong> still require regular calibration according totraditional analytical practice.Improving Stability <strong>and</strong> Consumption of ReagentsAn integral part of current <strong>online</strong> <strong>monitoring</strong> systems is the use of st<strong>and</strong>ard reagents to ensure accuratefield calibration 24, 26, 36 . However, the lack of stability, volume of reagent consumption <strong>and</strong> economiccosts associated with these <strong>methods</strong> has greatly limited <strong>their</strong> widespread application 26, 32, 33, 40 . Forexample, reagents that contain sodium hypochlorite are unstable <strong>and</strong> require constant replenishing 37 .Hence, to address these issues <strong>and</strong> make current <strong>online</strong> instruments more economically viable,research <strong>and</strong> commercial endeavours have focused on improving the stability <strong>and</strong> reducingconsumption requirements of reagents.For long-term applications, researchers have developed more stable reagents 26, 28, 37 . For example,Sequeira <strong>and</strong> Diamond (1997) devised a technique to improve the reagent stability from two weeks toone year 37 in the indophenols method used for the analysis of ammonia. Alternatively, to reducereagent consumption a significant portion of research has centred on the miniaturisation of analyticaldevices 22, 27, 28, 41 . These devices are commonly referred to as “lab-on-chips” 26, 27 , “lab-on-cables” 27 ,“Micro Total Analytical Systems (TAS)” 47 or “Micro Electro Mechanical Systems (MEMS)” 47 , thatoperate on micro- <strong>and</strong> nanometre scales. They enable complex bench processes such as sampling,reagent addition, calibration, temperature control <strong>and</strong> analysis, to be incorporated into compact, lowpowered devices with fixed internal environments 26, 27 . Some examples are ammonia 37, 53 <strong>and</strong> ORP 54 .However, although they are beneficial in terms of reagent consumption, they are still prone toblockages 28 <strong>and</strong> the sensors must be continually calibrated to compensate for signal drift.<strong>Current</strong> Online Water Quality Monitoring Methods <strong>and</strong> Their Suitability for the Western CorridorPurified Recycled Water Scheme Page 15
Overcoming Matrix InterferencesBecause of the difficulty in developing highly selective <strong>online</strong> analysers, many suffer cross responsesfrom matrix interferences that can affect accuracy in the field. To overcome this problem, research<strong>and</strong> commercial endeavours have developed a number of new <strong>methods</strong> for coping with matrixinterferences in the field 23, 28, 36, 55, 56 . This has been achieved through sample pre-treatments such asfiltration, distillation, or the use of reagents for complexing <strong>and</strong> buffering the sample. Alternativeapproaches have tried to eliminate sample pre-treatment, which would make the <strong>methods</strong> more robust<strong>and</strong> cost-effective for applications such as the WCRW project. One example is ISEs that use majorion-interference compensation in an attempt to reduce sample pre-treatment costs <strong>and</strong> improve <strong>their</strong>accuracy 49, 57, 58 . This approach has been successfully demonstrated using ISE for Nitrate 49 ,Ammonium 57, 59 , Potassium 57, 60, 61 , Sodium 57, 60 , Chloride 62 , Bromide 62 , Hydroxide 62 <strong>and</strong> Fluoride 62 ,with commercially available sensors such as Ammonium 34 <strong>and</strong> Nitrate 63 introduced to the market inlate 2006. Although the method shows considerable potential as a simple means to cope with crossresponsesfrom interferences, it should be noted that in all examples strictly defined physicochemical48, 49,measurement backgrounds were required to obtain analytically valid results on synthetic samples57, 58, 60 . The performance of the method on real samples has not been adequately demonstrated in theliterature, with few examples of real sample analysis 49, 64, 65 . In addition, to compensate for signal drift,the sensors still require regular calibration in the field, which can increase maintenance costs.A contrasting approach that has been commercially implemented to improve the reliability <strong>and</strong>performance of <strong>online</strong> <strong>monitoring</strong> instruments has been to use st<strong>and</strong>ards designed to replicate thecomposition of the samples being measured. Successful commercial applications have already beendeveloped for fluoride 66 . This approach is effective because, as previously stated, most <strong>online</strong><strong>monitoring</strong> techniques require consistent measurement conditions between the st<strong>and</strong>ards <strong>and</strong> samplesmeasured. However, as the st<strong>and</strong>ard solutions replicate samples being measured, the technique is verylocation (matrix) specific <strong>and</strong> not suitable for process applications where the matrix is constantlychanging (as is the case for Barriers 1, 2, 6 <strong>and</strong> 7). Hence, it may not be an economically viableapproach for the WCRW applications, given the number of locations <strong>and</strong> the range of parametersrequired, especially when considering that the <strong>quality</strong> of raw sewage, treated waste<strong>water</strong> <strong>and</strong> surface<strong>water</strong> may vary greatly due to seasonal, temporal <strong>and</strong> geographic factors 64 .Simplification of CalibrationTo improve the operation <strong>and</strong> maintenance of the instruments <strong>and</strong> to increase <strong>their</strong> economic viability,research endeavours have focused on simplifying calibration methodologies. For example, oneapproach has been to reduce the number of points required for automatic calibration, resulting in areduction in reagent consumption <strong>and</strong> labour costs. However, this may not be readily adapted toexisting instruments as they are normally pre-programmed <strong>and</strong> most systems cannot autonomouslydetect signal drift to determine when recalibration is required. Alternatively, a recent commercialadvance has seen the development of sensors with disposable pre-calibrated cartridges that can bereplaced half yearly or yearly 34, 67 . An example of this is the Hach-Lange dissolved oxygen (DO)sensor 67 .However, despite the attempts to improve <strong>their</strong> economically viability by simplifying calibration,<strong>online</strong> analysers are still fundamentally affected by sample matrix effects, which can make it difficultto obtain continuous, reliable measurements in the field. Therefore, most field analysers still requireregular maintenance to guarantee <strong>their</strong> reliability.Reducing Sample Pre-TreatmentIn recent years, an alternative <strong>and</strong> promising approach to reduce requirements for sample pretreatmenthas emerged in the development of Software Sensors 55, 68 such as Electronic Tongues (E-Tongues) 59, 64, 69, 70 , Electronic Noses (E-Noses) 56, 64, 71 , or Spectral Finger Printing 7, 44, 65, 72-74 . Thesesoftware sensors use a signal obtained from a readily available, fast <strong>and</strong> reliable device such as a UV-Visible Spectrophotometer or an electrochemical sensor <strong>and</strong> then determine the <strong>water</strong> <strong>quality</strong>parameter of interest (e.g. BOD 5 or COD) using mathematical signal processing tools such as partialleast squares 44, 75, 76 or Artificial Neural Networks (ANNs) 44, 73, 76 . This has been made possible by themassive increase in cheap computing power. The most significant advantage of a software sensor is<strong>Current</strong> Online Water Quality Monitoring Methods <strong>and</strong> Their Suitability for the Western CorridorPurified Recycled Water Scheme Page 16
that it can h<strong>and</strong>le more than one response, which is not the case for traditional <strong>online</strong> analysers basedon simple linear regression. E-tongues are the most common software sensor employed in <strong>water</strong><strong>quality</strong> <strong>monitoring</strong>. They are based on an array of semi-selective or non-selective sensors that whenmeasured simultaneously can be used to classify <strong>and</strong> in some cases quantify complex aqueous samplesusing pattern recognition techniques (PRT) 47, 49, 64, 65, 77 . This method is unique in that it tries to avoidthe need to separate the analyte from the complex sample matrix before it is analysed. The softwaresensor approach diverges from the traditional analytical concept in which one, highly-selective sensoris used to indicate change in one parameter in a complex aqueous sample.Sensor Fouling <strong>and</strong> FailureThe ability to overcome sensor fouling <strong>and</strong> detect sensor failure is extremely important to ensure thatcontinuous <strong>and</strong> reliable <strong>water</strong> <strong>quality</strong> information can be obtained. It also can assist to reduce thenumber of false positive <strong>and</strong> false negative events recorded by the sensor. Methods for overcomingfouling include: Self cleaning sensors; Frequent maintenance; Positioning of sensor <strong>and</strong> <strong>online</strong> analyser design; <strong>and</strong> Flow rate.Methods for overcoming failure include:Employing multiple sensors;Signal processing techniques; <strong>and</strong>Operator maintenance checks.Other IssuesTo ensure that <strong>online</strong> analysers will be a valuable operational process <strong>and</strong> control tool for the PRWclosed loop system, it is imperative that the information obtained is accurate so it can be used to assistoperators/grid managers in optimising <strong>and</strong> improving <strong>water</strong> <strong>quality</strong> management strategies. A recentreview by O’Halloran et al. (2008) highlights that <strong>online</strong> <strong>water</strong> <strong>quality</strong> information must alsoencompass a measurement context to be effective for management purposes 8 . The report raised thefollowing points that should be incorporated to improve current <strong>online</strong> <strong>water</strong> <strong>quality</strong> <strong>monitoring</strong>practices used by the <strong>water</strong> industry:Metadata Information. It is important to collect additional background information (referred toas metadata) concerning other factors that will affect the PRW system <strong>and</strong> sensors. This wouldinclude information on system-wide events such as public <strong>and</strong> school holidays, major systemupsets, severe weather events, major changes in <strong>water</strong> source or treatment, as well asinformation related to individual sensors such as maintenance <strong>and</strong> calibration. This metadatawould need to be supplied <strong>and</strong> regularly updated by the relevant authorities. This informationaids in the identification, detection <strong>and</strong> assessment of events <strong>and</strong> also ensures that the <strong>online</strong>information can be stored <strong>and</strong> retrieved correctly 8 .Hydraulic information. Hydraulic flow information is important to assess how <strong>water</strong> <strong>quality</strong>might be changing between <strong>online</strong> sampling locations, to detect potential problems <strong>and</strong> optimisedosing procedures 8 .5. COMMERCIALLY AVAILABLE SENSORS – SUITABILITY FORWCRW PROJECTA number of commercial sensors potentially suited to the WCRW project have been reviewed in thefollowing sections. This list is by no means comprehensive, however it showcases a range ofcommercially available <strong>online</strong> analysers produced by key market players <strong>and</strong> details <strong>their</strong> <strong>suitability</strong>for each treatment barrier (see Appendix 1). As evident from the literature review, the field of <strong>online</strong><strong>water</strong> <strong>quality</strong> <strong>monitoring</strong> is rapidly exp<strong>and</strong>ing <strong>and</strong> still requires further advancements. The followingassessment is based on the manufacturers’ guidelines <strong>and</strong> does not necessarily reflect the instruments’<strong>Current</strong> Online Water Quality Monitoring Methods <strong>and</strong> Their Suitability for the Western CorridorPurified Recycled Water Scheme Page 17
eliability for continuous <strong>water</strong> <strong>quality</strong> <strong>monitoring</strong> within each barrier in the PRW system. It onlyprovides recommendations based on researchers’ <strong>and</strong> industry experience with <strong>online</strong> analysers.5.1 Organic Load IndicatorsOnline parameters that can indicate the organic load of the <strong>water</strong> source are essential to ensure theintegrity of all barriers within the PRW closed loop system. This is primarily because the PRW isdesigned to remove organic matter from the waste<strong>water</strong> to produce high purity drinking <strong>water</strong>. Inaddition, organic levels in Barriers 6 <strong>and</strong> 7 can cause disinfection by-product formation, <strong>and</strong> <strong>their</strong>presence is also used as a surrogate to indicate microbial contamination 4, 78 .Table 2loadingsOrganic parameters or indicators required to be measured at each barrier to indicate organicParameter B1 B2 B3 B4 B5 B6 B7 CommerciallyAvailableBOD 5 √ √ YesCOD √ √ YesTOC √ √ √ YesDOC √ √ YesSuspendedSolids√ √ √ √ YesTurbidity √ √ √ √ √ √ √ YesCommercially Available SensorsTable 2 lists the parameters required to be measured at each barrier to indicate organic loadings.<strong>Current</strong>ly there are <strong>online</strong> sensors available for <strong>monitoring</strong> all of these parameters; however <strong>their</strong><strong>suitability</strong> for Barriers 1, 2 <strong>and</strong> 2/3 is questionable due to the variability in the matrix composition (seeAppendix 1 for more information).BOD 5There are a number of instruments commercially available: those which use various means to measurethe oxygen respiration rate of sewage sludge, <strong>and</strong> those based on chemometric algorithms to estimateBOD from UV-visible absorption. Some examples are given below:AppliTek Ra-BOD® On-line BOD analyzerDirect BOD measurement using respiration rate (mgO 2 /l.h) of sludge from the WWTPEndress+Hauser Biox-1010This rapidly measures BOD 5 from the dilution factor required to keep the DO level constant in a small<strong>online</strong> bioreactor fed by waste<strong>water</strong> diluted with air saturated <strong>water</strong>.Advantages: Has a high measuring range; <strong>and</strong> Does not require chemicals.Disadvantages: Requires sample conditioning.s::can; Endress+Hauser StipscanThese employ UV-Vis absorption <strong>and</strong> chemometric algorithms to quantify BOD 5 non-destructively inreal-time. They use the spectral absorbance values around 250-380 nm to indirectly quantify BODusing UV-Vis absorption patterns.<strong>Current</strong> Online Water Quality Monitoring Methods <strong>and</strong> Their Suitability for the Western CorridorPurified Recycled Water Scheme Page 18
Advantages: Sample acquired in-line with limited pre-treatment; <strong>and</strong> Can rapidly determine concentrations in a non-destructive manner.Disadvantages: Method is not direct <strong>and</strong> hence is matrix dependent. This can lead to measurement errors ifmatrix changes substantially; <strong>and</strong> May require frequent calibration if matrix composition continually changes e.g. every twoweeks if system has not been developed on <strong>monitoring</strong> site in question. Works best if the<strong>monitoring</strong> site of interest has been incorporated into its data training base, <strong>and</strong> has turbidity
Advantages: Sample can be acquired with limited sample pre-treatment; Rapidly determines concentration on very small sample aliquots; <strong>and</strong> Very accurate compared to st<strong>and</strong>ard method, especially below 20 mg/L.Disadvantages: It employs measurements in a microfluidic environment. Therefore the sample chamber may beprone to blockages. This may be especially for Barriers 1, 2 <strong>and</strong> 6, which are moreheterogeneous <strong>and</strong> variable in nature.Suitability:Barrier 1, 2, 6 – s::can, Stipscan, Phoenix.Barrier 2 at clarifier, Barriers 3, 4, 5, 7- PeCOD, Phoenix.Total Organic Carbon (TOC) (including dissolved organic carbon, DOC)There are a number of <strong>online</strong> TOC analysers available, for example: Hach: High temperature oxidation; Greenspan: Non-dispersive IR; Endress+Hauser:- EZ TOC uses UV- supported low temperature oxidation;- STIP-toc uses high temperature catalytic oxidation;- STIP-scan uses UV-Vis Spectral absorbance patterns combined with chemometricalgorithms; Mettler Toledo: UV oxidation; <strong>and</strong> s::can: uses UV-Vis Spectral absorbance patterns combined with chemometric algorithms.All <strong>methods</strong> are suitable for analysing samples continuously as long as the sample is relativelyconsistent <strong>and</strong> is not too turbid. Most calibration is performed either automatically or off-line. If thematrix constantly changes the analyser may require more frequent calibration, consume more reagents<strong>and</strong> require more maintenance to ensure valid measurements are obtained. This is because apart froms::can <strong>and</strong> STIP-scan, the TOC analysers have been based on laboratory <strong>methods</strong> that have beenmodified for <strong>online</strong> applications. Therefore they are best employed after sample pre-treatment tominimise maintenance <strong>and</strong> labour costs associated with the analysers that may be affected by achangeable sample matrix.Recommended: Barriers 3, 4, 5 <strong>and</strong> 7.TurbidityThere are many commercially available turbidity analysers on the market that are suitable for<strong>monitoring</strong> in most barriers of a closed loop PRW system (see Appendix 1 for more information).However, as turbidity measurements are based on optical principles, the current in situ sensors may beprone to fouling in the more extreme <strong>and</strong> changeable conditions at barriers such as 1 <strong>and</strong> 2. Therefore,the sensor position, type of sensor, flow cell design <strong>and</strong> signal drift <strong>and</strong> calibration will need to beaddressed for these more difficult barriers.Recommended: Barriers 3, 4, 5, 6 <strong>and</strong> 7 in its current form.Suspended SolidsThere are a number of commercially available sensors for <strong>monitoring</strong> suspended solids that aresuitable for the PRW system, e.g:Hach: LED probe.Endress+Hauser: UV-Vis spectral absorbance sensor.Greenspan: Photometric sensor.<strong>Current</strong> Online Water Quality Monitoring Methods <strong>and</strong> Their Suitability for the Western CorridorPurified Recycled Water Scheme Page 20
These sensors are once again based on the non-destructive interaction of light with the sample <strong>and</strong> useoptical measurement principles. However the sensors still require regular calibration to control signaldrift. As the sensors are optically based, they may be prone to fouling in the more extreme <strong>and</strong>variable barriers such as 1 <strong>and</strong> 2. Therefore, the sensor position, type of sensor, calibrationrequirements <strong>and</strong> flow cell design will need to be addressed for these more difficult barriers.Recommended: Barriers 3, 4, 5, 6 <strong>and</strong> 7 in <strong>their</strong> current form.5.2 NutrientsThe reduction of nutrients from the sewer catchment source <strong>water</strong> is of primary importance to ensureproduction of high <strong>quality</strong> PRW. Therefore, it is necessary to measure the reduction of thesecompounds through Barriers 1-5 to ensure treatment processes are meeting design specifications aswell as complying with the license agreements of the WWTP <strong>and</strong> AWTP. This can only be achievedif continuous <strong>monitoring</strong> of nutrients is included, as they have been identified as a PRW contaminantof concern. This is especially important at Barrier 6, to ensure nutrient levels in the PRW aredischarged at a rate that can be assimilated by the natural environment in Lake Wivenhoe.Table 3 sets out the nutrient parameters that must to be measured at each barrier in the WCRW project.There are a number of commercially available sensors on the market that are claimed to measure theseparameters accurately.Table 3projectNutrient parameters or indicators required to be measured at each barrier in the WCRWParameter B1 B2 B3 B4 B5 B6 B7 Commercially AvailableTotal Nitrogen √ √ √ √ √ √ YesTotal Phosphorus √ √ √ √ √ √ YesNitrate √ √ √ √ √ √ YesNitrite √ √ √ √ √ √ YesOrthophosphorus √ √ √ √ YesOrganic Nitrogen √ √ YesAmmonia √ √ √ √ √ YesNitrogenGreenspan: total nitrogen - Colorimetric; Nitrate - Ion-selective Electrode.Hach: Nitrogen/ammonia – colorimetric.Endress+Hauser: Nitrate – UV-Vis.YSI: Nitrate - Cadmium Reduction/Diazotization.s::can: Nitrate – UV-Vis.From the review of commercially available <strong>online</strong> sensors:The colorimetric, ISE <strong>and</strong> Cadmium Reduction/Diazotization <strong>methods</strong> require frequentcalibration <strong>and</strong> consume reagents. The reagents are usually only stable for ca. 1 month beforethey require replacement.ISE membranes may by be prone to fouling in Barrier 1-2 (especially if PVC based) due to highnutrient content of <strong>water</strong> compared to drinking <strong>water</strong>. This may also be the case in Barrier 6due to the number of other <strong>water</strong> inlets to Wivenhoe dam.UV-Vis measurements can be performed without sample pre-treatment. However, optical-basedmeasurements will be prone to measurement errors in Barriers 1 <strong>and</strong> 2 due to changes inturbidity levels. For example, a study by Fogelman et al. (2006) 7 , found measurements ofsewage influent can be impaired if turbidity > 150 NTU.<strong>Current</strong> Online Water Quality Monitoring Methods <strong>and</strong> Their Suitability for the Western CorridorPurified Recycled Water Scheme Page 21
Overall, the assessment of these <strong>online</strong> sensors indicated that most are suitable for use in the PRWsystem after the clarification step in Barrier 2. However, as most <strong>online</strong> measurements are based ondirect adaptations of st<strong>and</strong>ard <strong>methods</strong>, frequent calibration <strong>and</strong> maintenance will be required toensure that reliable measurements are obtained. The frequency will depend on the nature of thesample <strong>and</strong> its complexity <strong>and</strong> the stability <strong>and</strong> reliability of each sensor in the measurementenvironment.Recommended: For Barriers 3, 4, 5 <strong>and</strong> 7.Note: care should be taken to ensure that maintenance <strong>and</strong> calibration requirements are considered foreach particular measurement environment. It must also be economically viable to implement inremote areas to make <strong>online</strong> <strong>monitoring</strong> cost-effective for the WCRW project.Phosphorus Hach: Orthophosphate-Colorimetric. Endress+Hauser: Phosphorus- Colorimetric. Greenspan: Colorimetric.The <strong>online</strong> analysers used to monitor phosphorus are based on direct adaptations of the st<strong>and</strong>ardlaboratory-based analytical <strong>methods</strong>. Therefore, they require frequent calibration as well as a regularsupply of reagents to form the complex ion required for detection. The stability of the reagents <strong>and</strong>maintenance requirements of the instruments must also be determined to ensure they are economicallyviable to implement <strong>and</strong> maintain. If frequent calibration is required, the instrument will consumemore reagents, especially in changeable <strong>and</strong> complex measurement environments such as at Barriers 1,2 <strong>and</strong> 2/3.Recommended: For Barriers 2/3; <strong>and</strong> with care for 4, 5 <strong>and</strong> 6.AmmoniaAmmonia is an important parameter as it is an indicator of treatment efficiency. If NH 3 concentrationsare higher than the operational design specification, it can indicate possible contamination with rawsewage <strong>and</strong> high microbial levels. This is of paramount importance in Barrier 7 to ensure continuoussafe supply of IPR to SEQ residents. The ADWG guideline requirement is 0.5 mg/L, <strong>and</strong> in Barrier2/3 a specification of less than 7.5 mg/L is required.<strong>Current</strong>ly there are few commercially available sensors on the market that can reliably achieve thesensitivity required for these treatment design specifications. Hach: Ammonia/Nitrogen – Colorimetric; Ammonia/Ammonium – Colorimetric. YSI: Ammonia – Ion Selective Electrode. Endress+Hauser: Ammonia- Colorimetric. Greenspan: Ammonia- Ion-Selective Electrode. s::can: Ammonia- Ion-Selective Electrode.All of these analysers are suitable for Barriers 2/3. If the detection limit required is below the0.5 mg/L ADWG value, it is recommended Hach or Endress+Hauser be used. This is because theinstrument specifications are more sensitive <strong>and</strong> ammonia is often used as a surrogate to indicate thepresence of microbial or sewage contamination 4 . However, care should be taken with these analysersfor the following reasons:Ammonia/Ammonium ISE are PVC membrane based sensors that are prone to fouling. Inaddition they require additional reagents for sample pre-treatment. Therefore frequentcalibration with st<strong>and</strong>ard reagents may be required to maintain accurate field measurements.Colorimetric <strong>methods</strong> work well, however there are reagent stability issues for those that useindophenols, as the hypochlorite ion is unstable 37 . Therefore it increases the maintenance costsassociated with the method.Sensors need to operate autonomously in changeable measurement environments.<strong>Current</strong> Online Water Quality Monitoring Methods <strong>and</strong> Their Suitability for the Western CorridorPurified Recycled Water Scheme Page 22
5.3 Inorganic parametersThere are a number of inorganic ions that are required to be monitored in the PRW system to ensurethat its integrity is maintained. For example, fluoride is measured because it is an IPR contaminant ofconcern <strong>and</strong> may pose a health risk if not treated appropriately, whereas alkalinity needs to bemonitored as it is a COP point in Barrier 5 for <strong>water</strong> stabilisation <strong>and</strong> a critical point that may have animpact on Barrier 6. There are also additional parameters that need to be measured for compliance<strong>monitoring</strong> purposes. The inorganic parameters required to be measured at each treatment barrierwithin the WCRW project are listed in Table 4.Table 4Inorganic parameters required at each treatment barrier within the WCRW project.Parameter B1 B2 B3 B4 B5 B6 B7 CommerciallyAvailableSodium √ √ √ √ YesPotassium √ √ √ √ YesFluoride √ √ YesCalcium √ √ √ √ YesIodide √ √ √Silica √ √ √CyanideAlkalinity √ √ √ √ YesSulphate √ √ √ √Chloride √ √ √ Yes<strong>Current</strong>ly there are <strong>online</strong> commercially available sensors for most of these parameters, e.g: Hach: Alkalinity - colorimetric; sodium - ISE; Hardness (CaCO 3 ) – colorimetric; Fluoride ISE.There are other companies that also produce these <strong>online</strong> sensors. However it should be noted thatcurrently they are all based on st<strong>and</strong>ard laboratory <strong>methods</strong>. Therefore, these systems require frequentcalibration <strong>and</strong> regular maintenance, especially in Barriers 2, 3, 6 <strong>and</strong> 7 where the sample matrix canbe more changeable. Barrier 1 may also be problematic due to the nature of the sewer network <strong>and</strong>highly turbid nature of the samples.Recommended: - Sodium analyser for Barriers 4 <strong>and</strong> 5.- Fluoride analyser for Barriers 5 <strong>and</strong> 7 (when fluoride is introduced into the SEQ<strong>water</strong> grid).Research <strong>and</strong> DevelopmentElectronic tongues offer a potential option for <strong>monitoring</strong> inorganic ions simultaneously <strong>and</strong> mayeliminate the need for multiple analysers. For example, Rudnitskyaya et al. (2001) 58 demonstrated thefeasibility of using an electronic tongue based on non-specific potentiometric sensors to determinesodium, chloride <strong>and</strong> calcium in addition to some heavy metals such as copper <strong>and</strong> zinc, with limitedsample pre-treatment being required. Guttierrez et al. (2008) 79 demonstrated using an electronictongue for measuring calcium, sodium <strong>and</strong> potassium, in addition to ammonium <strong>and</strong> nitrate ions. Thiscould be an option for <strong>online</strong> analysis in the future, which would reduce the number of analyserswhilst maximising the number of parameters that could be determined. This approach couldsignificantly reduce the costs <strong>and</strong> maintenance presently associated with <strong>online</strong> <strong>monitoring</strong>. However,issues associated with membrane fouling, signal drift <strong>and</strong> matrix interferences may still need to beaddressed, as the PRW system encompasses a diverse range of <strong>monitoring</strong> environments.√<strong>Current</strong> Online Water Quality Monitoring Methods <strong>and</strong> Their Suitability for the Western CorridorPurified Recycled Water Scheme Page 23
5.4 Heavy MetalsBecause the WCRW project is producing PRW from treated waste<strong>water</strong>, the need for rapid <strong>and</strong>continuous <strong>online</strong> sensors for heavy metal analysis is becoming more important. To mitigate the risksassociated with a PRW closed loop system, a number of heavy metal IPR contaminants have beenidentified that must be monitored to ensure the <strong>quality</strong> of recycled <strong>water</strong> produced in each treatmentphase meets the required st<strong>and</strong>ard (Table 5). In addition, from Barrier 3 onwards the levels of IPRheavy metals are recommended to be below, <strong>and</strong> after Barrier 5 must be below, AWDG <strong>and</strong> ARWGlimits 80 . Therefore, this means that <strong>online</strong> sensors must have an adequate range <strong>and</strong> sensitivity forheavy metal concentrations found in Barrier 2, <strong>and</strong> sufficient sensitivity to detect changes below1 mg/L in Barriers 5-7.Table 5projectHeavy metal parameters required to be measured at each treatment barrier within the WCRWParameter B1 B2 B3 B4 B5 B6 B7Arsenic √ √ √ √ √Antimony √ √ √ √Barium √ √ √ √ √Beryllium √ √ √Boron √ √ √ √ √ √Cadmium √ √ √ √Chromium √ √ √ √Cobalt √ √ √Copper √ √ √ √Lead √ √ √ √Lithium√Magnesium √ √ √ √Manganese √ √ √ √ √ √Nickel √ √ √ √Selenium √ √ √ √ √Silver√Strontium √ √ √ √Zinc √ √ √ √Tin√Mercury √ √ √ √ √Molybdenum √ √ √ √Vanadium √ √ √Aluminium √ √ √ √ √Iron √ √ √ √ √ √<strong>Current</strong> Online Water Quality Monitoring Methods <strong>and</strong> Their Suitability for the Western CorridorPurified Recycled Water Scheme Page 24
The majority of analytical <strong>methods</strong> which are used to measure heavy metals are only suitable forlaboratory use: Atomic Absorption Spectroscopy (AAS); Inductively Coupled Plasma MassSpectrometry (ICP-MS); Graphite Furnace Atomic Adsorption Spectroscopy (GFAAS); <strong>and</strong> NeutronActivation Analysis (NAA) 81 . The high costs associated with maintenance, separation <strong>and</strong> extractionmake these techniques unsuitable as <strong>online</strong> <strong>monitoring</strong> tools. 82There are only a few <strong>online</strong> techniques available that can measure heavy metals in a continuous <strong>and</strong>cost-effective manner that would be suited to the WCRW project: Hach: Copper- Colorimetric. AppliTek: Zinc, Cadmium, Lead, Arsenic, Mercury, Iron <strong>and</strong> Chromium - Anodic StrippingVoltammetry. SensAqua A/S: Copper, Zinc, Mercury, Iron, Lead, Cadmium - Voltammetry.The AppliTek <strong>and</strong> SensAqua A/S are relatively new on the market, <strong>and</strong> these analysers are still in theprocess of being fully commercialised. Alternatively, Hach copper analysers can be used <strong>and</strong> givesatisfactory results, provided that they are calibrated <strong>and</strong> maintained regularly.Research <strong>and</strong> DevelopmentTo further develop this field, research into in situ measurements of heavy metals is becoming a highpriority 82 . Once again, as it is not economically feasible to monitor for every heavy metal required,development of an <strong>online</strong> analytical tool that could measure several key heavy metals or which couldindicate other key contaminants would be highly desirable. <strong>Current</strong>ly, there are two main researchapproaches available that may be suitable for the WCRW project.Voltammetric sensors are promising c<strong>and</strong>idates for real-time, simultaneous measurements, as they canacquire continuous information with minimal or limited sample pre-treatment 82 . For example, Xie et al(2004) used microelectrode E-tongue arrays based on voltammetry to determine heavy metals in<strong>water</strong>; the sensor array was based on non-selective sensors to develop a pattern 83 . Zhu et al. (2006)used a microelectrode array to determine Zn 2+ , Cd 2+ , Pb 2+ , Cu 2+ , Fe 3+ , Cr 3+ 84 . From the literaturereview, there were several potentiometric sensors <strong>and</strong> biosensors that may also be viablealternatives 85, 86 .However, the following factors should be taken into account when developing electronic tongues orbiosensors for the WCRW project.Need for rugged reference electrodes that reduce the risk of contamination from diffusionthrough liquid junctions 82 . This is important if the sensors will be used in situ, to mitigate anyrisk associated with contamination especially if the sensors may contain IPR contaminants ofconcern (e.g. mercury).Biofouling of membranes may impair the analytical signal obtained. This is a major concern inBarriers 1, 2 <strong>and</strong> 6, where the sample matrix is constantly variable. In addition the waste<strong>water</strong>in Barrier 1 <strong>and</strong> at the sample inlet to Barrier 2 has very high microbial <strong>and</strong> organic loads,which make membrane based sensors extremely vulnerable to biofouling.Because E-tongues are based on multiple sensor arrays, signal drift is difficult to overcome, asthe algorithms or patterns developed by the sensor arrays are represented in a higherdimensional search space. Therefore, improved data analysis techniques to make them suitablefor long-term deployment would be highly valuable.There is a requirement to account for environmental variations to correct changes in sensorsignal attributed to matrix interferences. Sensors that are calibrated based on traditionalanalytical principles require fixed measurement conditions, which are usually not obtained infield measurements.Minimise consumption requirements of reagents, so that they can be suitable for remote<strong>monitoring</strong>. The economic costs associated with reagent stability, calibration <strong>and</strong> maintenancewill greatly limit <strong>their</strong> widespread application.Incorporate hydraulic <strong>and</strong> metadata information into data processing for <strong>online</strong> systems toensure that <strong>water</strong> <strong>quality</strong> information collected in real-time has a measurement context, whichcan be used to improve/optimise management decisions.<strong>Current</strong> Online Water Quality Monitoring Methods <strong>and</strong> Their Suitability for the Western CorridorPurified Recycled Water Scheme Page 25
5.5 Physicochemical SensorsFor a closed loop PRW system to be effective, there are a number of physicochemical parameters thatneed to be measured <strong>and</strong> controlled to ensure adequate treatment efficiencies. This is required toensure the source <strong>water</strong> entering <strong>and</strong> being released from a treatment barrier within the scheme canmeet the design specifications. For example, source <strong>quality</strong> is of paramount importance to ensure thatRO membrane treatment can be effective in Barrier 4. Hence, as there are a number of IPRcontaminants that must be measured in the validation phase, selected physicochemical parameters canoften be used as the first indicators of a deterioration or potential failure in treated <strong>water</strong> <strong>quality</strong> 4 .<strong>Current</strong>ly there are a number of these physicochemical sensors that are commercially available from arange of manufacturers (see Table 6 <strong>and</strong> Appendix 1). The <strong>suitability</strong> of physicochemical sensors forthe closed loop PRW system will be dependent on:The robustness of the sensor;Sample matrix;Maintenance required;Sampling location;Fouling of the sensor; <strong>and</strong>Calibration.Table 6Physicochemical parameters required to be measured at each barrierParameter B1 B2 B3 B4 B5 B6 B7CommerciallyAvailableTemperature √ √ √ √ √ √ √ YespH √ √ √ √ √ √ √ YesConductivity √ √ √ √ √ √ √ YesDissolvedOxygenSuspendedSolids√ √ √ √ Yes√ √ √ YesTurbidity √ √ √ √ √ √ Yes Eutech Instruments: pH - ISE; Conductivity - Resistance; DO - Amperometric; Temperature –Thermistor.Hach: pH-ISE; Conductivity - Inductive; Turbidity - LED; DO - Polarographic oramperometric.Endress+Hauser: pH - ISE; Turbidity - LED/UV-Vis.YSI: Conductivity - Resistance; DO - Optical; pH - ISE; Temperature – Thermistor.Hanna Instruments: pH - ISE; Temperature – Thermistor.Mettler Toledo: Temperature - Thermistor; pH - ISE; DO – Galvanic.Greenspan: Conductivity - Resistance; DO - Galvanic; pH - SE; Temperature - Thermistor;Turbidity – Photometric.As <strong>online</strong> sensors are required to operate continuously, they must withst<strong>and</strong> extreme <strong>and</strong>/or variableconditions, especially at Barriers 1, 2, 3 <strong>and</strong> 6, whilst still maintaining <strong>their</strong> calibrated status if they areto be an effective operational tool for operators <strong>and</strong> grid managers. Clearly, more commercial sensorsshould be suitable for operation in Barriers 3, 4 <strong>and</strong> 5, as the matrix is more consistent <strong>and</strong> the treatedproduct <strong>water</strong> is of a higher <strong>quality</strong> compared to Barriers 1, 2, 6 <strong>and</strong> 7. For example, it is highlyrecommended that photometric DO probes be employed for Barriers 1, 2, <strong>and</strong> 6, rather than relying onmembrane based sensors. This is because the sensors are required to operate in more variable <strong>and</strong>extreme matrix conditions, <strong>and</strong> those based on permeable membranes may be more prone to fouling<strong>and</strong> produce inaccurate measurements.<strong>Current</strong> Online Water Quality Monitoring Methods <strong>and</strong> Their Suitability for the Western CorridorPurified Recycled Water Scheme Page 26
For Barriers 1, 6 <strong>and</strong> 7 where the monitors will be distributed over wide geographic areas, it isrecommended that more robust sensors be employed to reduce the maintenance costs associated withthe measurements. Most sensors require maintenance at least monthly, but as they are required foroperational <strong>and</strong> control purposes, it is important that signal drift <strong>and</strong> calibration is controlled.Maintenance costs could be cost prohibitive if sensors cannot function unattended for prolongedperiods. Clearly autonomous in situ sensors are preferable to labour intensive ones. For Barriers 1, 2,6 <strong>and</strong> 7, it is also important that sensors can be compensated for environmental variations <strong>and</strong> signaldrift.5.6 Microbial ContaminantsThe presence of micro-organisms poses the highest risk in PRW due to health risks associated withpotentially infectious diseases, because in the WCRW project potable <strong>water</strong> is being produced from animpaired <strong>water</strong> resource (sewage effluent) 87 . Therefore, it is vitally important that the treatmentprocesses employed in the WCRW project are capable of meeting <strong>their</strong> design specifications for theeffective removal of the three main classes of pathogens; namely viruses, bacteria <strong>and</strong> protozoa. Itwould be preferable if continuous real-time information could be obtained on these three microbialclasses to validate that the treatment processes were effective <strong>and</strong> that the required level of removal isachieved consistently.Table 7 presents the microbial parameters that must be measured for each barrier. Presently there areno commercially available direct <strong>online</strong> measurements that can be used to analyse the keymicrobiological parameters, especially for Barriers 5 <strong>and</strong> 7.Table 7Microbial parameters required to be measured in PRW closed loop system for each barrierParameter B1 B2 B3 B4 B5 B6 B7Faecal Coliforms√F-RNA PhagesSomatic coliphagesEscherichia Coli √ √ √Total ColiformsClostridium perfringensGiardiaCryptosporidiumCyanobacteriaAlgal Counts√√√√√√√√The development of reliable <strong>and</strong> rapid <strong>online</strong> microbiological <strong>monitoring</strong> tools would furtherstrengthen existing baseline <strong>monitoring</strong> strategies <strong>and</strong> reduce costs currently associated with microbialassays. The only <strong>online</strong> sensors commercially available that can be used as surrogates to indicate thepresence of microbial contamination are indicators such as turbidity, suspended solids <strong>and</strong> freechlorine. For Barrier 7, it is highly recommended that free available chlorine is monitored inconjunction with turbidity <strong>and</strong> temperature to ascertain if the conditions within the distribution systemmay be conducive to microbiological activity 4 . For example, if the free chlorine levels are low <strong>and</strong>turbidity is increasing, then that risk may be potentially increasing. As turbidity <strong>and</strong> temperatureanalysers have been discussed previously, this section will deal with <strong>online</strong> analysers for <strong>monitoring</strong>chlorine. Hach: Free chlorine- amperometric; Ammonia/monochloramine - colorimetric.Endress+Hauser: Free chlorine – amperometric.YSI: Chlorine – cadmium reduction ionisation.Hanna: Chlorine - amperometric.<strong>Current</strong> Online Water Quality Monitoring Methods <strong>and</strong> Their Suitability for the Western CorridorPurified Recycled Water Scheme Page 27
Monochloramine is a suitable disinfectant for Barriers 3-4 to ensure RO membrane performance ismaintained. However, it should be noted that <strong>online</strong> free chlorine analysers are only suitable forBarriers 5, 6 <strong>and</strong> 7, as they are based on direct adaptations of laboratory-based <strong>methods</strong>. Thereforethey require strictly controlled measurement conditions <strong>and</strong> frequent calibration. For Barriers 2 (postclarification) <strong>and</strong> 3 there are no suitable commercially available <strong>methods</strong> with sufficient sensitivity tomonitor free chlorine levels below 0.05 mg/L. This is due to the limitations of the method <strong>and</strong>n<strong>online</strong>ar responses at the lower concentrations. As free chlorine is a CCP in Barrier 2 that may affectthe performance of upstream treatment barriers, it is of paramount importance that there is <strong>online</strong><strong>monitoring</strong> technology available that can detect in real-time if the system is approaching critical limits.In addition, reagent stability is of concern, as is signal drift.Therefore, there is still work to be done before commercially available <strong>online</strong> sensors can be used forlarge-scale autonomous <strong>water</strong> <strong>quality</strong> <strong>monitoring</strong>. This is very important in Barriers 5-6 <strong>and</strong> for thedistribution system in Barrier 7, as appropriate chlorine residuals must be maintained to ensure aconsistent, safe supply of potable <strong>water</strong>.As microbiological <strong>quality</strong> is the most important parameter required to ensure a safe supply ofdrinking <strong>water</strong>, the development of new <strong>online</strong> <strong>water</strong> <strong>quality</strong> <strong>monitoring</strong> tools that could rapidly assessthe treatment process would be highly beneficial <strong>and</strong> further complement the WCRW plan. Althoughthere have been some rapid <strong>methods</strong> developed for pathogens, e.g. flow cytometry <strong>and</strong> fluorescent insitu hybridisation (FISH), these still have several inherent drawbacks that inhibit <strong>their</strong> widespreadapplications, such as detection problems, the presence of large numbers of interfering species, <strong>and</strong> therequirement for highly skilled personnel 87 .Although there has been significant research in this area, viruses <strong>and</strong> protozoa are difficult to detect infresh <strong>water</strong> due to <strong>their</strong> low concentrations. Consequently, large volumes of <strong>water</strong> are required tomake a measurement with any degree of confidence. This can make analytical <strong>methods</strong> unsuitable forreal-time <strong>online</strong> process control, especially within Barriers 3-7 87, 88 . Methods that requirecentrifugation as a pre-concentration step are also not suitable for <strong>online</strong> applications 88 .Therefore, there are still no suitable <strong>online</strong> microbial analysis tools available that have the robustness,sensitivity <strong>and</strong> limited maintenance requirements necessary to be an effective <strong>monitoring</strong> tool for theWCRW system.Research <strong>and</strong> DevelopmentBiosensors offer an alternative for measuring microorganisms such as pathogens, viruses <strong>and</strong> bacteriain real-time to complement existing st<strong>and</strong>ard <strong>monitoring</strong> practices. For example, a cell-basedbiosensor has been demonstrated for measuring an E. coli strain that was responsive to mercury. Itwas immobilised on a micro-well fibre array <strong>and</strong> its response to mercury was measured 86 .Alternatively, DNA hybridization microarrays have been suggested as a platform for the paralleldetection of pathogenic organisms, which has potential applications in the PRW system 86 . Furtherdevelopment is required to improve <strong>their</strong> selectivity, durability <strong>and</strong> resistance to biofouling before theycould be used in applications such as the PRW system. Stewart-Pullaro et al. (2006) investigated asimple, rapid <strong>and</strong> inexpensive method for <strong>monitoring</strong> F + RNA, however no continuous, real-time<strong>methods</strong> with suitable accuracy were available 89 . Another promising development by Delahaye et al.(2003) has been the titration of adenosine triphosphate (ATP) using bioluminescence, which couldhave applications for <strong>monitoring</strong> coliforms <strong>and</strong> entercocci 90 . However despite these researchadvances, there are no biosensors available that have the operational performance <strong>and</strong> simplicity ofcomparable inorganic sensors (e.g. pH sensors) 86 .Once again electronic tongues have been suggested as an alternative tool for pathogen detection. Theyshow some promise, as measurements can be obtained rapidly with limited sample pre-treatment beingrequired, provided the correct sensors can be obtained to indicate microbial populations. However,sensor fouling would still be a problem, especially within Barriers 2, 6 <strong>and</strong> 7. Additionally, issuessuch as signal drift, reproducibility <strong>and</strong> calibration still need to be overcome to make this techniquesuitable for real-time continuous <strong>monitoring</strong>.<strong>Current</strong> Online Water Quality Monitoring Methods <strong>and</strong> Their Suitability for the Western CorridorPurified Recycled Water Scheme Page 28
5.7 Pesticides<strong>Current</strong>ly there are no commercially available pesticide sensors that are economically feasible toimplement in the WCRW project. However, there are a number of <strong>methods</strong> that have beendemonstrated in the scientific literature that may be suitable if further developed.Research <strong>and</strong> DevelopmentDurrier et al. (2006) used biosensors based on chlorophyll fluorescence or enzyme inhibition to detectthe presence of toxic heavy metals <strong>and</strong> pesticides in aquatic samples 91 . The technique was shown tobe sensitive at low concentrations <strong>and</strong> may be suitable for <strong>online</strong> <strong>monitoring</strong> applications.Cortina et al. (2007) used amperometric sensors to develop an electronic tongue for <strong>monitoring</strong>pesticides in aqueous solutions 92 . It was evaluated on river <strong>water</strong> before <strong>and</strong> after sewage treatment,with reasonable results being achieved. Solna et al. (2005) employed an electronic tongue based onamperometric sensors to determine pesticides <strong>and</strong> phenols such as carbaryl 93 . It could be a potentialalternative for rapidly <strong>monitoring</strong> pesticides in the WCRW project.Wang et al. (2007) have demonstrated the potential of using spectral fluorescence. They found thatcarbamate, benzoylurea <strong>and</strong> fungicides may emit strong fluorescence when excited by UV radiationunder certain conditions 94 .This field is rapidly emerging <strong>and</strong> future developments may offer some potential <strong>water</strong> <strong>quality</strong><strong>monitoring</strong> options for the WCRW project.5.8 Endocrine Disrupting Compounds (EDCs)<strong>Current</strong>ly there are no commercially available <strong>online</strong> sensors suitable for <strong>monitoring</strong> EDCs rapidly<strong>and</strong> cost-effectively in the WCRW project. For continuous <strong>monitoring</strong>, separation processes such aschromatography should not be used as they have high costs <strong>and</strong> maintenance requirements. However,there are a number of <strong>methods</strong> that have been demonstrated in the research literature that may besuitable if further developed.Research <strong>and</strong> DevelopmentRogers (2006) discussed the use of an in-line immunosensor system for measuring a wide range ofEDCs <strong>and</strong> pesticides 86 .Wang et al. (2006) demonstrated using a bifurcated fibre optic chemical sensor for real-time<strong>monitoring</strong> of Bisphenol A 95 . It used fluorescence quenching of pyrene/dimethyl -cyclodextrincomplex immobilised in a plasticised PVC membrane as an indicator probe. This method ormodifications of the measurement principle may be potential options in the future.5.9 Trihalomethanes (THMs)<strong>Current</strong>ly there are no commercially available <strong>online</strong> sensors suitable for <strong>monitoring</strong> THMs rapidly<strong>and</strong> cost-effectively in the WCRW project. However, there are a number of <strong>methods</strong> reported in theresearch literature that may be suitable if further developed.Research <strong>and</strong> DevelopmentA promising research paper was produced by Chellam <strong>and</strong> Krasner (2001), which investigates usingDissolved Organic Carbon (DOC) <strong>and</strong> Specific UV Absorbance (SUVA) to determine disinfection byproductsin nano-filtered <strong>water</strong>s 96 . There were found to be significant <strong>and</strong> positive correlationsbetween DOC <strong>and</strong> SUVA for both THMs <strong>and</strong> Haloacetic Acids (HAA) 96 . Isaji (2003) proposed usingphysicochemical parameters as surrogates to indicate THM, as well as additional organic <strong>and</strong>inorganic compounds 97 . For example, conductivity can be used to provide estimations of THMs.Carvalho et al. (2006) used a sensor array based on conducting polymers to determine chloroform inreal-time 98 . This may be the basis for a potential research option to produce a practical sensor.<strong>Current</strong> Online Water Quality Monitoring Methods <strong>and</strong> Their Suitability for the Western CorridorPurified Recycled Water Scheme Page 29
5.10 NitrosaminesTo the best of our knowledge there is no available commercially technology or research that c<strong>and</strong>emonstrate potential for measuring NDMA in the WCRW project cost effectively <strong>and</strong> <strong>online</strong>.5.11 Pharmaceuticals<strong>Current</strong>ly there are no suitable <strong>and</strong> economically feasible commercial <strong>online</strong> sensors available for theWCRW project.Research <strong>and</strong> DevelopmentTo the best of our knowledge there is limited research in the area that shows results suitable forapplication in the PRW system. However, Ishihara et al. (2005) demonstrated using an electronictongue based on a number of parameters 99 . Caffeine was measured with an electron-cyclotronresonanceplasma (ECR) sputtered carbon electrode. Electronic tongues could be an alternative optionfor <strong>monitoring</strong> key IPR contaminants of concern in the WCRW project in the future.5.12 Volatile Organic Carbon (VOC)There are currently several commercially available systems for <strong>monitoring</strong> VOC for Barriers 1 <strong>and</strong> 2(see examples given below). However, it should be noted that most of these systems may not besuitable for remote <strong>online</strong> <strong>monitoring</strong> applications due <strong>their</strong> high cost. Hence, they are not suitable forlarge-scale <strong>water</strong> <strong>quality</strong> <strong>monitoring</strong> applications within the WCRW project, but may be consideredfor <strong>monitoring</strong> at major treatment plants.ECH Elektrochemie Halle GmbH: Gas Chromatography.Ionicon Analytik: Proton Transfer Reaction – Mass Spectrometry (PTR-MS).Multisensor Systems: uses custom sensor arrays.RAE Systems: Photoionisation detector (Not considered fully automated <strong>online</strong>).Research <strong>and</strong> DevelopmentFrom the investigation of current research <strong>and</strong> development in the area, the use of an E-tongue mayagain be a potential option. This is because <strong>online</strong> sensors could be developed to indicate a number ofkey VOC that have been identified as IPR contaminants of concern in the PRW scheme. For exampleDe Melo et al. (2005) used an electronic nose based on conducting polypyrrole chains for determiningthe presence of VOC 100 . The sensing system showed good sensitivity to methanol, ethanol <strong>and</strong>benzene. Kim <strong>and</strong> Yang (2007) developed an Electronic nose (E-nose) using 4 different carbon blackpolymercomposite sensors in addition to a temperature sensor 101 . The sensor array measured thechemoresistance of different VOC responses acquired through a voltage circuit. Hence, E-Noses offerthe potential to limit the number of <strong>online</strong> <strong>monitoring</strong> analysers employed in the system, whilstincreasing the number of key output parameters that can be determined. This would be a highlydesirable approach for the WCRW project. However, further research <strong>and</strong> investigation is required toensure that this is the most appropriate measurement technique available with the required sensitivity.5.13 Early Warning SystemsEarly warning systems are important for the preventative management approach requirements of theWCRW project. This is because there are a number of IPR contaminants of concern that need to bemonitored continuously to ensure the treatment efficiency of each barrier. As it is not cost effective ortechnically feasible to measure all IPR contaminants of concern, it is important that <strong>online</strong> <strong>monitoring</strong>systems can detect excursions that may indicate that there is contamination or a gradual deteriorationin <strong>water</strong> <strong>quality</strong>. This is especially important as operators <strong>and</strong> grid managers must ensure that <strong>their</strong>plants comply with PWR guidelines, but it is extremely difficult to mitigate for risks that may onlybecome evident after serious problems have occurred.Hach: Event Monitor.<strong>Current</strong> Online Water Quality Monitoring Methods <strong>and</strong> Their Suitability for the Western CorridorPurified Recycled Water Scheme Page 30
Recently, Hach introduced an Event Monitor that can be used for early warning. It can detect, alert<strong>and</strong> classify contaminants such as arsenic or anthrax based on computationally intelligent techniquesthat employ a combination of physicochemical sensors, total chlorine <strong>and</strong> TOC to monitor changes inbaseline patterns. The system can be continuously updated, as it is based on fingerprint identification.However, as the system is based on intelligent software that is commercial <strong>and</strong> in confidence, it is notavailable for peer review. It has also been noted in the literature that the accuracy of measurementsystems based on multi-parameter sensor inputs that are processed collectively is still affected bysignal drift issues over time 65 if they use conventional <strong>methods</strong> of calibration. In addition, ifcompound identification is based on non-selective information such as physicochemical sensors, thesystem may also be matrix dependent. This is because non-selective sensors are used to indicatechanges in the baseline sample matrix 65 or IPR contaminants of concern based on an indirect cause <strong>and</strong>effect relationship between the sample matrix <strong>and</strong> sensor system employed. Therefore it may be onlyvalid in specific, well defined measurement conditions.Research <strong>and</strong> DevelopmentThis research area is rapidly exp<strong>and</strong>ing, as the dem<strong>and</strong> for rapid detection of deliberate contamination<strong>and</strong> the ability to safely recycle <strong>water</strong>s becomes more prominent. There are many approaches beingused for rapid early warning, with numerous research approaches focused on developing intelligentdata processing techniques for detecting a) sensor failure <strong>and</strong> b) contamination. For example, Riegeret al. (2004) used software techniques to detect sensor malfunctions 102 . However, this research is stillin its infancy. Clearly, for the PRW system an intelligent early warning system that can collectivelyincorporate historical as well as <strong>online</strong> <strong>monitoring</strong> data would be highly beneficial. <strong>Current</strong>ly, there isno historical data available from the Western Corridor Recycled Water scheme suitable for developingan early warning <strong>monitoring</strong> system that incorporates diurnal, seasonal <strong>and</strong> temporal variation as wellas contamination events. Consequently, it is recommended that immediate steps should be taken toimplement a systematic data <strong>and</strong> metadata recording scheme for the PRW scheme. This would formthe basis for developing <strong>and</strong> implementing a real time early warning system.6. CONCLUSIONS AND RECOMMENDATIONS6.1 ConclusionsAs became evident during the course of this review, the field of <strong>online</strong> <strong>water</strong> <strong>quality</strong> <strong>monitoring</strong> israpidly exp<strong>and</strong>ing <strong>and</strong> still requires further advances to improve sensor performance, reliability <strong>and</strong>cost effectiveness. <strong>Current</strong>ly, there are no broadly agreed international st<strong>and</strong>ards or <strong>methods</strong>developed that allow for large-scale, <strong>online</strong>, reliable <strong>and</strong> cost-effective data to be acquired, integrated<strong>and</strong> applied. There are commercially available analysers for <strong>monitoring</strong> Turbidity, Suspended Solids,Nutrients, Ammonia, organic parameters such as BOD 5 , COD <strong>and</strong> TOC; as well as Inorganic <strong>and</strong>Physicochemical parameters. However, most have difficulty acquiring continuous, reliable <strong>and</strong> costeffective<strong>water</strong> <strong>quality</strong> information in <strong>online</strong> installations. This is primarily due to the maintenance<strong>and</strong> calibration costs associated with the instrumentation, as most <strong>online</strong> analysers are based on directadaptations of traditional laboratory-based <strong>methods</strong>. These <strong>methods</strong> require controlled measurementenvironments to obtain analytically valid results, which are rarely present in the field. As aconsequence, <strong>online</strong> <strong>monitoring</strong> in its current form suffers from more problems than laboratory-based<strong>methods</strong>, as the <strong>methods</strong> were not originally designed for field applications. Hence, there aresignificant economic <strong>and</strong> logistics costs associated with maintaining <strong>online</strong> analysers of this nature,especially in remote areas, due to maintenance, calibration, blockages, matrix interferences,biofouling, signal drift <strong>and</strong> reagent consumption. In addition, it was evident that there are only alimited number of commercially available <strong>online</strong> analysers that are suitable for all measurementenvironments <strong>and</strong> treatment barriers required within the WCRW scheme.It has been highlighted in the review that failure to maintain <strong>and</strong> calibrate <strong>online</strong> analysersappropriately can result in the following problems:<strong>Current</strong> Online Water Quality Monitoring Methods <strong>and</strong> Their Suitability for the Western CorridorPurified Recycled Water Scheme Page 31
Increased likelihood of false positive <strong>and</strong> false negative events;Decreased likelihood of detecting short <strong>and</strong> long-term trends from baseline <strong>monitoring</strong>conditions; <strong>and</strong> Large volumes of redundant data being produced but not being useable to optimise operational<strong>monitoring</strong> procedures.To improve the performance of existing <strong>online</strong> systems, commercial <strong>and</strong> research endeavours havefocused on improving sensor selectivity; reducing reagent consumption; overcoming matrixinterferences; <strong>and</strong> simplifying calibration <strong>and</strong> sample pre-treatment requirements. However asevidenced by the review, there is not one single approach that has been implemented that can resolvemost of the problems associated with improving <strong>online</strong> <strong>monitoring</strong> performance. This is especially thecase for those <strong>methods</strong> that are based on direct adaptations of traditional laboratory-based <strong>methods</strong>.To overcome the logistics <strong>and</strong> economic costs associated with maintaining reliable <strong>online</strong>measurements <strong>and</strong> improve <strong>their</strong> widespread application, it is clearly evident that <strong>online</strong> technologyshould be redesigned to operate continuously in changeable measurement environments. Therefore,there is an urgent need to develop cost-effective <strong>online</strong> <strong>water</strong> <strong>quality</strong> <strong>monitoring</strong> technology that canmaintain its calibrated status for prolonged periods of time <strong>and</strong> operate reliably irrespective ofenvironmental or sample matrix conditions. It is also highly desirable that the instruments should uselimited or no reagents, <strong>and</strong> be more resistant to fouling, signal drift <strong>and</strong> matrix interferences.From the review of commercially available <strong>online</strong> analysers it was evident that obtaining reliable lowmaintenance continuous <strong>online</strong> analysers for Barriers 1 <strong>and</strong> 2 is problematic. Monitoring in theselocations is currently a real challenge for commercial systems due to the complex nature of themeasurement environment. In addition, many of the systems available are too expensive to allow <strong>their</strong>widespread use.In regards to <strong>monitoring</strong> of heavy metals, <strong>online</strong> sensors must have adequate sensitivity for Barrier 2<strong>and</strong> high sensitivity for Barriers 5-7. It was evident that a cost-effective technique is required, asdirect adaptations of conventional laboratory-based <strong>methods</strong> such as AAS <strong>and</strong> ICP-MS are unsuitable<strong>online</strong> <strong>monitoring</strong> tools due to <strong>their</strong> high expense, along with separation, extraction <strong>and</strong> maintenancecosts. Electronic tongues or voltametric <strong>methods</strong> may offer an alternative, <strong>and</strong> several such devicesare currently being commercially developed.With regards to <strong>online</strong> analysers for rapid microbial detection, there are at present only surrogateindicators commercially available, such as turbidity or free chlorine analysers. Although biosensorsshow promise, there are no commercially available sensors with equivalent performance to equivalentchemical sensors. It is possible that electronic tongues or software sensors may offer promise in thisarea. Therefore it is recommended that, as a high priority, robust, sensitive <strong>and</strong> low maintenance<strong>online</strong> microbial analysis tools should be developed for the WCRW system, especially to detect thethree main classes of pathogens.For Pesticides, EDCs, Pharmaceuticals, THMs, NDMA <strong>and</strong> VOCs, there are no commercially <strong>and</strong>economically viable <strong>online</strong> <strong>monitoring</strong> systems available for the WCRW scheme. E-tongues, E-noses<strong>and</strong> software sensors may offer some potential in the future if further developed. They have thepotential to reduce the number of analysers required for the scheme whilst maximising the number of<strong>water</strong> <strong>quality</strong> parameters that can be determined. They would also reduce reagent costs <strong>and</strong>maintenance associated with the <strong>monitoring</strong>. However, the following should be taken into accountwhen developing systems of this nature:Need rugged reference electrodes to reduce risk of contamination through liquid junctions; Must be resistant to biofouling especially in Barriers 1, 2 <strong>and</strong> 6;Improved data analysis techniques are required to make software sensors more suitable for longtermdeployment applications by reducing signal drift; <strong>and</strong>Minimise consumption of reagents, so that they can be suitable for remote <strong>monitoring</strong>applications.<strong>Current</strong> Online Water Quality Monitoring Methods <strong>and</strong> Their Suitability for the Western CorridorPurified Recycled Water Scheme Page 32
6.2 Summary of RecommendationsThe following recommendations are provided from this review of current <strong>online</strong> <strong>water</strong> <strong>quality</strong><strong>monitoring</strong> <strong>methods</strong> <strong>and</strong> commercially available <strong>online</strong> sensors.Recommendation 1:Priority needs to be given to sourcing or developing <strong>online</strong> analysers that are more reliable <strong>and</strong>resistant to biofouling <strong>and</strong> failure, especially for Barriers 1, 2 <strong>and</strong> 6, 7.Recommendation 2:Metadata needs to be recorded <strong>and</strong> incorporated into the data processing procedure to provide ameasurement context to aid in the identification <strong>and</strong> assessment of events, <strong>and</strong> to ensure consistentdata recording <strong>and</strong> retrieval protocols.Recommendation 3:There is an urgent need to develop <strong>online</strong> microbial analysis tools for the WCRW system that arerobust, sensitive <strong>and</strong> require limited maintenance, especially for <strong>monitoring</strong> treatment efficiency inregards to the three main classes of pathogens.Recommendation 4:Hydraulic data should be incorporated with the <strong>online</strong> <strong>water</strong> <strong>quality</strong> information to help assess how<strong>water</strong> <strong>quality</strong> might be changing between <strong>online</strong> sampling locations, to identify potential problems,<strong>and</strong> to optimise chemical dosing procedures.Recommendation 5:If UV-Vis absorption techniques such as s::can that incorporate chemometric algorithms are used inthe WCRW scheme, it is recommended that to ensure performance <strong>and</strong> accuracy, they should beplaced in measurement environments where turbidity is below 150 NTU.Recommendation 6:Labour intensive <strong>online</strong> analysers such as colorimetric techniques should be employed in barrierswhere there are always staff present to maintain the instruments. Less labour intensive <strong>methods</strong> suchas fibre optics <strong>and</strong> conductivity sensors should be used for Barrier 1, 5/6 <strong>and</strong> 7, especially if the<strong>monitoring</strong> site is remote.Recommendation 7:The manufacturers’ specifications for <strong>online</strong> analysers sometimes do not adequately reflect the actualperformance of the analyser in continuous, real-world measurement environments. It is recommendedthat <strong>water</strong> utilities independently investigate the operation <strong>and</strong> performances of instruments to ensurethey are suitable for the intended use, based on the following criteria: Economic costs associated with maintenance <strong>and</strong> calibration;Robustness to operate continuously <strong>and</strong> reliably in non-ideal environmental conditions;Ability to be linked with a centralised SCADA system;Ability to process data in real-time <strong>and</strong> provide accurate <strong>water</strong> <strong>quality</strong> information; <strong>and</strong>Honest feedback on the instruments performance <strong>and</strong> reliability obtained from other <strong>water</strong>utilities that have employed the <strong>online</strong> analysers.<strong>Current</strong> Online Water Quality Monitoring Methods <strong>and</strong> Their Suitability for the Western CorridorPurified Recycled Water Scheme Page 33
Recommendation 8:Online analysers should be designed from the ground up to operate in changeable field environments,rather than to follow the current practice of modifying laboratory-based <strong>methods</strong>. The <strong>online</strong>analysers should be developed to:Operate in changeable measurement environments irrespective of sample matrix conditions;Be capable of maintaining <strong>their</strong> calibrated status for extended periods of time;Consume limited or no reagents;Be resistant to biofouling, signal drift <strong>and</strong> blockages;Be capable of operating reliably <strong>and</strong> accurately; <strong>and</strong>Minimise the number of false positive <strong>and</strong> false negative events.Recommendation 9:Computationally intelligent techniques should be employed for <strong>online</strong> data processing to assist gridmanagers in identifying any deterioration in <strong>water</strong> <strong>quality</strong>, or to alert if there is too much hazardoverwhelming the system. These techniques could also be used to incorporate relevant metadata intothe decision-making process, so that features in the <strong>online</strong> data record can be matched to knownsystem events (e.g. treatment plant upsets, scheduled maintenance).<strong>Current</strong> Online Water Quality Monitoring Methods <strong>and</strong> Their Suitability for the Western CorridorPurified Recycled Water Scheme Page 34
7. REFERENCES1. Queensl<strong>and</strong> Water Commission (2008). Fact Sheet 4-The Western Corridor Recycled Water Project.www.westerncorridor.qld.gov.au2. Queensl<strong>and</strong> Water Commission. (2007). Urban Water Supply Arrangement In South EastQueensl<strong>and</strong>.www.qwc.qld.gov.au/Urban+Water+Supply+Arrangements+Report3. The Queensl<strong>and</strong> State Government- Environmental Protection Agency (2005). Queensl<strong>and</strong> WaterRecycling Guidelines, Environmental Protection Agency, Brisbane4. NHMRC/ <strong>and</strong> ARMCANZ (1996). Australian Drinking Water Guidelines, Commonwealth Governmentof Australia5. Natural Resource Management Ministerial Council <strong>and</strong> Environment Protection <strong>and</strong> Heritage Council.(2007). Australian Guidelines for Water Recycling (draft)6. Vanrolleghem P <strong>and</strong> Lee D (2003). Online <strong>monitoring</strong> equipment for waste<strong>water</strong> treatment processes:state of the art, Water Science <strong>and</strong> Technology, 47:1-347. Fogelman S et al. (2006). A rapid analytical method for predicting the oxygen dem<strong>and</strong> of waste<strong>water</strong>.Anal Bioanal Chem 386:1773-17798. O’Halloran R et al. (2008). Data Processing <strong>and</strong> Analysis for Online Distribution System Monitoring,Awwa Research Foundation, Denver CO USA; ISBN 978-1-60573-028-99. Bellona C et al. (2004). Factors affecting the rejection of organic solutes during NF/RO treatment- aliterature review. Water Research 38:2795-280910. Hach. (2002).CA610 Fluoride Analyser Instrument Manual, USA11. Hach Ultra (2006). 9245 Single Channel Sodium Analyser Operation Manual, Europe12. Thermo Electron Corporation (2005). AquaPro pH Specification Sheet, USA13. Thermo Electron Corporation (2006). Orion 2002SS Stainless Steel 2-Cell Instruction Sheet, USA14. Str<strong>and</strong>berg Engineering Laboratories Inc (2007). H/ORP Monitor-Indicating Controller, Model 7766,USA15. Hach (1999). APA 6000 Ammonia/Monochloramine <strong>and</strong> Low Range Ammonia Process AnalyserManual, USA16. Kelma (2007). Online Ammonium Analyser17. Hach (2005). Cl17 Chlorine Analyser, USA18. Hach (2001). 1950plus Online TOC Analyzer, USA19. Hach (2004). Nitratax Sc Operation Manual, USA20. Hach (2007). Data Sheet -HACH LDO® Dissolved Oxygen Probe, USA21. Chow C et al. (2003). Development of an <strong>online</strong> electrochemical analyser for trace level aluminium.Analytica Chimica Acta 499:173-18122. Zhao H et al. (2004). Development of a direct photoelectrochemical method for determination ofchemical oxygen dem<strong>and</strong>, Analytical Chemistry, 76:155-16023. Winkler S et al. (2004). Application of ion-sensitive sensors in <strong>water</strong> <strong>quality</strong> <strong>monitoring</strong>. Water Science<strong>and</strong> Technology , 50:105-11424. Frey F <strong>and</strong> Sullivan L (2004). Practical Application of Online Monitoring, Awwa Research Foundation,Denver25. LAR Process Analysers (2007). Quick COD Series, Berlin26. Diamond D (2004). Internet-scale sensing, Analytical Chemistry, 279 A: 79-28627. Wang J (2002), Portable Electrochemical Systems, Trends in Analytical Chemistry, 21(4):226-23228. Byrne R <strong>and</strong> Diamond D (2006). Chemo/bio-sensor networks. Nature Materials, 5: 421-42429. Cerda V et al. Flow techniques in <strong>water</strong> analysis, Talanta, 50:695-70530. Bonastre A et al. (2005). In-line chemical analysis of waste<strong>water</strong>: present <strong>and</strong> future trends. Trends inAnalytical Chemistry, 24:128-13731. Allan J et al. Strategic <strong>monitoring</strong> for the European Water Framework, Trends in Analytical Chemistry,25:704-71532. Butler D (2006). Everything, Everywhere 2020, Nature, 440:402-40533. Allan J et al. A "toolbox" for biological <strong>and</strong> chemical <strong>monitoring</strong> requirements for the European Union'sWater Framework Directive, Talanta, 69:302-32234. Hach-Lange (2007). Product information process analysis ion-selective electrode NH4D SC, Engl<strong>and</strong><strong>Current</strong> Online Water Quality Monitoring Methods <strong>and</strong> Their Suitability for the Western CorridorPurified Recycled Water Scheme Page 35
35. Yager P (2006). Microfluidic diagnostic technologies for global public health, Nature, 442, 412-41836. Danszer K <strong>and</strong> Currie L (1998). Guidelines for calibration in analytical chemistry, Pure Appl. Chem,70:993-101437. Sequeira M <strong>and</strong> Diamond D (2002). Progress in the realisation of an autonomous environmental<strong>monitoring</strong> device for ammonia, Trends in Analytical Chemistry, 21:816-82738. Janasek D et al. (2006). Scaling <strong>and</strong> the design of miniaturized chemical-analysis systems, Nature,442:374-38039. Waterhouse W (1960). Gauss's first argument for least squares, Archive for History of Exact Sciences, 41:41-5240. Dworak T et al. (2005). The need for new <strong>monitoring</strong> tools to implement the WFD, EnvironmentalScience <strong>and</strong> Policy, 8:301-30641. Schwarzenbach R et al (2006), The challenge of micropollutants in aquatic systems. Nature, 313:1072-107742. Khorassani H et al. (1999). A simple UV spectrophotometric procedure for the survey of industrialsewage systems, Wat. Sci. Tech, 39 (10-11):77-8243. Rogers K <strong>and</strong> Poziomek E (1996). Fiber optic sensors for environmental <strong>monitoring</strong>, Chemosphere, 33:1151-117444. Fogelman S et al. (2006). Estimation of chemical oxygen dem<strong>and</strong> by ultraviolet spectroscopic profiling<strong>and</strong> artificial neural networks, Neural Computing <strong>and</strong> Applications 15:197-20345. Grattan K. Principles of optical fibre sensing for <strong>water</strong> industry applications, Measurement, 20:109-11946. Strobl R <strong>and</strong> Robillard P (2006). Artificial Intelligence Technologies in Surface Water QualityMonitoring, Water International, 31:198-20947. Workman J et al. (2005). Process Analytical Chemistry. Anal. Chem, 77:3789-380648. Otto M <strong>and</strong> Thomas R (1985). Model Studies on Multiple Channel Analysis of Free Magnesium,Calcium, Sodium, <strong>and</strong> Potassium at Physiological Concentration Levels with Ion-Selective Electrodes,Anal. Chem, 57:2647-265149. Gallardo J et al. (2004). A flow-injection electronic tongue based on potentiometric sensors for thedetermination of nitrate in the presence of chloride, Sensors <strong>and</strong> Actuators B, 101:72-8050. Moreno-Bar´on L et al (2006). Application of the wavelet transform coupled with artificial neuralnetworks for quantification purposes in a voltammetric electronic tongue, Sensors <strong>and</strong> Actuators B, 113:487-49951. Taib M et al. (2002). Extending the response range of an optical fibre pH sensor using an artificial neuralnetwork, Analytica Chimica Acta, 330: 31-4052. Mathias B et al. (1997). Smart-sensor approach for a fibre-optic based residual chlorine monitor, Sensors<strong>and</strong> Actuators, 38-39:380-38553. Chow C et al. (1997). An intelligent sensor system for the determination of ammonia using flow injectionanalysis. Laboratory automation <strong>and</strong> information management 33:17-2754. Jang A et al. (2005). Miniaturized Redox Potential Probe for In Situ Environmental Monitoring. Environ.Sci. Technol, 39:6191-619755. Pravdova V et al. (2002). Role of chemometrics for electrochemical sensors, Analytical Letters, 35:2389-241956. Vlasov Y et al. (1997). Cross-sensitivity evaluation of chemical sensors for electronic tongue:determination of heavy metal ions, Sensors <strong>and</strong> Actuators B, 44:532-53757. Hartnett M <strong>and</strong> Diamond D (1997). Potentiometric N<strong>online</strong>ar Multivariate Calibration with GeneticAlgorithm <strong>and</strong> Simplex Optimization, Anal. Chem, 69:1909-191858. Rudnitskaya et al. (2001). Multisensor system on the basis of an array of non-specific chemical sensors<strong>and</strong> artificial neural networks for determination of inorganic pollutants in a model ground<strong>water</strong>, Talanta,55 (2):425-43159. Gallardo J et al. (2003). An electronic tongue using potentiometric all-solid-state PVC-membrane sensorsfor the simultaneous quantification of ammonium <strong>and</strong> potassium ions in <strong>water</strong>, Anal Bioanal Chem,377:248-2560. Gallardo J et al. (2005). Use of an Electronic Tongue Based on All-Solid-State Potentiometric Sensors forthe Quantitation of Alkaline Ions, Electroanalysis, 17: 348-34561. Correia D et al. (2005). Array of potentiometric sensors for simultaneous analysis of urea <strong>and</strong> potassium,Talanta, 67, 773-78262. Baret M et al. (1999). Halide ion-selective electrode array calibration, Talanta, 50: 541-558<strong>Current</strong> Online Water Quality Monitoring Methods <strong>and</strong> Their Suitability for the Western CorridorPurified Recycled Water Scheme Page 36
63. WTW (2008) The IQ SENSOR NET XT Product Catalogue, USA,http://www.wtw.com/media/US_O_066_085_IQSN_web.pdf64. Krantz-Rulcker et al. (2001). Electronic tongues for environmental <strong>monitoring</strong> based on sensor arrays <strong>and</strong>pattern recognition: a review, Analytica Chimica Acta, 426:217-22665. Lavine B <strong>and</strong> Workman J (2006). Chemometrics, Anal. Chem, 78:4137-414566. Advance Sensor Technologies Inc (2004). Case Study #13 - Fluoride Ion Monitoring, California67. Hach-Lange (2007) Short Operating Guide for the LDO HQ10 <strong>and</strong> HQ20 Dissolved Oxygen Meters,Engl<strong>and</strong>68. Masson et al. (1999). Software sensor design based on empirical data, Ecological Modelling, 120 (2):131-13969. Di Natale C et al. (1997). Multicomponent analysis of polluted <strong>water</strong> by means of an electronic tongue,Sensors <strong>and</strong> Actuators B, 44 :423-42870. Mart´ınez-Máñez R et al (2005). An “electronic tongue” design for the qualitative analysis of natural<strong>water</strong>s, Sensors <strong>and</strong> Actuators B, 104:302-30771. Deisingh A et al. (2004). Applications of electronic noses <strong>and</strong> tongues in food analysis, InternationalJournal of Food Science <strong>and</strong> Technology, 39:587-60472. Benjathapanun N et al. (1997). Binary encoded 2nd differential spectrometry using UV-Vis spectral data<strong>and</strong> neural networks in the estimation of species type <strong>and</strong> concentration, IEE Proc-Sci. Meas. Technol,144 (2):73-8073. Charef A et al. (2000). Water <strong>quality</strong> <strong>monitoring</strong> using smart sensing system, Measurement, 28:219-22474. Fogelman S (2003). Towards the development of a rapid, real-time indirect method for determiningoxygen dem<strong>and</strong> of <strong>water</strong>s <strong>and</strong> waste<strong>water</strong>s. School of Environmental <strong>and</strong> Applied Sciences, GriffithUniversity: Gold Coast75. Dahlen J et al. (2000). Determination of nitrate <strong>and</strong> other <strong>water</strong> <strong>quality</strong> parameters in ground<strong>water</strong> fromUV-Vis spectra employing partial least squared regression, Chemosphere, 40:71-7776. Masmoudi R (1999). Rapid prediction of effluent biochemical oxygen dem<strong>and</strong> for improvedenvironmental control, TAPPI Journal, 82(10):111-11977. Vlasov Y et al. (2000). «Electronic tongue» — new analytical tool for liquid analysis on the basis of nonspecificsensors <strong>and</strong> <strong>methods</strong> of pattern recognition, Sensors <strong>and</strong> Actuators B, 65:235-23678. Schneider P et al. SEQ Water- Drought Water Quality Risk Assessment, SEQ Water, Brisbane79. Guttierrez M et al. (2008). Remote environmental <strong>monitoring</strong> employing a potentiometric electronictongue, Intern. J. Environ. Anal. Chem. 88:103-11780. Roux et al. (2008). The Western Corridor Recycled Water Project – Overview, Risk ManagementApproach <strong>and</strong> Water Quality Monitoring, Enviro 2008, Melbourne81. Mikkelsen O et al. (2003). Evaluations of solid electrodes for use in voltammetric <strong>monitoring</strong> of heavymetals in samples from metallurgical nickel industry, Anal Bioanal Chem, 377:322–32682. Waeber M <strong>and</strong> Taillefert M (2008). Remote in situ voltammetric techniques to characterize thebiogeochemical cycling of trace metals in aquatic systems, Journal of Environmental Monitoring, 10:30-5483. Xie X et al. (2004). Development of an ultramicroelectrode arrays (UMEAs) sensor for trace heavy metalmeasurement in <strong>water</strong>, Sensors <strong>and</strong> Actuators B, 97:168-17384. Zou S et al. (2004). Automatic Monitoring Electronic Tongue with MEAs for Environmental Analysis,Rare Metal Materials <strong>and</strong> Engineering, 35:381-38485. Mena H et al (2005). A novel electronic tongue combined MLAPS with stripping voltammetry forenvironmental detection, Sensors <strong>and</strong> Actuators B, 110:350-35786. Rogers K (2006). Recent advances in biosensor techniques for environmental <strong>monitoring</strong>, AnalyticaChimica Acta, 568:222-23187. Tose S (2004). Literature review on the Fate of Viruses <strong>and</strong> Other Pathogens <strong>and</strong> Health Risks in Non-Potable Reuse of Storm Water <strong>and</strong> Reclaimed Water, Australian Water Association, Sydney, ISBN 0 64309176 988. Strauba T <strong>and</strong> Ch<strong>and</strong>ler D (2003). Towards a unified system for detecting <strong>water</strong>borne pathogens, Journalof Microbiological Methods, 53:185-19789. Stewart-Pullaro J et al. (2006). F+RNA coliphage typing for microbial source tracking in surface <strong>water</strong>s,Journal of Applied Microbiology, 101:1015-102690. Delahaye E et al. (2003). An ATP-based method for <strong>monitoring</strong> the microbiological drinking <strong>water</strong><strong>quality</strong> in a distribution network, Water Research, 37(15):3689-3696<strong>Current</strong> Online Water Quality Monitoring Methods <strong>and</strong> Their Suitability for the Western CorridorPurified Recycled Water Scheme Page 37
91. Durrieu C et al. (2006). Algal biosensors for aquatic ecosystems <strong>monitoring</strong>. European Physical Journal-Applied Physics: 36(2):205-20992. Cortina M, del Valle M, <strong>and</strong> Marty J, Electronic Tongue Using an Enzyme Inhibition Biosensor Array forthe Resolution of Pesticide Mixtures. Electroanalysis, 2008. 20(1): p. 54-60.93. Solna R et al. (2005). Multienzyme electrochemical array sensor for determination of phenols <strong>and</strong>pesticides. Talanta, 65:349-35794. Wang Z et al. (2007). Study on the detection of organic pesticides by fluorescence spectra, Spectroscopy<strong>and</strong> Spectral Analysis, 27:2321-232495. Wang X et al. (2006). Selective determination of bisphenol A (BPA) in <strong>water</strong> by a reversible fluorescencesensor using pyrene/dimethyl β-cyclodextrin complex, Analytica Chimica Acta, 556 (2):313-31896. Chellam S <strong>and</strong> Krasner S (2001). Disinfection byproduct relationships <strong>and</strong> speciation in chlorinatednanofiltered <strong>water</strong>s, Environmental Science <strong>and</strong> Technology, 35:3988-399997. Isaji C (2003). Integrated <strong>water</strong> <strong>quality</strong> management for drinking <strong>water</strong> of good <strong>quality</strong>, Water Science<strong>and</strong> Technology, 47:15-2398. Carvalho E et al. (2006). Sensorial system to detect chloroform in <strong>water</strong>, Sensor Letters, 4:129-13499. Ishihara S et al. (2005). Smart chemical taste sensor for determination <strong>and</strong> prediction of taste qualitiesbased on a two-phase optimized radial basis function network, Analytical Chemistry, 77:7908-7915100. de Melo C et al. (2005). Use of conducting polypyrrole blends as gas sensors, Sensors <strong>and</strong> Actuators B,109:348-354101. Kim Y <strong>and</strong> Yang Y (2007). Additional thermodynamic feature extraction from chemoresistive carbonblack-polymer composite sensors by temperature modulation, Sensors <strong>and</strong> Actuators B, 121: 507-514102. Rieger L et al. (2004). Computer-aided <strong>monitoring</strong> <strong>and</strong> operation of continuous measuring devices, WaterScience <strong>and</strong> Technology, 50:31-39103. St<strong>and</strong>ard Methods for the Examination of Water <strong>and</strong> Waste<strong>water</strong> 21 st Edition (2005), a joint publicationof the American Public Health Association (APHA), the American Water Works Association (AWWA),<strong>and</strong> the Water Environment Federation (WEF).<strong>Current</strong> Online Water Quality Monitoring Methods <strong>and</strong> Their Suitability for the Western CorridorPurified Recycled Water Scheme Page 38
Appendix 1: Review of Commercially Available Sensors for WCRW ProjectCompanyNameWebsiteWater QualityParameterMeasurementRangeMatrixSuitabilityReliability <strong>and</strong> maintenance-frequency of calibrationMeasurementPrincipleMaintenance/WarrantyAccreditationEutechInstrumentshttp://www.eutechinst.com/pHConductivityORPDissolvedOxygenTemperature0-140- 2000 uS/cm0-995 mV0.04 tosaturation-10 to 125°CB 2-7B 2-7B 3-7B1-7B1-7Frequency of calibration willvary depending on samplematrix <strong>and</strong> variabilityISEAmperometricThermistor1 yearinstrument, 6months sensorsISO 9001ECHElektrochemie HalleGmbHwww.ech.de HydrocarbonsVOC< 1 ppm B 1-3 GC is <strong>online</strong>,Cal. every 6monthsGasChromatography1 year warranty ECHElektrochemieHalle GmbHHACHhttp://www.hach.com/AlkalinityAmmonia/NitrogenChlorine, FreeChlorine, TotalConductivityCopperDissolvedOxygenDissolvedOxygenHardnesspHpHSodiumSuspendedSolids(&Turbidity)TOC0-500 mg/L0.02-2.0 mg/LNH 3 as N0-20 mg/LHOCL0-2000 µS/cm0.05-2.0 mg/L0-80 ppm0-40 mg/L0.05-10 mg/L2-120-140.01-10000ppm0-200 ppm0.001-500mg/L0-4000 NTU0-25 mg/LB 3 – B 5,B4-5,B7B3-B7B2-B7B2-B5,B7B3-B7B2, B6B4B4,B5B2-B7B4-5B3,B6-7B1-B7B4,5, 7B1-2, 6B2-B7Online, Auto-CMin 1/monthOnline, Auto-C.Min 1/monthMin per 2 monthsOnlineOnline, Auto- CMin 1/monthOnlineMin 1/ yearOnlineOnline/autoMin 1/monthOnlineOnlineOnline Auto C, min 100 daysOnlineOnlineOnlineColorimetricColorimetricAmperometricInductiveColorimetricpolarographicAmperometricColorimetricPotentiometricPotentiometricISELEDHigh Temp.OxidationSpectrophotometerAbsorbance,Transmittance1 monthmaintenancedependingcalibration1/monthField provenLowmaintenanceOperates 1monthunattendedWorry-FreeSuitable forindustrialapplications.Field workHACH’s ISO9001-2000certification;Known worldwide& industrialapplications<strong>Current</strong> Online Water Quality Monitoring Methods <strong>and</strong> Their Suitability for the Western CorridorPurified Recycled Water Scheme Page 39
CompanyNameWebsiteWater QualityParameterUV 254MeasurementRange0-20000 mg/L-10.01-3000m -MatrixSuitabilityB3-5,B7Reliability <strong>and</strong> maintenance-frequency of calibrationOnlineMeasurementPrincipleColorimetricMaintenance/WarrantyAccreditationAmmonia/monochloramineAmmonia/ammoniumOrthophosphate0.02-2.0 mg/Las N (0.1- 10.0mg/L as Cl2)0-20 mg/L0-15 mg/LB2C-3,B6B2C-B7B1-2, B6,B7B2-B7Online/auto-C every 3 daysOnline auto-C every 3 daysColorimetricColorimetricE+HEndress+Hauserhttp://www.de.endress.com/FlowEvent WarningpHTurbidityAmmoniumNitratePhosphateSTIP in-situ,see productinformationNitrateCODTOCTurbidity (ATU)3 sludgeparametersMay notrespond tomany of the360 IPRcontaminants0-14B 1 – 70-100 NTU B 6 – 71-500µg/l ; 0.2- B 2C – 7100mg/lB 2-70.2-30 g/l B 2C-70.1-8mg/l ;1.0-50mg/lB2C0.3-23 mg/l10-2000 mg/l4-800 mg/l1-250 m -1 B3-B7B2Online, fully automatedOnline, primary calibrationless than 5 minutes<strong>online</strong> /auto-Cmaintenance 6 monthsOnline /in-lineOnlineOnline, in-lineOnlineOnlineOnlineElectrochemicalLEDColorimetricUV PhotometricColorimetricSpectroscopicColorimetricUV SpectrometryFor drinking &waste<strong>water</strong>For drinking &treated process<strong>water</strong>Water treatmentplants & outletsactivated sludgeWater treatmentplants & outletsMeasuresdirectly inwaste<strong>water</strong>Accredited &marketedworldwide<strong>Current</strong> Online Water Quality Monitoring Methods <strong>and</strong> Their Suitability for the Western CorridorPurified Recycled Water Scheme Page 40
CompanyNameYSIHANNAInstrumentsMettlerToledoGreenspanWebsitehttps://www.ysi.com/http://www.hannainst.com/www.mt.comhttp://www.tycoflowcontrol.com.au/TES_Greenspan_Analytical/products/aqualabWater QualityParameterFree ChlorineToxicityBODCODProfessionalPlus:AmmoniaConductivityDissolvedOxygenNitrateChlorinepHTemperatureTDSpHChlorine, FreeChlorine, TotalTemperaturepHThornton770MAX:DissolvedOxygenpHTOCTemperatureAquaLab:NitrateAmmoniaPhosphorus,TotalNitrogen, TotalTOCMeasurementRange0.05-20 mg/L0-100%20-100000mg/L10-10000 mg/LDepends onapplicationDepends onapplication0-50 mg/l0-10 mg/l0-14-5/+70 °CDepends onapplication0.00-14.000.00-5.00 mg/L0.00-5.00 mg/L5.0-75.0 °C0.00-14.00-100%-1.00-150.05-1000 ppb-40/200 °C0.1-14 mg/L0-14 mg/L0.1-3 mg/L0-7 mg/L0-50 mg/L0-2000 µS/cmMatrixSuitabilityB2B2B2C, B6-7B2C, B6-7B2B2C, B6-7B2, B6-7B2, B6-7B2, B6B2C, 6 – 7B2Reliability <strong>and</strong> maintenance-frequency of calibrationOnlineOnline/In-lineOnline/In-lineOnline/In-lineOnline/In-lineOnline/In-lineOnline/In-lineOnline/In-lineOnlineMeasurementPrincipleAmperometricBiosensorDilution ratiorequire to maintainoxygenconsumptionOzone sensorOpticalCadmium redn.IonisationPotentiometricAmperometricAmperometricThermistorB 2 – 7 Online GalvanicPotentiometricUV oxidationThermistorB6-7 Online, self-calibratingISEISEColorimetricColorimetricNon-dispersive IRMaintenance/WarrantyTough, Smart,VersatileWarrantyInstrument: 3aField Cables: 2aSensor: 1aMeasures evenin worstwaste<strong>water</strong>conditionsAccreditationKnown worldwideGlobal presenceMeasurement inthe Everglades<strong>Current</strong> Online Water Quality Monitoring Methods <strong>and</strong> Their Suitability for the Western CorridorPurified Recycled Water Scheme Page 41
CompanyNameRAESystemss::canAquaDiagnosticAppliTekWebsitehttp://www.raesystems.eu/http://www.s-can.at/http://www.aquadiagnostic.com/http://www.applitek.comWater QualityParameterConductivityDissolvedOxygenpHTemperatureTurbidityVOC (VolatileOrganicCarbon)Full WaterQualityMonitoringStationIncludes:TSS/TS/MLSS,UV 254/SAC,Colour, COD,BOD, NO3,NO2, H2S,NH4, K+, pH,ORP, O2,Conductivity,Temperature,Hydrocarbonalarm,Industrialemission alarmPeCOD P100:CODHeavy MetalsZn, Cd, Pb, As,Hg, Fe, CrMeasurementRange2-120-2000 NTUMatrixSuitabilityReliability <strong>and</strong> maintenance-frequency of calibrationMeasurementPrincipleGalvanicPotentiometricPhotometric0-15000ppm B1-2 Real-time PhotoionizationDetector (PID),MiniRae3000Depends onthe application0.2-350 ppmDilution
Appendix 2: Review of Research Developments for Contaminants of ConcernReferenceDurrieu, C et al. (2006). EuropeanPhysical Journal – Applied Physics,36 (2): 205-209Zhu S et al. (2006). Rare MetalMaterials <strong>and</strong> Engineering, 35: 381-384Men H et al. (2005). Sensors <strong>and</strong>Actuators B, 110:350-357Rudnitskyaya A et al. (2001). Talanta,55:425-431Xie X et al (2004). Sensors <strong>and</strong>Actuators B, 97:168-173Prestel H, Gahr A <strong>and</strong> Niessner R(2000). Fresenius J Anal Chem,368:182-191Tercier-Waeber M et al. (1999).Measurement Science <strong>and</strong>Technology, 10(12) :1202-1213Contaminants ofConcernHeavy Metals <strong>and</strong>PesticidesHeavy MetalsZn 2+ , Cd 2+ , Pb 2+ , Cu 2+ ,Fe 3+ , Cr 3+Heavy MetalsFe, Cr, Mn, As, Zn, Cd, Pb,CuHeavy Metals, Inorganicions <strong>and</strong> alkali cationsCu 2+ , Zn 2+Mn 2+ , Fe 3+ , Ca 2+ , Mg 2+ ,Na + , Cl - ,SO 2- 4Heavy MetalsCd <strong>and</strong> PbHeavy MetalsCd 2+ , Ni 2+ , Cu 2+Heavy MetalsCu (II)Pb (II)Cd (II)Mn (II)Zn (II)<strong>Current</strong> Online Water Quality Monitoring Methods <strong>and</strong> Their Suitability for the Western CorridorPurified Recycled Water Scheme Page 43NotesBiosensors –chlorophyll fluorescence or enzyme (phosphatase <strong>and</strong> esterase) inhibition were used to detectpresence of toxic heavy metals <strong>and</strong> pesticides in aquatic samples.Results with whole-cell biosensors show these devices are sensitive to heavy metals <strong>and</strong> pesticides- The system allows the cells to operate in <strong>their</strong> natural environment which favours long term stability <strong>and</strong> reflectsthe toxic action mechanism therefore providing an ecological interest.- Real-time detection <strong>and</strong> <strong>online</strong> <strong>monitoring</strong> possibleElectronic tongue – uses a microelectrode array <strong>and</strong> differential pulse voltammetry with ppb level of detection.Electronic tongue – made from multiple light addressable potentiometric sensors (MLAPS) <strong>and</strong> two groups ofelectrochemical electrodes.MLAPS are based on chalcogenide thin film for simultaneous detection of Fe (III) <strong>and</strong> Cr(VI) while two groups ofelectrochemical electrodes detect other heavy metals.The electrodes used in this method are non-selective.Specific st<strong>and</strong>ards <strong>and</strong> buffers required for measurement of different ions.Electronic tongue- array of non-specific potentiometric chemical sensors for <strong>monitoring</strong> heavy metals in ground<strong>water</strong>. 13 PVC membranes <strong>and</strong> 12 solid state membranes.No reagents used. The lowest errors of content determination (0.7% for Cu; 0.7% for Zn; 1,1% for Fe(III), 3.6%for Ca; 5.7% for Mg; 2.8% for SO4; 4.5% for Na; 4.7% for Cl) were obtained using responses of all 25 sensors inthe array during signal processing.Electronic tongue- based on iridium ultramicroelectrode arrays <strong>and</strong> square wave anodic stripping voltammetry(SWASV), trace concentration of heavy metals like Pb <strong>and</strong> Cd in aqueous solution could be successfullydetermined at ppb levels. Buffers <strong>and</strong> pH adjustment required for measurements. Results are reasonable forppb detection.Electronic tongue using fibre optic sensors.Developed for <strong>monitoring</strong> dissolved heavy metals in ground <strong>and</strong> surface <strong>water</strong>. The sensor consists of 5 sensingmodules <strong>and</strong> measures the excitation using a Nitrogen Laser ( = 337.1 nm) <strong>and</strong> a detection module containing aspectrograph with a CCD camera.Heavy metals need to be controlled in aqueous matrix with negligible concentration of other ionic pollutants.Further information is required about matrix effects. This may be a problem in sewage samples or varying <strong>water</strong>matrices.Voltammetric sensor array comprised of gel integrated microsensor array was used for in situ profilingmeasurements of surface <strong>and</strong> ground <strong>water</strong>s.It allows high spatial resolution <strong>and</strong> profile measurements at the sediment-<strong>water</strong> interface.
ReferenceDelahaye, E et al. (2003). WaterResearch, 37: 3689-3698Stewart-Pullaro J et al. (2006).Journal of Applied Microbiology, 101:1015 -1026Rogers K (2006). Analytica ChimicaActa, 568: 222-231Horsburgh A et al (2002). Biosensors& Bioelectronics, 17:495-501Van Poucke, S <strong>and</strong> Nelis H (2000).Journal of Applied Microbiology, 3:390-396Straub T <strong>and</strong> Ch<strong>and</strong>ler D (2003).Journal of Microbiological Methods,53: 185-197Rudnitskaya A <strong>and</strong> Legin A (2008). JInd Microbiol Biotechnol, 35:443-451Contaminants ofConcernMicroorganismsTotal <strong>and</strong> thermoresistantcoliforms <strong>and</strong> enterococciF + RNAMicrobial AnalysesHeavy MetalsPhenols <strong>and</strong> Endocrinedisrupting CompoundsVOCsMicroorganisms/ ToxicityBacteriaE. coliPathogensMicroorganismsNotesPresence of microorganisms can be measured rapidly using titration of adenosine triphosphate (ATP) bybioluminescence- A new extraction <strong>and</strong> titration system of bacterial ATP has been tested in the Paris drinking <strong>water</strong> distributionnetwork.Conclusion:- There is a linear relationship between log [ATP] <strong>and</strong> log(HPC-R2A/ml) quick method by detecting positive, microbial compounds in waste <strong>water</strong> gives evidence about <strong>water</strong> <strong>quality</strong> This may be a potential option for PRW system; however the stability of reagents <strong>and</strong> sample pre-treatmentneeds to be refined for it to be viable in the field.Coliphages have been used as indicators for faecal contamination, sewage contamination, <strong>and</strong> enteric viruscontamination in environmental <strong>water</strong>s Use of F + RNA coliphages typing for MST appears advantageous because it is simple, rapid <strong>and</strong> inexpensivecompared to other <strong>methods</strong> no continuous, real-time <strong>methods</strong> with suitable accuracy are currently available on the marketA suite of biosensors have been developed that have applications suitable for the PRW system. The employvarious measurement principles e.g. an in-line immunosensor system for measuring a wide range of pesticides,endocrine disrupting compounds <strong>and</strong> industrial pollutants. However biosensors in <strong>their</strong> current form still tend tosuffer from biofouling <strong>and</strong> are susceptible to matrix effects. Until they have operational characteristics similar to apH sensor in terms of durability, selectivity <strong>and</strong> concentration range, they will not be suitable for autonomous,real-time data acquisition in the context of a PRW closed loop system. This is due to high maintenance costs in<strong>their</strong> current form.Review of potential biosensors for <strong>online</strong> toxicity testing with applications for <strong>water</strong> <strong>quality</strong> <strong>monitoring</strong>. Discussessimple toxicity testing <strong>and</strong> more complex fingerprinting techniques. The biosensor was based on E-coli <strong>and</strong> wasused to assess the toxicity of a range of pollutants such as Zn, Cu, 3,5 DCP, Benzene. The pollutants assessedwere IPR contaminants of concern for WCRW project.Toxicity fingerprints were highly sensitive to different effluents <strong>and</strong> differently shaped profiles.Describes method measuring the number of E. coli present in drinking <strong>water</strong>. The method is based on solidphase flow cytometry <strong>and</strong> two-step enzymatic labelling. Results were similar to those measured byepifluorescence microscopy.Discusses potential <strong>methods</strong> that could be used for rapid detection of pathogens.Methods range from <strong>online</strong> sample processing <strong>and</strong> purification to DNA micro array technologies. Reviewschallenges facing pathogen detection such as pathogen size, expected pathogen concentrations in <strong>water</strong> (e.g.require larger volume of sample for analyses), matrix effects. Before rapid pathogen analysis can be achievedrequire more fundamental research in improved sample extraction, purification, eliminating PCR from analyticalprocess <strong>and</strong> optimising the sensitivity.Evaluates sensor system, electronic tongues <strong>and</strong> noses <strong>and</strong> <strong>their</strong> potential for <strong>monitoring</strong> biotechnologicalprocesses. Evaluates problems with <strong>online</strong> sensors. For example it discusses an electronic tongue based onpulsed voltammetry <strong>and</strong> potentiometric sensors for discriminating between different types of yeast <strong>and</strong> bacteria.However problems with drift, sensor fouling, stability, reproducibility <strong>and</strong> calibration need to be further addressedbefore the systems can become more applicable.<strong>Current</strong> Online Water Quality Monitoring Methods <strong>and</strong> Their Suitability for the Western CorridorPurified Recycled Water Scheme Page 44
ReferenceGutirrez M et al. (2008). InternationalJournal of Environmental AnalyticalChemistry, 88: 103-117Brown M.A <strong>and</strong> Emmert G. (2006).Analytica Chimica Acta, 555 :75-85Chellam S <strong>and</strong> Krasner S (2001).Environ.Sci.Technol, 35: 3988-3999Cancho B <strong>and</strong> Ventura F (2005).Global NEST Journal, 7 (1): 72-94Contaminants ofConcernInorganic parametersPotassium, sodium <strong>and</strong>chlorideTrihalomethanes (THMs)a) CHCl 3 (chloroform)b) CHBr 3(bromodichloromethane)c) CHBr 2 Cl(chlorodibromomethane)d) CHBr 3 (bromoform)THMsHaloacetic Acids (HAAs)THMsNotesElectronic tongues based on arrays of potentiometric sensors <strong>and</strong> complex data processing by artificial neuralnetworks <strong>and</strong> data transmission by radiofrequency.Tested using a system simulating real conditions in surface <strong>water</strong>, performed simultaneous <strong>monitoring</strong> ofammonium, potassium, sodium, chloride, <strong>and</strong> nitrate ionsConclusion:- The proposed system allows assessing the effect of natural biodegradation stages for these species.- A second application was to monitor concentrations of ammonium, potassium, <strong>and</strong> sodium in the 'IgnacioRamirez' dam (Mexico). The electronic tongue allowed determination of K + , Na + , Cl - in real samples RF communications worked robustly, thus demonstrating the viability of the proposed systems for automatedremote applications.Online <strong>monitoring</strong> of trihalomethane concentrations in drinking <strong>water</strong> distribution systems using capillarymembrane sampling-gas chromatography with electron capture detection.- <strong>methods</strong> provide good accuracy, precision <strong>and</strong> level of precision- <strong>methods</strong> not economically feasible for continuous <strong>online</strong> <strong>monitoring</strong>Chen <strong>and</strong> Her [8] – built a continuous flow P&T-GC-mass spectrometer (MS) for <strong>monitoring</strong> THMsWang et al. [9] used a laboratory head space unit attached to a GC-ECDLopez-Avilia et al. [11] used membrane introduction mass spectrometry (MEVIS) to monitor THM concentrations.-ideal analytical method, needs a sampling rate of 1 per hour, operating range of 0.5 to 5 ug/L means recovery of100+/- 5% with an RSD +/-10 %. It would exhibit minimal interference from TOC concentrations of 10-20 mg/L.Trialled DOC <strong>and</strong> SUVA to determine disinfection by-products in nanofiltered <strong>water</strong>s. There were found to besignificant <strong>and</strong> positive correlations between DOC <strong>and</strong> SUVA for both THMs <strong>and</strong> HAAs. The method showspromise for filling data gaps when information is required in real-time.Evaluates different <strong>methods</strong> for <strong>monitoring</strong> a number of disinfection by products. The majority of <strong>methods</strong> requireselective detectors for trace detection employing techniques such as gas chromatography <strong>and</strong> ionchromatographyThere are three <strong>methods</strong> proposed for the <strong>online</strong> <strong>monitoring</strong> of HAA.a) Nicotine-fluorescence flow injection analysisb) Anion chromatography with membrane suppressed conductivity detectionc) Post-IC column NCA-FlowMost <strong>methods</strong> employ traditional <strong>methods</strong> of calibration <strong>and</strong> required skilled technicians, <strong>suitability</strong> forcontinuous, simple <strong>monitoring</strong> <strong>and</strong> detection is still to be determined.<strong>Current</strong> Online Water Quality Monitoring Methods <strong>and</strong> Their Suitability for the Western CorridorPurified Recycled Water Scheme Page 45
ReferenceIsaji C (2003). Water Science <strong>and</strong>Technology, 47 (9):15-23Miro et al (2004). Talanta, 62:1-15Moisello L, et al. (1998). J.Agric.Food Chem, 46: 3847-3851Contaminants ofConcernPhysicochemicalParametersOrganics <strong>and</strong> inorganicsTHM estimationColiformsHardnessBODAmmoniaGeneral Water QualityParametersAnionic Compounds,Halogenated, Sulphur <strong>and</strong>metalloid speciesPesticidesAtrazine <strong>and</strong>TerbuthylazineNotesDeveloped a method for estimating trihalomethanes for DPB control. Also suggest a number of physicochemicalparameters that can be used as surrogate measures for a number of difficult to measure <strong>water</strong> <strong>quality</strong>parameters.Turbidity – an important factor for effective control of chlorine residual, also important for underst<strong>and</strong>ing particleremoval <strong>and</strong> effectiveness of measures against chlorine resistant pathogenic protozoa e.g. CryptosporidiumFound the following correlations (t: total, d:dissolved)Water temperature – DO, d-Mn, StreptococcusTurbidity – Colour, t-Fe, d-Fe, d-Al, t-Ti, coliform groupConductivity- Ca, Na, Mg, K, HCO 3 , Cl, SO 4 , Hardness, Sr, Ba, Li, B, F, Si, NH 4 -N, NO 2 -N, BODItems not correlated: t-Zn, t-MnInvariable: pH, NO 3 -N, NO 2 -NNot detected: Trace organic substances, Heavy metalsInvestigates a number of flow injection techniques for in situ <strong>and</strong> <strong>online</strong> <strong>water</strong> <strong>quality</strong> analysis: pH, alkalinity, totalionic concentration, conductivity, DO, BOD <strong>and</strong> COD were good parameters for the assessment of <strong>water</strong> <strong>quality</strong>using cheap <strong>and</strong> effective analytical sensors.DO – good indicator presence or organic matter, biological treatment efficiencies <strong>and</strong> toxicityPolluting potential of organic matter - COD <strong>and</strong> BODConductivity – ionic strength of the sample.pH – UV-Vis through phenol red indicator.Sulphate – indicator of <strong>water</strong> pollution <strong>and</strong> acidity.Suphide – product of oxidation. Highly toxic to most aquatic organisms.Most <strong>methods</strong> are not suitable for direct in-situ analysis without reagents or calibration. The reliability of theproposed techniques for long-term sensor deployment is also questionable.Require rapid <strong>and</strong> reliable <strong>methods</strong> for real-time <strong>monitoring</strong> of pesticides <strong>and</strong> other organics micropollutants in<strong>water</strong> samplesnew dipstick assay for terbuthylazine <strong>and</strong> atrazine using monoclonal antibody (P6A7)- measurement principle based on reaction between pesticide <strong>and</strong> enzyme tracer for binding the membranecoatedspecific monoclonal antibody <strong>and</strong> involves a change in colour intensity at 657 nm. Although results arepromising, it is still designed for laboratory based measurements, <strong>and</strong> thus is not suitable for real-time processcontrol.<strong>Current</strong> Online Water Quality Monitoring Methods <strong>and</strong> Their Suitability for the Western CorridorPurified Recycled Water Scheme Page 46
ReferenceRodriguez-Mozaz S et al. (2004).Journal of Chromatography A,1045 :85-92Cortina M et al (2007).Electroanalysis, 20 (1):54-60Eaton A <strong>and</strong> Briggs M (200x). NDMA-Analytical Methods Options for a newDisinfection By-Product, MontgomeryWatson Laboratories, Pasadena, CA91101Comparison of alternativeNitrosamine analyses for <strong>water</strong> reusesamples, Cheng. R <strong>and</strong> Andrews-Tate C, Hwang C, Guo Y, Grebel J<strong>and</strong> Suffer I, Funded by Water ReuseFoundationDavi M <strong>and</strong> Gnudi F (1999). WaterResearch, 33 (14) : 3213-3219Contaminants ofConcernEstrogens, Pesticides <strong>and</strong>Bisphenol APesticidesNDMANitrosamine (IncludingNDMA)Phenolic CompoundsNotesA multi-residue measurement system for classes of endocrine disrupting compounds has been developed e.g.estradiol, estrone, estriol, estradiol-17-glucuronide, estradiol diacetate, estrone-3- sulphate, ethynyl estradiol,diethylstilbestrol, atrazine, simazine, desethylatrazine, isoproturon, diuron, bisphenol A.Method uses a pre-concentrated LiChrolut RP-18 cartridge, followed by HPLC-MS analysis using APCI forpesticides <strong>and</strong> electrospray negative ionisation for estrogens <strong>and</strong> bisphenol A.It is not possible to monitor every substance in surface <strong>water</strong>; however it is necessary to define major targetareas of focus for effective barrier protection. Surface <strong>water</strong> chemistry exhibits changing chemistry <strong>and</strong>composition depending on environmental conditions.A single method of analysis for different classes of selected analytes would reduce the costs <strong>and</strong> time necessaryfor routine <strong>water</strong> <strong>quality</strong> analysis.Within the treatment process, it was found that the concentration of bisphenol A decreased progressively througheach treatment step. Study by these authors found that Bisphenol A was below the quantification limit.It is hypothesised that these variations also exist in the sewer catchmentUses amperometric sensor array combined with ANNs to determine pesticides in aqueous solutions. It wasevaluated on in river <strong>water</strong> before <strong>and</strong> after sewage treatment, <strong>and</strong> gave good results with low error. It showspotential for <strong>monitoring</strong> pesticides in the PRW system.-The original analytical method was developed by the Canadian Ministry of Environment (MOE) using solid phaseextraction technique with an Ambersorb resin, followed by isotope dilution GCMS. However many new <strong>methods</strong>have been developed to improve its reliability, sensitivity <strong>and</strong> simplicity. However there are no <strong>methods</strong> thatcurrently provide real-time continuous information on NDMA, which is required for the PRW system. The<strong>methods</strong> are still laboratory based <strong>and</strong> require calibration <strong>and</strong> st<strong>and</strong>ard reagents.- Report is an interlaboratory study which evaluated 5 <strong>methods</strong> for 8 types of nitrosamines including NDMA foraccuracy in different matrix types. Methods include :a) Micro Liquid-Liquid Extraction (MLLE)b) Ambersorb Solid Phase Microextraction (SPME) GC/MSc) Ambersorb Solid Phase Extraction (Amb SPE)d) Liquid-Liquid Extraction (LLE)Solid phase microextraction (SPME) is a low-cost method, however was not included in round robin testing.Results indicated that the Amb-Envi SPE <strong>and</strong> Amb SPE <strong>and</strong> traditional LLE (coupled with GC/MS) detectedNDMA at the minimum level of 2 ng/L <strong>and</strong> other nitrosamines between 2 <strong>and</strong> 4 ng/L.Phenolic compounds are problematic in drinking <strong>water</strong> due to <strong>their</strong> toxicity. Bisphenol A <strong>and</strong> somepolychlorinated biphenyls have the ability to mimic the activity of oestradiol.Method developed by EEC 75/440 determines total phenol using condensation with 4-aminoantipyrine in thepresence of potassium ferricyanide to form a coloured dye. However the method does not provide information onthe nature of the phenol. Interfering substances can also affect accuracy of the analysis.HPLC or GC-MS is more accurate <strong>and</strong> allows identification of individual phenolic compounds in the <strong>water</strong> matrixat low concentration. Precision <strong>and</strong> accuracy is also desirable.Chloro- <strong>and</strong> nitro-phenols listed in the EPA Federal Register, analysed by GC-MS by single ion <strong>monitoring</strong> (SIM)have rarely been detected <strong>and</strong> if so at levels less than 1 ug/L.There are no suitable rapid means of analysis.<strong>Current</strong> Online Water Quality Monitoring Methods <strong>and</strong> Their Suitability for the Western CorridorPurified Recycled Water Scheme Page 47
ReferenceGibson R et al. (2007). Journal ofChromatography A, 1169:31-39Hao R et al. (2008)Chemosphere, 70:783-790Wang X et al. (2006). AnalyticaChimica Acta, 556:313-318Wong K et al. (1997). Biosensors <strong>and</strong>Bioelectronics, 12 (2):125-133Latif M <strong>and</strong> Licek E (2004). EnvironToxicol 19:302-309Carvalho E et al (2006). SensorLetters, 4(2) :129-134Contaminants ofConcernAcidic Pharmaceuticals<strong>and</strong> Endocrine DisruptingCompoundsNonylphenolBisphenol AToxicityToxicity – Microbial TestsProtoxkit F TM (Protozoa)Daphtoxit F TM magna(Microalgae)Thamnotoxkit F TM(Crustaceans)Ostracodtoxkit F TM (HigherPlant)ChloroformNotes-Developed a simple extraction method for these two groups in untreated waste<strong>water</strong>s <strong>and</strong> spring <strong>water</strong>. It isbased on the separation of two classes during elution from an extraction cartridge with final analysis by GC-MS.Detection Limit – 0.005 to 1 ng/L in spring <strong>water</strong> <strong>and</strong> 0.5 to 100 ng/L for waste<strong>water</strong>LC is well suited to polar compounds <strong>and</strong> non-volatile compounds.Methods are still not simple <strong>and</strong> require calibration. The instruments are also relatively expensive. Model used to describe nonylphenol accumulation in waste<strong>water</strong> effluent used in a <strong>water</strong> recycling systembased on number of recycling processes, NP removal efficiency <strong>and</strong> NP accumulation factor.It was found that NP concentrations increased with number of cycles through waste<strong>water</strong> recycling processes –suggests there should be a maximum waste<strong>water</strong> recycling ratio.Recommended that a study of NP accumulation should be conducted on the site. Indicates that real-timeinformation is required.A bifurcated fibre optical chemical sensor for real-time <strong>monitoring</strong> of BPA was developed. Uses fluorescencequenching of pyrene/dimethyl -cyclodextrin complex immobilised in a plasticised PVC membrane as a indicatorprobe.For continuous <strong>monitoring</strong> no separation processes such as Chromatography should be used. Therefore thismethod shows promise for the PRW project..Rapid tests are important for assessing changes in <strong>water</strong> <strong>quality</strong>, especially in regards to discharges of toxicmaterials. Oxygen uptake is the most acceptable parameter for <strong>monitoring</strong> the toxicity of heavy metals toactivated sludge, <strong>and</strong> it has been employed <strong>online</strong>.Although DO electrode is easy to calibrate <strong>and</strong> obtains rapid response, it requires electrical connection <strong>and</strong>electrode fouling, which can cause measurement errors.An alternative is the oxygen optode based on the quenching of luminescent dyes. The method has severaladvantages over electrodes. It has a short response time, high sensitivity <strong>and</strong> nil consumption of oxygen. Use offibre optics means that there is no connection between the oxygen sensing surface <strong>and</strong> the detector.It uses oxygen sensing film, LED <strong>and</strong> fibre optics, <strong>and</strong> measures the emission at 610 nm, when it is irradiated at460 nm.Used the optode to measure DO versus time in the presence of different heavy metals. It was found thatactivated sludge responded with different toxicity patterns to different heavy metal concentrations.Investigates a number of microbial tests for assessing the toxicity of waste<strong>water</strong> <strong>and</strong> sediments in Austria todetermine which ones are more sensitive.It evaluates the potential <strong>and</strong> limitations of the microbial tests.Concludes that performing a number toxicity tests may not be practicable from a cost perspective.Interdigitated gold-coated microelectrodes were covered with various conducting polymers to develop a sensorarray. Their impedance was measured at a fixed frequency of 1000 Hz, which allowed simple acquisition ofinformation.Limit of detection 0.01 mg/L<strong>Current</strong> Online Water Quality Monitoring Methods <strong>and</strong> Their Suitability for the Western CorridorPurified Recycled Water Scheme Page 48
ReferenceBohrer F et al (2008).J.AM.CHEM.SOC, 130:3712-3713Ishihara S et al. (2005). Anal. Chem,77:7908-7915Contaminants ofConcernHydrogen PeroxideNotesH 2 O 2 vapours may be detected selectively by contrasting oxidation/reduction behaviour on nanoscalechemiresistive films of monolayer protected nanoclusters (MPC). EPR studies of optically excited ZnPc solutionsrevealed presence of OH radicals, suggesting homolytic cleavage of H 2 O 2Caffeine <strong>and</strong> taste Development of an electronic tongue based on determining the eight major taste-causing substances: Na + , K + ,Cl - , H + , sucrose, glucose, glutamate <strong>and</strong> caffeine.Patterns were analysed using a two-phase optimized radial basis function network (RBFN).Electrodes for the sensor arrays were: capillary ISEs for Na + , K + , Cl - , a Pt/IrO2 electrode for pH; PFCE modifiedwith enzymes <strong>and</strong> HRP-Os polymer for glucose, sucrose <strong>and</strong> glutamate; <strong>and</strong> ECR-sputtered carbon electrode forcaffeine.Escher B et al. (2008). Journal ofEnvironmental Monitoring, 10 (5):622-631Wang Z et al. (2007). Spectroscopy<strong>and</strong> Spectral Analysis, 27 (11) : 2321-2324Herbicides/non-volatilecompoundsOrganic Pesticides- A mode-of-action based test battery of low-complexity <strong>and</strong> in-vitro bioassays can be used as a routine<strong>monitoring</strong> tool for sewage treatment efficiency <strong>and</strong> <strong>water</strong> <strong>quality</strong> assessment- field studies were undertaken at a sewage treatment plant (STP). Samples were collected under dry <strong>and</strong> rainy conditions None of the bioassays gave positive results with raw <strong>water</strong> in whole effluent toxicity testing Therefore <strong>water</strong> samples from various sites during waste<strong>water</strong> treatment <strong>and</strong> from surface <strong>water</strong> wereenriched using solid- phase extraction. focus was on non-volatile compounds of average to moderate hydrophobicity, a range that includes mostpesticides, biocides <strong>and</strong> pharmaceuticals.Conclusion:- With the bioassay data the treatment efficiency of the STP can be assessed with respect to different modes oftoxic action <strong>and</strong> accordingly different groups of micropollutants- Treatment efficiency was high (typically over 90%) but varied from bioassay to bioassay (detection of differenttypes of micropollutants), so no expectation of a common answer. system itself is relatively complicated <strong>and</strong> expensive to commission or even modify for the AWTPs- The molecular structures of a few common pesticides such as carbamate, benzoylurea <strong>and</strong> fungicide wereanalysed, <strong>and</strong> the mechanism of fluorescence generation was ascertained.- a steady-state fluorescence spectrograph was used with st<strong>and</strong>ard solutions of these pesticides to obtainfluorescence spectra, <strong>and</strong> <strong>their</strong> fluorescence characteristics were analysed.Conclusion:- Carbamate, benzoylurea <strong>and</strong> fungicide pesticides emit strong fluorescence when excited by UV in a particularsolvent, <strong>their</strong> fluorescence spectra are distinct, <strong>and</strong> the resolution is fine.- As a result, it is feasible to carry out qualitative <strong>and</strong> the quantitative analysis of these pesticides by fluorescencespectral analysis. Method seems capable to assure <strong>water</strong> <strong>quality</strong> <strong>monitoring</strong>, but it has to be proved whether it can be applied inAWTP<strong>Current</strong> Online Water Quality Monitoring Methods <strong>and</strong> Their Suitability for the Western CorridorPurified Recycled Water Scheme Page 49
ReferenceHu Y et al (2008). Talanta, 74(4) :760-765Solna, R et al. (2005). Talanta, 65(2): 349-357Shin Kim et al. (2005). Sensors <strong>and</strong>Actuators B, 108: 285-291De Melo et al. (2005).Sensors <strong>and</strong>Actuators B, 348-354Shin Kim Y <strong>and</strong> Seok Yang (2007).Sensors <strong>and</strong> Actuators B, 121: 507-514Kessick R <strong>and</strong> Tepper G (2006).Sensors <strong>and</strong> Actuators B, 117: 205-210Contaminants ofConcernHydroxyl RadicalsPhenols <strong>and</strong> PesticidesVOCsVOCVOCVOCNotes- Description of a simple method to electrochemically detect hydroxyl radicals- The (OH)-O• is generated by the Fenton reaction from iron (II) sulphate <strong>and</strong> hydrogen peroxide in a phosphatebuffer solutionConclusion:- Method detects (OH)-O• with high sensitivity without any separation process- The differential pulse voltammetric responses show a linear dependence on the concentration of (OH)-O• a simple, inexpensive <strong>and</strong> promising method- Immobilization substrates for electrodes were tyrosinase, peroxidase, acetylcholinesterase,butyrylcholinesterase measuring inhibition by pesticides: acetylthiocholine chloride as substrate for cholinesterases determining phenols: hydrogen peroxide as co-substrate for peroxidaseResults:- detection of p-cresol, catechol, phenol <strong>and</strong> pesticides including carbaryl, heptenophos, fenitrothion in a flowthrough<strong>and</strong> steady-state system- evaluation of effect of heavy metals (Cu 2+ , Cd 2+ , Fe 3+ ), fluoride (NaF), benzene <strong>and</strong> dimethylsulphoxide oncholinesterase activities- electrodes modified with hydrolases <strong>and</strong> oxidoreductases can function in the same arrayConclusion:Showed that simultaneous analysis was feasible, with a small degree of cross-sensitivity. Complexity of realsamples gives non-linear responses of biosensor array. Alternative data analysis using principal componentanalysis <strong>and</strong> other chemometric <strong>methods</strong> is a possibility. Not yet a commercial product, but could be worthtrialling in PRW scheme.Electronic nose for detecting VOC. It uses an array of carbon black-polymer composites <strong>and</strong> pattern recognitiontechniques. Was able to classify different types of whiskeys.Electronic tongue using conducting polypyrrole chains for determining the presence of VOC. The polymer mix isimbedded on conducting ITO glass substrates. The sensors exhibited good sensitivities towards methanol,ethanol, benzene <strong>and</strong> carbon tetrachloride.Electronic nose developed using 4 different carbon black-polymer composite sensors in addition to a temperaturesensor. The sensor array measured the chemoresistive response acquired through a voltage circuit.Electronic nose based on electrospun polymer composite fibre arrays identify VOCs. It could quantitativedetermine the concentration of tow organic solvents, one alcohol <strong>and</strong> one chemical welfare agent. The <strong>methods</strong>hows potential.<strong>Current</strong> Online Water Quality Monitoring Methods <strong>and</strong> Their Suitability for the Western CorridorPurified Recycled Water Scheme Page 50
Urban Water Security Research Alliancewww.urban<strong>water</strong>alliance.org.au