Polygon Worksheet
Polygon Worksheet
Polygon Worksheet

Create successful ePaper yourself
Turn your PDF publications into a flip-book with our unique Google optimized e-Paper software.
<strong>Worksheet</strong>sLiftCalculating MitigationLossesVersion 4.1These worksheets are provided for optional use. The purpose is to provide aconsistent approach in calculating compensatory mitigation and to provide arecord of evaluation. These worksheets are based on the Joint State/FederalMitigation Bank Review Team Process for Florida, Operational DraftOctober 1998.
ChangesVersion 4.0 First release to general publicVersion 4.1a. Replaced Temporal Factor Table version 4.0 with new sheet,numbered Version 4.2 and minor correction in accompanying text.b. Replaced Risk <strong>Worksheet</strong> version 4.0 with version 4.1.
General GuidanceProject <strong>Worksheet</strong> (J). At least one for any single project. This sheettallys all of the polygons. If more than six polygons, will have several pagesof project worksheets. Calculates the total number of Units.<strong>Polygon</strong> <strong>Worksheet</strong>(P). One individual polygon worksheet for eachindividual impact and mitigation activity. Calculates the Units per Acre forthat activity.WRAP <strong>Worksheet</strong> (W). For any single polygon, will have at least oneWRAP worksheet. May have up to three WRAPS depending upon nature ofactivity. WRAP is performed for (1) Existing Condition; (2) With ProjectCondition; (3) Without Project Condition. If a functional assessment otherthan WRAP is used, then use a worksheet appropriate to that assessment.The scores from the WRAP worksheet are copied to the <strong>Polygon</strong> <strong>Worksheet</strong>.Risk <strong>Worksheet</strong> (R) Will have at least one Risk worksheet perproject. That Risk may apply to several polygons, if the activities are similarbetween polygons. The Risk score is copied to the <strong>Polygon</strong> <strong>Worksheet</strong>.Weight <strong>Worksheet</strong> (G) Will have at least one Weight worksheet perproject. The Weighting will typically be the same for all projects in aparticular watershed / basin. If both impact and mitigation sites in the samewatershed, will typically have only one Weight worksheet. If sites indifferent watersheds, will be two Weight worksheets. May be more Weightworksheets if the project includes a wide mix of work,.say one that includesboth cypress and mangrove, sincle will involve various watersheds.Proximity <strong>Worksheet</strong> (X). At least one Proximity worksheet for eachproject. If all mitigation activites are at the same site, then only oneworksheet. If mitigation activities at two or more sites, then two or more<strong>Polygon</strong> worksheets, one for each site. Score copied onto Project worksheet.Temporal <strong>Worksheet</strong> (Table)(T). One will be attached to each projectpackage to show where the number came from. This is a look-up table. Thenumber from the table is copied onto the <strong>Polygon</strong> sheets.
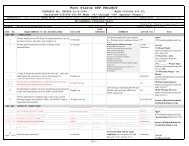
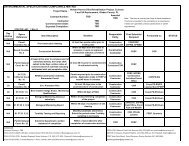
<strong>Polygon</strong> <strong>Worksheet</strong>1. Divide proposed activity into polygons at both impact site and mitigation2. For each polygon you will complete a polygon worksheet3. Enter a identification number in the upper right corner (i.e. P1, P2, P3etc)4. Enter the following:a. Raw WRAP Score – worksheet (W) – convert to decimalb. Weighting <strong>Worksheet</strong> completed (G)c. Temporal loss factor – worksheet (T)d. Risk factor – <strong>Worksheet</strong> (R)5. Result of <strong>Polygon</strong> worksheet (P) is units per acre of lift or loss
<strong>Polygon</strong> <strong>Worksheet</strong> version 4.0 <strong>Polygon</strong> # PP1.0 Description:If this polygon describes an impact activity (that is, not mitigation), then leave sections P2.0 and P4.0 blank.<strong>Worksheet</strong> Wildlife Overstory Ground Up/Wet Hydrology Water Units/Acrecopied from Utilization /Shrub Cover Buffer Quality subtotalsP2.0 "Without Project" Condition. Probable future condition of site if the mitigation is not performed.P2.1 Scores from WRAP Field Data Sheet but converted to decimal (divide raw score by 3.0)WP2.2 Copy Weight Factor from line G8.1 or G8.2 or G8.3 depending on which WRAP is "N/A"GP2.3 Weighted "Without Project" Sub-Score. Multiply line WRAP score by Weight FactorP2.1 X P2.2P3.0 "Existing" Condition. Observed condition of site today.P3.1 Scores from WRAP Field Data Sheet but converted to decimal (divide raw score by 3.0)WP3.2P3.3Same Weight <strong>Worksheet</strong> as P2.2. Copy G8.1 or G8.2 or G8.3 depending on which is "N/A"G see P2.2Weighted "Existing" Sub-Score. Multiply WRAP score by Weight FactorP4.0(P3.1)X( P3.2)"Ex isting" minus "Without" = Units/Acre offunctional LIFT ascribed to preservation of site(P3.3)-(P2.3) + + + + + =PreserveP5.0 "With Project" Condition. For impact, typically WRAP = zero. For mitigation, WRAP = fully grown.P5.1 Scores from WRAP Field Data Sheet but converted to decimal (divide raw score by 3.0)WP5.2P5.3Same Weight <strong>Worksheet</strong> as P2.2. Copy G8.1 or G8.2 or G8.3 depending on which is "N/A"G see P2.2Weighted "With Project" Sub-Score. Multiply WRAP score by Weight FactorP6.0P7.0(P5.1)X(P5.2)"With Project" minus "Existing" = Units/acre of functional LIFT (mitigation) or LOSS (impact)(P5.3)-(P3.3)Temporal Loss Factor "T" copied from the table (separate worksheet) based on YS and YFYS (Year Start)YF (Year Finish)P8.0P9.0T (Table)Risk Factor "R" = 0.90 if 10% of the LIFT (line P6.0) may not occur. Estimate or use worksheet.RLIFT/LOSS X "T" X "R" = Units/Acre functional LIFT/LOSS from construction activity(P6.0)X(T)X(R) + + + + + =Balance
Project <strong>Worksheet</strong>1. Enter a identification number in the upper right corner (i.e. J1, J2, J3 etc)2. Enter that units per acre of lift or loss from polygon worksheet on projectworksheet (Column B)3. On project worksheet, enter acres for each polygon (column B)a. Add Column A plus B times C and enter into:b. Copy number to either:D-1: on-site impact columnD-2: off-site mitigation columnD-3: on-site mitigation column4. Copy Proximity factor from Proximity <strong>Worksheet</strong> for any polygons forwhich you have entered a number in column D-25. Subtotal each column D1 to D36. Find net sum of the 3 columns (add together) and enter on line J3.0a. If impact (D1) equals mitigation (D2 + D3) than the net sum willbe 0; assume appropriate mitigation (always factor in common sense i.e. nodowntown Miami)b. If impact (D1) is greater than the mitigation, than adjust number ofacres in column C until it is balanced.
Project <strong>Worksheet</strong>version 4.0 Project # JJ1.0 Name of Project:If more than 6 polygons: use multiple pages and calculate "Net" on last page.PageofJ2.0 Tally <strong>Polygon</strong>s. If mitigation bank, enter number of credits in column D2 and leave columns A, B and C blank.Add Columns A and B, multiply by Column C, and write result in either Column D1, or D2, or D3 (Choose one only)Cumulative Total Units (if multiple pages):A B C D1 D2 D3Units/Acre subtotals Acres (A+B) X C (A+B) X C Proximity D2 X Prox (A+B) X Ccopied from <strong>Polygon</strong> in the On-Site Off-Site X Factor = Off-Site On-Site<strong>Worksheet</strong> <strong>Polygon</strong> Impact Mitigation from X6.0 Mitigation MitigationPreserve Balance (Units) of Wrksht (Units) (Units)<strong>Polygon</strong> PName:X =<strong>Polygon</strong> PName:X =<strong>Polygon</strong> PName:X =<strong>Polygon</strong> PName:X =<strong>Polygon</strong> PName:X =<strong>Polygon</strong> PName:X ========= ======== ========Subtotals (include previous page(s)): J3.0Net = (Units of Lift) - (Units of Loss) Loss Net Units Lift LiftIf total units of mitigation (Lifts) equal total units of impact (Losses), then the net sum will be zero and projecthas appropriate compensatory mitigation (subject to application of common sense).If net sum is other than zero, then adjust acres of one or more polygons to bring into balance.J4.0 Remarks
Weighting <strong>Worksheet</strong>Purpose is to apply value judgement to individual functions i.e. wildlifeutilization may be of more important to society than their other functions.Would give wildlife more influence on the total score (credits per acre).Assumption: Factors do not always have equal importance in an area.1. Enter a identification number in the upper right corner2. To use, answer 5 questions under G3.0 for each function. Answer willbe 1, 2, or 3. Three is entered for highly valued functions.3. Follow instructions for division or multiplication on form4. You will arrive at a weighting factor that is transferred to polygonworksheet.
Weight <strong>Worksheet</strong>version 4.0 Weight # GG1.0 Name of Geographic Area:G2.0 Description:G3.0 Criteria ScoresWildlifeUtilizationOverstory/ShrubGroundCoverUp/WetBufferHydrologyG3.1 Project results in identifiable ecological benefits to established watershed issues.Yes=3 No=0WaterQualityG3.2 Project will result in identifiable ecological benefits to adjacent lands/waters of regional importance.Yes=3 No=0G3.3 Improves status of federal and/or state listed threatened or endangered or federal candidate species.Increases population = 3 Meets identified tasks in recovery plan = 2Attracts listed species to site = 1 Maintains status quo = 0G3.4 Restores or creates ecological features considered to be unusual, unique or rare in region.Yes=3 No=0G3.5 Special Considerations. Circumstances considered important to weighting.Description:Yes=3 No=0G4.0 Subtotal of ======= ======= ======= ======= ======= =======G3.1 to G3.5G5.0 Total of ColumnsG6.0 Fraction. Divide line G4.0 by line G5.0G4.0 / G5.0G7.0 Multiply line G6.0 by 0.50G6.0 X 0.50G8.0 Weighting Factor. Add either 0.100 or 0.083 to G7.0 depending on which parameter is "N/A" on WRAP score.G8.1 G7.0+0.100N/AG8.2G7.0+0.100N/AG8.3G7.0+0.083G9.0 Note
Temporal Loss <strong>Worksheet</strong>Purpose is to take into account time lag between impact and whenmitigation is totally successful.. Note: This is NOT risk of failure.Assumption: Mitigation area is not 100 percent effective when it isinitially completed.a. Read the definitions on the T <strong>Worksheet</strong> for YS = Year Start of mitigation YF = Year Finished of mitigationb. Note that these years are in relation to year of impact: i.e. if mitigationstarts same year as impact, YS = 0. If mitigation starts after completionof work (2yrs) YS = +2.c. Enter YS and YF on <strong>Polygon</strong> <strong>Worksheet</strong> for each WRAP function i.e.For example, for forested restoration YF for the hydrology functionmay equal 5 (restored in 5 years) versus 40 ( restored in 40 years) yearsfor overstory function. So you need to think about the temporal loss forEACH WRAP function that’s applicable. (Dependent on design,sequencing of mitigation).d. go to table on T <strong>Worksheet</strong> and find the number at the intersection ofthe YF and YS. Enter this number on <strong>Polygon</strong> <strong>Worksheet</strong>)
Temporal Loss Factor "T" version 4.2 T (Table)This table (version 4.2) to be used after 1Dec99. Version 4.0 & 4.1 are obsolete. Version 4.2 based on discount rate of 3%.YS = 0 = Year of Impact [for an individual permit] = Credit Release Year (T R ) [for a mitigation bank]YS = Year Start = the Year the construction/planting work at the compensatory mitigation site starts.(a) If the compensatory mitigation work starts within the same 12 month period as the impact/credit release, then YS = 0.(b) YS = -1 if the compensatory mitigation work starts one year prior to the impact/credit release, YS = -2 if two years prior, etc.(for example, if mitigation starts in 1999 but impact/credit release in 2000, YS = -1)(c) YS = + 1 if the compensatory mitigation work starts one year after the impact/credit release, YS = +2 if two years after, etc.(for example, if impact/credit release in 2000 and mitigation starts in 2001, YS = +1)YF = Year Finish = when the compensatory mitigation achieves the functional capacity that is described by the "with project"functional assessment score. After this year, the compensatory mitigation is expected to stay at or above the "withproject" score either naturally or as the result of arrangements for perpetual management.(a) If the “with project” score is achieved within the same 12 month period as the impact/credit release, then YF = 1.(b) Otherwise, YF = YS + the number of years to reach the "with project" score (for example, if saplings are planted in thesame year as the impact/credit release and the "with project" score is based on 35 years of growth, then YF = 0 + 35 = 35;but, if the saplings are planted two years prior to impact/credit release, YS = -2, then YF = (-2) + 35 = 33).YS= YF= 1 2 3 4 5 6 7 8 9 10 11 12 13 14 15-4 T= 1.0000 0.9944 0.9859 0.9754 0.9639 0.9517 0.9391 0.9266 0.9133 0.9008 0.8878 0.8750 0.8622 0.8496 0.8371-3 T= 1.0000 0.9933 0.9835 0.9719 0.9593 0.9463 0.9330 0.9199 0.9061 0.8931 0.8798 0.8667 0.8536 0.8408 0.8281-2 T= 1.0000 0.9916 0.9802 0.9672 0.9535 0.9396 0.9256 0.9119 0.8976 0.8842 0.8706 0.8571 0.8439 0.8308 0.8180-1 T= 1.0000 0.9888 0.9752 0.9606 0.9458 0.9310 0.9163 0.9021 0.8873 0.8737 0.8598 0.8462 0.8327 0.8195 0.80660 T= 1.0000 0.9833 0.9670 0.9507 0.9350 0.9195 0.9043 0.8899 0.8748 0.8611 0.8471 0.8333 0.8199 0.8066 0.7937+1 T= 0.9665 0.9503 0.9346 0.9187 0.9034 0.8883 0.8736 0.8597 0.8450 0.8318 0.8182 0.8049 0.7918 0.7789+2 T= 0.9340 0.9182 0.9032 0.8876 0.8727 0.8581 0.8438 0.8305 0.8160 0.8033 0.7901 0.7772 0.7645+3 T= 0.9025 0.8871 0.8727 0.8642 0.8429 0.8288 0.8149 0.8021 0.7879 0.7757 0.7629 0.7504+4 T= 0.8718 0.8569 0.8430 0.8280 0.8140 0.8003 0.7868 0.7745 0.7606 0.7489 0.7365YS= YF= 16 17 18 19 20 21 22 23 24 25 26 27 28 29 30-4 T= 0.8248 0.8126 0.8005 0.7887 0.7770 0.7655 0.7541 0.7430 0.7320 0.7212 0.7105 0.7001 0.6898 0.6797 0.6697-3 T= 0.8155 0.8032 0.7910 0.7791 0.7673 0.7557 0.7443 0.7331 0.7221 0.7112 0.7006 0.6901 0.6798 0.6697 0.6597-2 T= 0.8053 0.7928 0.7806 0.7686 0.7567 0.7451 0.7337 0.7224 0.7114 0.7005 0.6899 0.6794 0.6691 0.6590 0.6491-1 T= 0.7938 0.7813 0.7690 0.7570 0.7451 0.7335 0.7221 0.7109 0.6998 0.6890 0.6784 0.6680 0.6577 0.6476 0.63770 T= 0.7810 0.7685 0.7562 0.7442 0.7324 0.7208 0.7094 0.6983 0.6873 0.6766 0.6660 0.6557 0.6455 0.6355 0.6257+1 T= 0.7664 0.7540 0.7419 0.7300 0.7183 0.7068 0.6956 0.6846 0.6737 0.6631 0.6527 0.6424 0.6323 0.6225 0.6128+2 T= 0.7520 0.7398 0.7278 0.7161 0.7045 0.6932 0.6821 0.6711 0.6604 0.6499 0.6396 0.6294 0.6195 0.6097 0.6001+3 T= 0.7380 0.7259 0.7141 0.7024 0.6910 0.6798 0.6688 0.6580 0.6474 0.6370 0.6268 0.6167 0.6069 0.5972 0.5877+4 T= 0.7243 0.7123 0.7006 0.6967 0.6777 0.6667 0.6558 0.6451 0.6346 0.6243 0.6142 0.6043 0.5946 0.5850 0.5756YS= YF= 31 32 33 34 35 36 37 38 39 40 41 42 43 44 45-4 T= 0.6599 0.6503 0.6408 0.6315 0.6224 0.6133 0.6045 0.5958 0.5872 0.5788 0.5705 0.5605 0.5524 0.5465 0.5368-3 T= 0.6499 0.6403 0.6308 0.6215 0.6124 0.6034 0.5946 0.5859 0.5774 0.5690 0.5608 0.5507 0.5427 0.5369 0.5271-2 T= 0.6393 0.6297 0.6203 0.6110 0.6019 0.5930 0.5842 0.5756 0.5671 0.5588 0.5506 0.5405 0.5326 0.5268 0.5171-1 T= 0.6280 0.6185 0.6091 0.5999 0.5909 0.5820 0.5733 0.5647 0.5563 0.5480 0.5399 0.5298 0.5219 0.5163 0.50660 T= 0.6160 0.6066 0.5973 0.5882 0.5792 0.5704 0.5617 0.5532 0.5449 0.5367 0.5286 0.5186 0.5108 0.5053 0.4956+1 T= 0.6032 0.5939 0.5847 0.5757 0.5668 0.5581 0.5496 0.5412 0.5329 0.5248 0.5168 0.5090 0.4992 0.4916 0.4864+2 T= 0.5907 0.5815 0.5724 0.5635 0.5547 0.5461 0.5376 0.5293 0.5212 0.5132 0.5053 0.4976 0.4900 0.4803 0.4729+3 T= 0.5784 0.5693 0.5603 0.5515 0.5428 0.5343 0.5260 0.5178 0.5097 0.5018 0.4940 0.4864 0.4789 0.4715 0.4619+4 T= 0.5664 0.5574 0.5485 0.5398 0.5312 0.5228 0.5146 0.5064 0.4985 0.4907 0.4830 0.4754 0.4680 0.4607 0.4536YS= YF= 46 47 48 49 50 51 52 53 54 55-4 T= 0.5291 0.5216 0.5142 0.5091 0.4998 0.4949 0.4880 0.4813 0.4746 0.4680-3 T= 0.5195 0.5120 0.5047 0.4996 0.4903 0.4856 0.4787 0.4720 0.4654 0.4589-2 T= 0.5095 0.5021 0.4948 0.4898 0.4805 0.4759 0.4691 0.4624 0.4558 0.4494-1 T= 0.4991 0.4917 0.4845 0.4796 0.4703 0.4658 0.4591 0.4524 0.4459 0.43950 T= 0.4882 0.4809 0.4737 0.4690 0.4598 0.4553 0.4487 0.4421 0.4357 0.4293+1 T= 0.4770 0.4696 0.4625 0.4556 0.4511 0.4420 0.4378 0.4314 0.4250 0.4188+2 T= 0.4680 0.4586 0.4516 0.4447 0.4379 0.4338 0.4248 0.4209 0.4146 0.4084+3 T= 0.4548 0.4501 0.4408 0.4341 0.4274 0.4208 0.4169 0.4081 0.4044 0.3983+4 T= 0.4441 0.4372 0.4328 0.4236 0.4171 0.4106 0.4042 0.4006 0.3918 0.3884
Proximity <strong>Worksheet</strong>:Purpose is to take into account distance from impact area to mitigation area.Two components; one based on wildlife and one based on watershed.Assumption: Mitigation is best in the same watershed.a. Enter an identification number in the upper right cornerb. Fish and Wildlife:1) In line X1, answers a series of questions on wildlife. Assign yes or noto each question. Is the guild found on the impact site? (y or n)Question A. Does the location of the mitigation site relative to theimpact site reduce the ability to mitigate for that guild (e.g. impact sitewithin foraging range of woodstork rookery; however mitigation siteis outside that range therefore the answer would be yes - Question B)2) Total the number of yes’s and no’s for each guild. Place number ofeach into block (X2.2)3) In line X2.3, follow instructions for division to determine the fish andwildlife score :c. Watershed (Diminishing Relevance): (Do only if outside waters ofimpact area)1) In line X3.1, enter the name and acreage of the impact site watershed.2) In line X3.2, enter the name and acreage of the mitigation sitewatershed3) In line X3.3, enter names and acreage of watersheds between impactand mitigation site.4) In line X3.4, add watershed acreages.5) In line X3.5, enter the name and acreage of the standardizedmitigation service areas (for individual projects – already defined byState). Banks have own service areas defined.6) In line X3.6, follow instruction for addition and division to determinethe watershed number (WN).d. Final Calculation: Block X3.0. Enter in column X of Project <strong>Worksheet</strong>
Proximity <strong>Worksheet</strong> version 4.0 Proximity #XX1.0 Location of mitigation (place):X2.0 Fish and Wildlife ComponentQuestion A: Is the guild represented at the impact site? Answer either "Yes" or "No" for each guildQuestion B: Does the location of the mitigation site relative to the impact site reduce the ability to mitigatefor that guild? If answer to A is "No", then enter "N/A". If answer to A is "Yes", answer either "Yes" or "No"Question A Question BQuestion A Question BX2.1 GuildsPresent? Reduced?Present? Reduced?Neotropical Migrants: ABReptiles: ABWading Birds:ABFreshwater Fish:ABRaptors:ABSmall Mammals:ABWaterfowl:ABLarge Mammals:ABAmphibians:ABInvertebrates:ABX2.2 Number of yes's for Question B: B1Number yes's for A: A1X2.3 Fish and Wildlife Component Score = FN = B1 divided by A1: FNX3.0 Diminishing Relevance Component. (If mitigation in same watershed as impact: skip steps X3.1 to X3.4 andwrite WN=0.0 in line X3.6. If mitigation bank, use WN from table if Mitigation Bank Instrument includes table.)Name of WatershedsAcresX3.1X3.2X3.3Mitigation site is located within:Impact site is located within:Watersheds separating/between themitigation and impact sites.Size = W1: W1Size = W1: W2Size = W1: W3Size = W1: W4Size = W1: W5X3.4X3.5W1 + W2 + W3 + W4 + W5 = W6: W6 acre W6 divided by W1=W7: W7Name and size of Standard Mitigation Service Area in which mitigation and impact sites are located.(Note: If mitigation provided by a Mitigation Bank, then use the service area designated for that bank.)(Note: If sites are not in same standard area, define a service area appropriate to the mitigation site.)Size = W8: W8W8 divided by W1=W9: W9X3.6Diminishing Relevance Score = [ ( W7 - 1.0 ) divided by ( W9 - 1.0 ) ] = WNWNX4.0 Proximity Factor = X = { 1.0 } divided by { [ ( FN + WN ) divided by ( 2.0 ) ] + [ 1.0 ] } = XCopy this number into the Proximity Factor column of the Project <strong>Worksheet</strong>. Use the same number for allof the "off-site mitigation" polygons located in the location (place) described at line X1.0 above.
Risk <strong>Worksheet</strong> (R):Purpose of risk is to account for mitigation not being successful.Expressed as a percentage of success (100%). (I.E.) Five- percentchance of failure, Risk factor is .95.Assumption: Mitigation is rarely performed under ideal conditions.a. Enter a identification number in the upper right cornerb. Answer 5 questions under R2.0 for each functionc. Answer will be 0, 1, 2, or 3. (0= tends to low risk; 3 = tends to highrisk)d. Follow instructions for calculation on worksheete. You will arrive at a risk factor that is transferred to polygonworksheet.
Risk <strong>Worksheet</strong> version 4.1Risk #This version (version 4.1) differs from version 4.0 only in suggesting that R2.5 be not used and so is "struck out" from calculation.R1.0 Task Description:This Risk calculation is adapted from a DRAFT document that has NOT been adopted by the interagency team thatdeveloped the Mitigation Bank Review Process. This is offered for use until replaced.Wildlife Overstory Ground Up/Wet Hydrology WaterR2.0 Criteria Scores Utilization /Shrub Cover Buffer QualityR2.1 Mitigation TypeFor example -> Wildlife Utilization & Water Quality: High=Creation; Med=Enhancement; Low=PreservationOverstory/Shrub & Ground Cover: High=Creation (planting); Med=Enhancement (exoticHigh = 1 removal); Low=PreservationMed = 2 Hydrology: High=Enery intensive (pumping); Med=Structural Mods (adjustable weirs,Low = 3 ditch plugs, etc.); Low = Total restoration (backfill ditch, degrade levee, etc.)Enter 1, 2, or 3R2.2 Size of and/or the landscape context of the polygonFor example -> Wildlife Utilization: High=Highly predisposed to disturbance;Med=Moderately predisposed to disturbance; Low=Not predisposedHigh = 1 Hydrology: High=Unreliable source; Med=Moderately reliable; High: Highly reliableMed = 2 Water Quality: High=Highly predisposed to contamination;Low = 3 Med=Moderately predisposed to contamination; Low=Not predisposedEnter 1, 2, or 3R2.3 Maintenance requirementsFor example -> Overstory/Shrub & Ground Cover: High=High potential for exotic/invasion;High = 1 Med=Moderate potential for exotic/invasion; Low=Minimal potentialMed = 2 Hydrology: High=High maintenance (pumps, etc.); Med=Moderate (ditch cleaning);Low = 3 Low=Low maintenanceEnter 1, 2, or 3R2.4 Maintenance PlanHigh = 1 Wildlife Utilization: Low=Fire managementMed = 2 Overstory/Shrub & Ground Cover: High=Mechanical control of exotic/invasives;Low = 3 Med=Chemical control of exotic/invasives; Low=Fire managementEnter 1, 2, or 3R2.5 Qualifications of Mitigation Supervisor (note: suggest not use pending discussion of how to assess)For example -> For all functions: High=0=Neophyte; Med=1=Has credentials; Low=3=Has track recordEnter 1, 2, or 3R3.0 Subtotal of ======= ======= ======= ======= ======= =======R2.1 to R2.5R4.0 Risk Factor. Divide line R3.0 by 15 by 12. Copy numbers onto line P8.0 of <strong>Polygon</strong> <strong>Worksheet</strong>.R3.0 / 15.0 12.0RR5.0 Note
WRAP <strong>Worksheet</strong>
WRAP Field Data Sheetversion 4.0WRAP # WPERMIT NUMBER:PROJECT:WETLAND TYPE:LAND USE:DATE:ACRES:TICK ONE: EXIST CONDITION WITH (RESULT OF) PROJECT WITHOUT PROJECTWILDLIFE UTILIZATION SCORE: SCORE DIVIDED BY 3 =NOTES:WETLAND CANOPY (OVERSTORY/SHRUB) SCORE: SCORE DIVIDED BY 3 =NOTES:WETLAND GROUNDCOVER SCORE:NOTES:SCORE DIVIDED BY 3 =HABITAT SUPPORT (UP/WET BUFFER) SCORE:NOTES:SCORE DIVIDED BY 3 =FIELD HYDROLOGY SCORE:SCORE DIVIDED BY 3 =NOTES:WQ INPUT & TREATMENT (WATER QUALITY) SCORE:NOTES:LU=PT=SCORE DIVIDED BY 3 =created by: Mdiaz/Miami Oct98 revised Nov98