STATE OF THE FAMILY IN SINGAPORE, 2003 - Ministry of Social ...
STATE OF THE FAMILY IN SINGAPORE, 2003 - Ministry of Social ...
STATE OF THE FAMILY IN SINGAPORE, 2003 - Ministry of Social ...
Create successful ePaper yourself
Turn your PDF publications into a flip-book with our unique Google optimized e-Paper software.
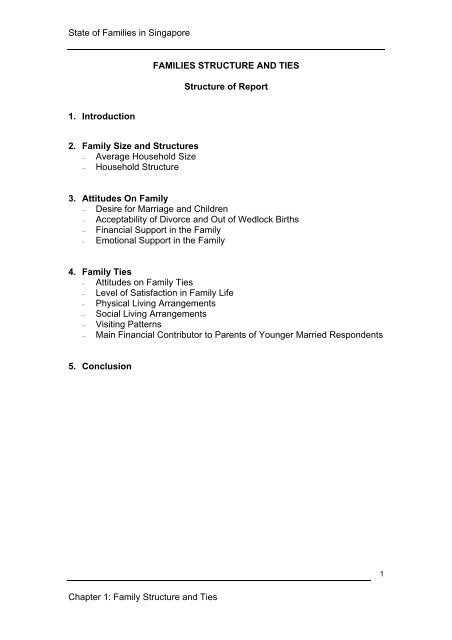
State <strong>of</strong> Families in SingaporeFAMILIES STRUCTURE AND TIESStructure <strong>of</strong> Report1. Introduction2. Family Size and Structures− Average Household Size− Household Structure3. Attitudes On Family− Desire for Marriage and Children− Acceptability <strong>of</strong> Divorce and Out <strong>of</strong> Wedlock Births− Financial Support in the Family− Emotional Support in the Family4. Family Ties− Attitudes on Family Ties− Level <strong>of</strong> Satisfaction in Family Life− Physical Living Arrangements− <strong>Social</strong> Living Arrangements− Visiting Patterns− Main Financial Contributor to Parents <strong>of</strong> Younger Married Respondents5. Conclusion1Chapter 1: Family Structure and Ties
State <strong>of</strong> Families in Singapore<strong>FAMILY</strong> STRUCTURE AND TIES1. <strong>IN</strong>TRODUCTION1.1 This chapter gives an overview <strong>of</strong> the wellbeing <strong>of</strong> families inSingapore through studying key trends relating to family size and structures,attitudes towards family, and quality <strong>of</strong> family ties.2. <strong>FAMILY</strong> SIZE AND STRUCTURESAverage Household Size (Table 1.1)2.1 Household size 1 in Singapore showed a declining trend, decreasingfrom an average <strong>of</strong> 5 persons in 1980 to 4 persons in 2000 2 . The proportion <strong>of</strong>large households with 6 or more members declined from 21percent in 1990 to12 percent in 2000, while households with 2-3 persons increased from 29percent to 36 percent 3 . One-person households increased from 5 percent in1990 to 8 percent in 2000 4 . All ethnic groups saw a decline in the averagehousehold size.Household Structure (Tables 1.2 – 1.6)2.2 One-family nuclear 5 households remained the dominant householdstructure at 82 percent <strong>of</strong> all households in 2000, although it was a slightdecrease <strong>of</strong> 3 percent from 1990. Households with no family nucleus 6 rosefrom 8 percent in 1980 to 12 percent in 2000. The increase was especiallysteep from 1990-2000, in line with the rise in one-person households. 54percent <strong>of</strong> the households with no family nucleus were mainly made up <strong>of</strong>singles and 86 percent <strong>of</strong> the heads <strong>of</strong> households with no family nucleuswere over 35 years old. In addition, 73 percent possessed secondary levelqualifications and below. The proportion <strong>of</strong> multi-family nuclei 7 householdsdeclined from 11 percent to 6 percent between 1980 and 2000, with thesharpest decline over 1980-1990, corresponding with the trend towardssmaller households.1 Household size refers to the total number <strong>of</strong> members in the private household, includingmaids.2 Source: Census <strong>of</strong> Population 2000, Households and Housing, Department <strong>of</strong> Statistics3 Source: Census <strong>of</strong> Population 2000, Households and Housing, DOS4 Source: Census <strong>of</strong> Population 2000, Households and Housing, DOS5 This refers to a household formed by one <strong>of</strong> the following, regardless <strong>of</strong> the number <strong>of</strong>generations: (a) a married couple, with or without unmarried child(ren) and/or aparent/grandparent; (b) a family consisting <strong>of</strong> immediate related members, without presence<strong>of</strong> a married couple, e.g. one parent only with unmarried child(ren).6 This refers to a household formed by a person living alone or living with others but whichdoes not constitute any family nucleus.7 This refers to a household formed by more than one family nucleus.2Chapter 1: Family Structure and Ties
State <strong>of</strong> Families in Singapore2.3 Among the ethnic groups, the Malays had the highest proportion <strong>of</strong>households with one family nucleus and multi-family nuclei (94 percent), andthe lowest with no family nucleus. This suggests that the Malays tend to havea relatively higher family orientation.3. ATTITUDES ON <strong>FAMILY</strong>Desire for Marriage and Children (Table 1.7)3.1 The Survey on <strong>Social</strong> Attitudes <strong>of</strong> Singaporeans (SAS) showed thatSingaporeans generally have a high family orientation, with 82 percentagreeing that it is better to get married than to remain single and 90 percentagreeing that married couples should have children in <strong>2003</strong>. There were nosignificant differences in the SAS 2001 – <strong>2003</strong> results.Acceptability <strong>of</strong> Divorce and Out <strong>of</strong> Wedlock Births(Tables 1.8 – 1.12)3.2 The majority <strong>of</strong> Singaporeans found divorce and out <strong>of</strong> wedlock birthsunacceptable. Having children out <strong>of</strong> wedlock (SAS <strong>2003</strong>: 76 percent) andproceeding with divorce where couples had children were not acceptable tothe majority (SAS <strong>2003</strong>: 75 percent).3.3 More Malays found divorce and having children out <strong>of</strong> wedlockunacceptable compared to the Chinese and Indians.3.4 When we compare across age groups, education and marital status,younger, better educated and single Singaporeans tended to be more liberalthan older, less educated and married persons. However, it should behighlighted that attitudes need not necessarily translate into behaviour.Financial Support in the Family (Table 1.13)3.5 A large majority <strong>of</strong> Singaporeans, regardless <strong>of</strong> age, felt that they hadthe duty to give financial support to their family members (SAS <strong>2003</strong>: 99percent).Emotional Support in the Family (Table 1.14)3.6 Almost all Singaporeans (99 percent) agreed that children shouldregularly spend time with their elderly parents and that parents shouldregularly communicate with their young children even when they were busy.This indicates that Singaporeans generally had strong views on parentalresponsibility and filial piety, and understood that these included providingemotional support.3Chapter 1: Family Structure and Ties
State <strong>of</strong> Families in Singapore4. <strong>FAMILY</strong> TIESAttitudes on Family Ties (Tables 1.15 and 1.16)4.1 Results from SAS (2001 – <strong>2003</strong>) showed that a large majority (93percent in SAS<strong>2003</strong>, down from 97 percent in SAS2001 and SAS2002) <strong>of</strong>Singaporeans agreed that they had a close-knit family. However, the level <strong>of</strong>agreement dropped slightly when it came to whether family members sharedpersonal problems with one another, although agreement was still high at 86percent in <strong>2003</strong>. Nonetheless, with respect to family members in need, thecommitment to providing emotional and financial support was strong, as seenin section 3.4.2 The singles were slightly less likely than married persons to agree thatthey had a close-knit family. The singles were also less likely than the marriedto talk about their problems to their family members, and hear from theirfamily members when the latter had personal problems. Although thissuggests that singles have weaker bonds within the family, the findingsindicate that ties are still healthy as the majority seek emotional support fromfamily members.Level <strong>of</strong> Satisfaction with Family Life (Table 1.17)4.3 89 percent <strong>of</strong> Singaporeans in SAS <strong>2003</strong> indicated that they weresatisfied with their family life. Although this was a decrease <strong>of</strong> 5 percentagepoints from 2002 (94 percent), the change is statistically not significant.Physical Living Arrangement (Tables 1.18 and 1.19)4.4 The physical living arrangements (i.e. physical location <strong>of</strong> residences)<strong>of</strong> parents and their married children could be a significant predictor <strong>of</strong> familyties, as physical proximity could greatly facilitate the strengthening <strong>of</strong> tiesbetween them. It is also a good indicator <strong>of</strong> the quality <strong>of</strong> ties, since therewould be a stronger preference to stay near family members when ties werestrong.4.5 With regard to the actual and ideal living arrangements <strong>of</strong> parents (visà-vistheir married children) and married children (vis-à-vis their parents), aHDB survey showed that both groups shared similar preferences on livingarrangements, desiring to live close to each other. More than 76 percent <strong>of</strong>parents and married children desired to live close to their married children andparents respectively, rather than in a nearby estate or elsewhere. Thisindicates that family ties between parents and their children remain strongeven after the children marry.4Chapter 1: Family Structure and Ties
State <strong>of</strong> Families in Singapore4.6 However, the majority <strong>of</strong> parents and married children were unable tolive as close to one another as they would desire. In fact, the greatestdiscrepancy between ideal and actual physical living arrangements was in thearrangement <strong>of</strong> ‘living elsewhere’. While 34 percent <strong>of</strong> parents and 45percent <strong>of</strong> married children lived elsewhere from their married children andparents respectively, only 9 percent and 8 percent desired to do so. Thiscould be due to the limited supply <strong>of</strong> bigger flat types and new flats in themature estates the parents lived in and the married children’s preference fornewer estates. Nonetheless, the percentage who managed to stay near theirmarried children and parents was still high, with 66 percent parents and 53percent <strong>of</strong> married children living at least in a nearby estate from their marriedchildren and parents respectively.4.7 Malay and Indian parents were twice as likely as their Chinesecounterparts to stay in the same flat as the married child. This is consistentwith the higher proportion <strong>of</strong> Malay and Indian households having multi-familynuclei compared to the Chinese and “Others”. However, it should be notedthat physical living arrangements does not by itself give the full picture <strong>of</strong>family ties as the frequency and quality <strong>of</strong> interaction is not measured.<strong>Social</strong> Living Arrangements (Table 1.20 and 1.21)4.8 Although the majority (74 percent) <strong>of</strong> the older respondents lived withtheir spouse and unmarried children, there was a strong desire to live withone <strong>of</strong> their married sons or daughters. The survey also found that moreChinese respondents preferred to stay with their married sons (22 percent)than their married daughters (4 percent). Indians were similar in this respectwith 13 percent preferring to stay with married sons as compared to 4 percentfor married daughters.4.9 It is interesting to note that a relatively high proportion <strong>of</strong> olderrespondents (13 percent) expressed that they preferred to stay alone,compared to the actual figure <strong>of</strong> 8 percent.Visiting Patterns (Table 1.22)4.10 Findings from the HDB survey showed that the majority <strong>of</strong> marriedchildren visited their parents at least weekly and over 90 percent visited atleast monthly 8 . This indicates that family ties between parents and theirmarried children generally remain strong even in the context <strong>of</strong> the one familynucleus being the dominant family structure.8 The physical proximity <strong>of</strong> residences does have a bearing on the frequency <strong>of</strong> visits. Forexample, 93 percent <strong>of</strong> parents whose married children lived next door visited them dailycompared to 9.3 percent whose married children lived elsewhere. However, even parentswhose married children lived elsewhere tended to be visited by them daily or at least once aweek (59.4 percent). Only 12.5 percent reported their children as visiting them less than oncea month or never. (Table 1.14, pg 27, <strong>Social</strong> Aspects <strong>of</strong> Public Housing in Singapore: KinshipTies and Neighbourly Relations, March 2000, Housing and Development Board).5Chapter 1: Family Structure and Ties
State <strong>of</strong> Families in SingaporeMain Financial Contributor to Parents <strong>of</strong> Younger Married Respondents(Table 1.23)4.11 According to the Census, 75 percent <strong>of</strong> the older respondents 9 namedtheir children as their main source <strong>of</strong> financial support. This is consistent withthe SAS surveys, where 98 percent <strong>of</strong> Singaporeans agreed that childrenshould provide financial support to their elderly parents.5. CONCLUSION5.1 Overall, the wellbeing <strong>of</strong> family structure and ties in Singapore isgenerally positive. This is evident from the dominance <strong>of</strong> households with afamily nucleus, Singaporeans’ pro-family attitudes and disapproval <strong>of</strong> divorceand having children out <strong>of</strong> wedlock, and Singaporeans’ strong consensus thatthe family is the buttress <strong>of</strong> emotional and financial support. MostSingaporeans also had a positive view <strong>of</strong> their close-knit families and weresatisfied with their family life. The analysis also showed that ties betweenparents and their married children remained strong, even for those who livedapart, as there was generally a high frequency <strong>of</strong> visits and contact, throughgrandparents assisting in caring for grandchildren. Children also continued tosupport their parents financially.9 Older Respondents refer to respondents who are aged 65 years old and above.6Chapter 1: Family Structure and Ties


