Discussion of WECC Paths TOT 1A Path 30
Discussion of WECC Paths TOT 1A Path 30
Discussion of WECC Paths TOT 1A Path 30

You also want an ePaper? Increase the reach of your titles
YUMPU automatically turns print PDFs into web optimized ePapers that Google loves.
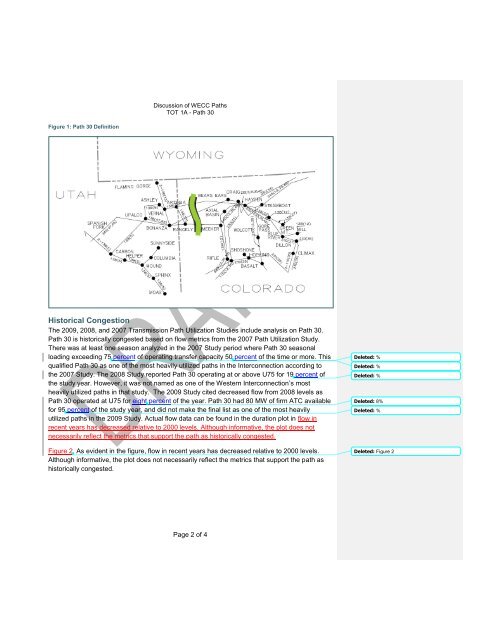
<strong>Discussion</strong> <strong>of</strong> <strong>WECC</strong> <strong><strong>Path</strong>s</strong><strong>TOT</strong> <strong>1A</strong> - <strong>Path</strong> <strong>30</strong>Figure 1: <strong>Path</strong> <strong>30</strong> DefinitionHistorical CongestionThe 2009, 2008, and 2007 Transmission <strong>Path</strong> Utilization Studies include analysis on <strong>Path</strong> <strong>30</strong>.<strong>Path</strong> <strong>30</strong> is historically congested based on flow metrics from the 2007 <strong>Path</strong> Utilization Study.There was at least one season analyzed in the 2007 Study period where <strong>Path</strong> <strong>30</strong> seasonalloading exceeding 75 percent <strong>of</strong> operating transfer capacity 50 percent <strong>of</strong> the time or more. Thisqualified <strong>Path</strong> <strong>30</strong> as one <strong>of</strong> the most heavily utilized paths in the Interconnection according tothe 2007 Study. The 2008 Study reported <strong>Path</strong> <strong>30</strong> operating at or above U75 for 19 percent <strong>of</strong>the study year. However, it was not named as one <strong>of</strong> the Western Interconnection’s mostheavily utilized paths in that study. The 2009 Study cited decreased flow from 2008 levels as<strong>Path</strong> <strong>30</strong> operated at U75 for eight percent <strong>of</strong> the year. <strong>Path</strong> <strong>30</strong> had 80 MW <strong>of</strong> firm ATC availablefor 95 percent <strong>of</strong> the study year, and did not make the final list as one <strong>of</strong> the most heavilyutilized paths in the 2009 Study. Actual flow data can be found in the duration plot in flow inrecent years has decreased relative to 2000 levels. Although informative, the plot does notnecessarily reflect the metrics that support the path as historically congested.Figure 2. As evident in the figure, flow in recent years has decreased relative to 2000 levels.Although informative, the plot does not necessarily reflect the metrics that support the path ashistorically congested.Deleted: %Deleted: %Deleted: %Deleted: 8%Deleted: %Deleted: Figure 2Page 2 <strong>of</strong> 4