Microfluidic single-cell real-time PCR for comparative analysis of ...
Microfluidic single-cell real-time PCR for comparative analysis of ...
Microfluidic single-cell real-time PCR for comparative analysis of ...

Create successful ePaper yourself
Turn your PDF publications into a flip-book with our unique Google optimized e-Paper software.
protocol© 2012 Nature America, Inc. All rights reserved.Table 1 | FACS calibration.Stage Aim Action1 To calibratePMT voltages2 To set the dropdelay3 To set upcompensation(if necessary)4 To removedebris anddoubles5 To removedead <strong>cell</strong>s6 To set upsorting gatesRun fluorescent beads (e.g., BDCalibrite)Run Accudrop beads (e.g., BD Accudrop)Run <strong>single</strong>-stained <strong>cell</strong>s or antibodylabeledbeadsCreate a parent gate on the basis<strong>of</strong> FSC-A versus SSC-A properties.Subsequently, create a daughter gateon the basis <strong>of</strong> FSC-A versus FSC-W, andgranddaughter gate on the basis <strong>of</strong> SSC-A versus SSC-W propertiesExclude PI- or 7AAD-positive eventsfrom the <strong>analysis</strong>Run an aliquot <strong>of</strong> the stained <strong>cell</strong>s tobe sorted. Set up positive and negativegates <strong>for</strong> the <strong>single</strong> <strong>cell</strong> sortFSC-A, <strong>for</strong>ward scatter–area; SSC-A, side scatter–area; FSC-W, <strong>for</strong>ward scatter–width; SSC-W, sidescatter–width; 7-AAD, 7-aminoactinomycin D.suitable <strong>for</strong> 96-well plates are necessary. Both reactions occur in thesame well that a particular <strong>cell</strong> was sorted into. After <strong>cell</strong>s have beenlysed in the RT-STA buffer by the hypotonic pressure–driven influx<strong>of</strong> fluids through their <strong>cell</strong> membranes, RNA is released and reversetranscribed at 50 °C <strong>for</strong> 15 min by the SuperScript III reverse transcriptase.After cDNA synthesis, the reverse transcription reactionis inhibited and Platinum Taq DNA is activated at 70 °C <strong>for</strong> 2 min.Activation <strong>of</strong> the enzyme is followed by specific target amplification<strong>for</strong> 18 cycles, each cycle consisting <strong>of</strong> a denaturation step (95 °C <strong>for</strong>15 s) followed by annealing/extension (60 °C <strong>for</strong> 4 min). The specifictarget transcript amplification by Platinum Taq is required be<strong>for</strong>e<strong>real</strong>-<strong>time</strong> <strong>PCR</strong> by the micr<strong>of</strong>luidic array, because the amounts <strong>of</strong>RNA present in a <strong>single</strong> <strong>cell</strong> are on the order <strong>of</strong> picograms, and theycan be as low as 1–10 molecules <strong>for</strong> rare mRNA species <strong>of</strong> interest.The Dynamic Array micr<strong>of</strong>luidic chip operates by partitioning thesample into 48 (or 96) micr<strong>of</strong>luidic chambers and per<strong>for</strong>ming q<strong>PCR</strong>detection and quantification <strong>for</strong> a specific gene in each chamber.The specific target amplification enriches all loci <strong>of</strong> interest suchthat the cDNA synthesized from those loci can later be distributedevenly throughout the 48 (or 96) Dynamic Array chambers, witheach chamber having at least 100 copies <strong>of</strong> even the rarest targettranscript. Without this first amplification round, the target geneswould not be efficiently detected by Dynamic Array IFCs.Dynamic array IFCs. Two Dynamic Array IFC sizes are available <strong>for</strong>the <strong>single</strong>-<strong>cell</strong> <strong>real</strong>-<strong>time</strong> <strong>PCR</strong> in nanoliter reaction volumes: 48 × 48and 96 × 96. In this protocol, we focus on the use <strong>of</strong> 48 × 48 DynamicArray IFCs, which are run in the BioMark HD reader. With thisarray, the expression levels <strong>of</strong> 48 genes may be studied. Among the48 genes, there should be at least one housekeeping gene that reflectsthe amount <strong>of</strong> RNA supplied and is necessary <strong>for</strong> result data normalization.The suitability <strong>of</strong> housekeeping genes depends on the<strong>cell</strong> type and the experimental setup. The most abundant and stablehousekeeping gene, and there<strong>for</strong>e the one that is most widely used, isthe one encoding ribosomal RNA 18S, which is also the one selectedin the current experimental protocol. The chip is built as a matrix<strong>of</strong> 48 (or 96) ‘sample’ channels crossing 48 (or 96) ‘gene expressionassay’ channels intersecting in 48 × 48 = 2,304 (or 96 × 96 = 9,216)chambers 30 . In each <strong>of</strong> these chambers, a specific sample (<strong>single</strong>-<strong>cell</strong>cDNA) is combined with a specific gene expression assay. Each geneexpression assay consists <strong>of</strong> a pair <strong>of</strong> primers targeting the gene<strong>of</strong> interest, in addition to a gene-specific dual-labeled hydrolysisprobe or a dsDNA-binding dye. In each <strong>of</strong> these chambers, a <strong>single</strong><strong>real</strong>-<strong>time</strong> q<strong>PCR</strong> reaction takes place. Dynamic Array IFCs <strong>of</strong>fer theopportunity to combine different standard reagents, an advantagethat makes the assay configuration more flexible. The protocol wedetail here is intended <strong>for</strong> the use <strong>of</strong> Taqman primers. Alternatively,DNA-binding dyes such as EvaGreen (Biotium) may be used, allowing<strong>for</strong> a more af<strong>for</strong>dable selection <strong>of</strong> <strong>real</strong>-<strong>time</strong> <strong>PCR</strong> primers.Single-<strong>cell</strong> <strong>real</strong>-<strong>time</strong> <strong>PCR</strong> results. In this study, the <strong>single</strong>-<strong>cell</strong> <strong>real</strong><strong>time</strong><strong>PCR</strong> results are shown as threshold cycles (C T). A C Tvalue,which measures target transcript abundance in the sample, is definedas the q<strong>PCR</strong> cycle <strong>for</strong> which the relative fluorescence intensityexceeds a common threshold within the exponential q<strong>PCR</strong> amplificationphase. These values are calculated by the Fluidigm <strong>real</strong><strong>time</strong><strong>PCR</strong> <strong>analysis</strong> s<strong>of</strong>tware. The results can be displayed as a resultstable, image view diagram or heat map. The results table shows thenumeric C Tvalues <strong>of</strong> the different samples <strong>for</strong> each gene. The imageview option allows you to graphically plot the fluorescence intensityas it increases during the q<strong>PCR</strong> amplification. Finally, the heat maprepresents the results according to color range, with each color toneindicating a C Tvalue. In a heat-map display, individual assays (x axis)are plotted against individual samples (y axis).The housekeeping gene included in the array can be used tonormalize the C Tvalues and thereby correct differences in the C Tvalues that are due to slightly varying initial amounts <strong>of</strong> RNA.Normalization <strong>of</strong> the C Tvalues results in so-called ∆C Tvalues, asshown by the following:∆C Tvalues = sample C Tvalue − housekeeping gene C Tvalue∆C Tvalues from the sample <strong>of</strong> interest can be related to a controlsample:∆∆C Tvalues = sample ∆C Tvalues − control ∆C TvaluesThis can be used to obtain fold difference values according to the<strong>for</strong>mula:Fold difference = 2 –(∆∆C T values)The primary data obtained are compatible with different geneexpression s<strong>of</strong>tware.MATERIALSREAGENTS• H7 hESCs (WiCell)• Accudrop fluorescent beads (BD Biosciences, cat. no. 345249)• Accutase (Sigma-Aldrich, cat. no. A6964)• Alexa Fluor 488–conjugated mouse anti-human Tra-1-60 (BD Pharmingen,cat. no. 560173)• Alexa Fluor 647–conjugated mouse anti-human SSEA-4 (BD Pharmingen,cat. no. 560796)nature protocols | VOL.7 NO.5 | 2012 | 831
protocol© 2012 Nature America, Inc. All rights reserved.• Calibrite beads (BD Biosciences, cat. no. 349502)• CellsDirect one-step qRT-<strong>PCR</strong> kit (Invitrogen, cat. no. 11753-100 and11753-500) CRITICAL This kit contains the CellsDirect reaction mixbuffer and the SuperScript III/Platinum Taq mix. So far, we have found thiskit to be the best one <strong>for</strong> ensuring good RNA quality, reverse transcriptionand cDNA amplification <strong>for</strong> the current protocol.• Control line fluid kit 48 × 48 (Fluidigm, cat. no. 89000020)• DA assay loading reagent (Fluidigm, cat. no. 85000736)• DA sample loading reagent (Fluidigm, cat. no. 85000735)• DMEM-F12 (Invitrogen, Gibco, cat. no. 10565)• DPBS (without Ca 2 + and Mg 2 + ; Gibco, cat. no. 14190)• FBS, ES-Cell (Invitrogen, Gibco, cat. no. 16141)• Human testes total RNA (Ambion, cat. no. AM7852)• Matrigel, growth factor reduced (BD Biosciences, cat. no. 354230)• mTeSR-1 (Stem Cell Technologies, cat. no. 05850)• PI (BD Pharmingen, cat. no. 556463) ! CAUTION PI is a potential carcinogen.Avoid contact with skin and eyes. Protect yourself by wearing protectiveclothing, gloves and eye/face protection.• Trypan blue stain (0.4% (wt/vol); Invitrogen, Gibco, cat. no. 15250)• SUPERase-In (Applied Biosystems, cat. no. AM2694) ! CAUTION It maycause skin, eye and respiratory tract irritation. Wear suitable protectiveequipment. Use it only in areas with appropriate exhaust ventilation.• Taqman gene expression assays (Taqman assays; Applied Biosystems,cat. no. 4331182 or 4351372)• Taqman universal <strong>PCR</strong> master mix (Applied Biosystems, cat. no. 4304437)• TE buffer (Ambion, cat. no. AM9849)• Taqman primers (Applied Biosystems)EQUIPMENT• Microcentrifuge tubes (1.5 ml; E&K Scientific, cat. no. 280150)• Disposable serological pipette (10 ml; BD Falcon, cat. no. 356551)• Disposable serological pipette (5 ml; BD Falcon, cat. no. 356543)• Centrifuge tubes (15 ml; BD Falcon, cat. no. 352097)• Cell strainer (40 µm; BD Biosciences, cat. no. 352340)• Petri dish (5 cm; BD Falcon, cat. no. 351006)• Round-bottom tube (5 ml; BD Falcon, cat. no. 352063)• Plates (6 well; BD Falcon, cat. no. 353046)• <strong>PCR</strong> plate (96 well; E&K Scientific, cat. no. 489096)• Aspirating disposable pipettes (BD Falcon, cat. no. 357558)• BioMark HD reader (Fluidigm)• BMK-M-48 × 48 Fluidigm, 48 × 48 dynamic array chips (Fluidigm)• Cell culture hood• Cell culture incubator, 95% air and 5% CO 2, humidified• Cell scraper (Corning, cat. no. 3010)• Cell-strainer cap FACS tubes (BD Falcon, cat. no. 352235)• Countess automated <strong>cell</strong> counter (Invitrogen, cat. no. C10227)• Countess <strong>cell</strong> counting chamber slides (Invitrogen, cat. no. C10228)• Fluorescence-activated <strong>cell</strong> sorter (FACSAria II; BD Biosciences)• Hemocytometer (Hausser Scientific, cat. no. 3500)• Multichannel pipettes• Optical adhesive film (Applied Biosystems, cat. no. 4311971)• Thermal cycler (Veriti; Applied Biosystems)• TipOne 0.1–10 µl extended-length filter tips (USA Scientific,cat. no. 1120-3810)• TipOne 101–1,000 µl extended-length filter tips (USA Scientific,cat. no. 1122-1830)• TipOne 1–200 µl fraduated filter tips (USA Scientific, cat. no. 1120-8810)• Microscope• NanoFlex IFC ControllerREAGENT SETUPFACS buffer To prepare FACS buffer, combine DPBS with 2% (vol/vol) ES-CellFBS. Store at 4 °C <strong>for</strong> ~1 week.Matrigel solution <strong>for</strong> coating plates Dilute the Matrigel 1/60 in DMEM-F12medium. Thaw the Matrigel on ice. Freshly prepare the dilution just be<strong>for</strong>ecoating the plates.Matrigel-coated six-well plates Add 1 ml <strong>of</strong> Matrigel solution, ensuring thatthe entire surface <strong>of</strong> each well is covered completely. Incubate the six-well plate<strong>for</strong> a minimum <strong>of</strong> 30 min at 37 °C. Be<strong>for</strong>e using the well, aspirate the excess <strong>of</strong>Matrigel. Do not let the well dry. Remove the Matrigel just be<strong>for</strong>e adding medium.MTeSR-1 medium Mix the supplement bottle content with the mTeSR-1medium. Store the mixture at 4 °C <strong>for</strong> ~2 weeks or prepare aliquots and storethem at − 20 °C <strong>for</strong> ~2 months.PROCEDUREPreparation <strong>of</strong> the RT-STA master mix ● TIMING ~1 h1| Thaw the 2× CellsDirect reaction mix located in the CellsDirect one-step qRT-<strong>PCR</strong> kit on ice, as well as the 20× Taqmanassays (Taqman primers) <strong>of</strong> interest.2| Prepare the assay mix in a 1.5-ml tube. This assay mix contains all Taqman assays that will be studied in the <strong>single</strong>-<strong>cell</strong><strong>real</strong>-<strong>time</strong> <strong>PCR</strong>. Concentrations <strong>of</strong> the Taqman assay used in the mix will be 0.2×. Use TE buffer to dilute the Taqman assays.For instance, if the final volume <strong>of</strong> the assay mix is 150 µl and there are 48 genes to be studied, add 1.5 µl <strong>of</strong> each Taqmanassay and subsequently adjust the total volume up to 150 µl with TE buffer.ComponentVolume to addper reaction (ml)Final concentration20× Taqman assay 1 1.5 0.2×20× Taqman assay 2 1.5 0.2×20× Taqman assay 48 1.5 0.2×TE buffer Up to 150 µlTotal 150 µl CRITICAL STEP Assay mix (0.2×) can be stored at 4 °C in the dark <strong>for</strong> ~1 week.832 | VOL.7 NO.5 | 2012 | nature protocols
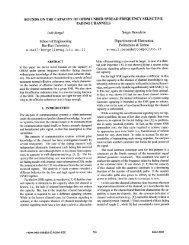
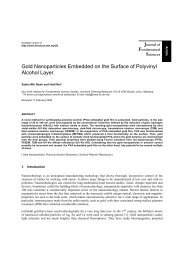
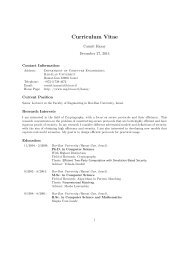
protocol3| Use another 1.5-ml microcentrifuge tube to prepare the RT-STA mix. Add the following reagent amounts per sample:ComponentVolume to addper reaction (ml)Final concentration2× CellsDirect reaction mix 5 1×TE buffer 2.3SUPERase-In 0.1 20 U µl − 1Assay mix 2.5 0.2×SuperScript III/Platinum Taq mix 0.2 CRITICAL STEP Always calculate an excess volume to overcome pipetting errors.© 2012 Nature America, Inc. All rights reserved.4| Mix all reagents well by pipetting up and down. Distribute 10.1 µl <strong>of</strong> the RT-STA mix per well <strong>of</strong> a 96-well plate suitable<strong>for</strong> <strong>PCR</strong>. Note that <strong>for</strong> each 48 × 48 Fluidigm chip, only 48 wells are required. PAUSE POINT The RT-STA mix can be stored at − 20 or − 80 °C <strong>for</strong> ~3 months until needed. It should be thawed only rightbe<strong>for</strong>e using it. Freeze-thaw cycles must be avoided.Cell sample preparation ● TIMING 1 h5| Grow the hESCs and the iPSCs on Matrigel-coated plates with mTeSR-1 (refs. 31,32).6| When the <strong>cell</strong>s reach an appropriate density (60–70%), remove the <strong>cell</strong> culture medium and wash once with warm DPBS.7| Add 1 ml <strong>of</strong> Accutase per well <strong>of</strong> a six-well plate.8| Monitor the <strong>cell</strong>s under the microscope and leave the Accutase until colonies start to disaggregate into <strong>single</strong> <strong>cell</strong>s (Fig. 2a).9| Remove the Accutase, leaving the <strong>cell</strong>s slightly wet.10| Return the six-well plate into the incubator at 37 °C <strong>for</strong> 3 min (Fig. 2b).11| Immediately add 1 ml <strong>of</strong> mTeSR-1 to the six-well plate.12| Scrape the colonies with a <strong>cell</strong> scraper if some are still attached to the bottom <strong>of</strong> the plate.13| Collect the <strong>cell</strong>s and transfer them into a 15-ml centrifuge tube.14| Centrifuge the <strong>cell</strong>s at 200g <strong>for</strong> 5 min at room temperature and remove the supernatant.15| Resuspend the <strong>cell</strong> pellet in 1 ml <strong>of</strong> DPBS.16| Transfer the <strong>cell</strong>s to a FACS tube after passing them through a 40-µm strainer or use FACS tubes with <strong>cell</strong>-strainer caps.17| Take 10 µl <strong>of</strong> the <strong>cell</strong> suspension and mix it with trypanblue in a 1:1 ratio. Load the mixture <strong>of</strong> <strong>cell</strong> suspensionand trypan blue into a counting slide chamber and countthe <strong>cell</strong>s in an automated <strong>cell</strong> counter. Alternatively, the<strong>cell</strong> number can be determined by loading the mixture <strong>of</strong><strong>cell</strong> suspension and trypan blue into a hemocytometer andcounting the <strong>cell</strong>s under a regular bright-field microscope.18| Centrifuge 0.5 × 10 6 to 1 × 10 6 <strong>cell</strong>s at 200g <strong>for</strong> 5 minat 4 °C and remove the supernatant.aFigure 2 | Cell colony dissociation into <strong>single</strong> <strong>cell</strong>s with Accutase. (a) The<strong>cell</strong> colony after 2 min in Accutase. (b) The <strong>cell</strong> colony after removingAccutase and maintaining the <strong>cell</strong>s at 37 °C <strong>for</strong> 3 min.bnature protocols | VOL.7 NO.5 | 2012 | 833
protocol19| Incubate the <strong>cell</strong>s with 20 µl <strong>of</strong> Alexa Fluor 647–conjugated mouse anti-human SSEA-4 per 1 × 10 6 <strong>cell</strong>s and 5 µl <strong>of</strong>Alexa Fluor 488–conjugated mouse anti-human Tra-1-60 per 1 × 10 4 <strong>cell</strong>s <strong>for</strong> 30 min on ice.20| Wash the <strong>cell</strong> pellet with 600 µl <strong>of</strong> DPBS. Centrifuge the <strong>cell</strong>s at 200g <strong>for</strong> 5 min at 4 °C, and then discard the supernatant.21| Resuspend the <strong>cell</strong>s in 200 µl <strong>of</strong> FACS buffer right be<strong>for</strong>e sorting and keep them on ice. CRITICAL STEP Always keep the <strong>cell</strong>s on ice. Once the <strong>cell</strong>s have been resuspended in FACS buffer, sort them immediatelyto avoid possible negative effects <strong>of</strong> the FBS on pluripotent <strong>cell</strong>s.FACS sorting ● TIMING 30 min22| Add 10 µl <strong>of</strong> PI per 1 × 10 6 <strong>cell</strong>s to the <strong>single</strong>-<strong>cell</strong> suspension just be<strong>for</strong>e <strong>cell</strong> sorting.23| Sort <strong>single</strong> <strong>cell</strong>s directly into the wells <strong>of</strong> a 96-well plate containing the RT-STA mix (from Step 4). Remember not to sort<strong>cell</strong>s into the dedicated wells <strong>for</strong> positive and negative controls. CRITICAL STEP Sort the <strong>cell</strong>s in the same plate that is used <strong>for</strong> the RT-STA <strong>PCR</strong>. Always keep the 96-well plate on ice.24| Cover the 96-well plate with an optical adhesive film.© 2012 Nature America, Inc. All rights reserved.25| Mix the samples by flicking the 96-well plate.26| Spin down the 96-well plate briefly to ensure that no drops are adhering to the well walls. PAUSE POINT The samples can be run immediately or stored at − 20 °C <strong>for</strong> ~3 months.Reverse transcription and specific target amplification ● TIMING ~2 h27| Place the 96-well plate in a thermal cycler.28| Run the sample <strong>PCR</strong> according to these parameters:50 °C <strong>for</strong> 15 min70 °C <strong>for</strong> 2 min18 cycles <strong>of</strong> 95 °C <strong>for</strong> 15 s and 60 °C <strong>for</strong> 4 minHold at 4 °C29| Add 10 µl <strong>of</strong> TE buffer to each sample. The final sample volume is now 20 µl. CRITICAL STEP Any dilution between 1:2 and 1:5 is possible. PAUSE POINT The specific cDNA can be stored at − 20 °C <strong>for</strong> ~3 months be<strong>for</strong>e running the Fluidigm chip. It should bethawed only right be<strong>for</strong>e loading the chip.Sample preparation <strong>for</strong> <strong>real</strong>-<strong>time</strong> <strong>PCR</strong> ● TIMING 1 h30| To prepare the assays and samples to be loaded onto the Dynamic Array IFC, divide a 96-well plate into two halves; usethe left side <strong>for</strong> assays and the right side <strong>for</strong> the cDNA samples. Always keep the 96-well plate on ice and protect it fromlight as much as possible.31| Assay mix: in a total <strong>of</strong> 48 wells, add 3.75 µl <strong>of</strong> the 2× assay loading reagent per well and 3.75 µl <strong>of</strong> each 20× Taqmanassay (from Step 3) used <strong>for</strong> the RT-STA. CRITICAL STEP Note that at this point there is only one Taqman assay in each well, and no longer a pool <strong>of</strong> all the Taqman assays.32| Sample mix: in a total <strong>of</strong> 48 wells, add 3.38 µl <strong>of</strong> the cDNA obtained during the RT-STA from Step 28, 3.75 µl <strong>of</strong> TaqmanGene Expression master mix and 0.375 µl <strong>of</strong> 20× gene sample loading reagent.Chip priming ● TIMING 20 min33| Take a BioMark 48 × 48 Dynamic Array <strong>real</strong>-<strong>time</strong> <strong>PCR</strong> chip from its bag. Avoid touching the center <strong>of</strong> the chip. CRITICAL STEP Use the BioMark 48 × 48 Dynamic Array <strong>real</strong>-<strong>time</strong> <strong>PCR</strong> chip within 24 h after opening the package.834 | VOL.7 NO.5 | 2012 | nature protocols
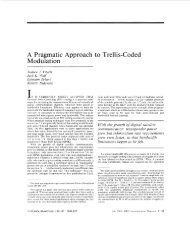
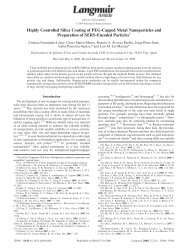
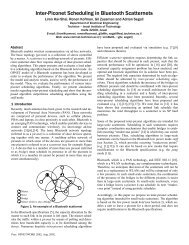
protocol34| Hold the chip in a 45° angle. Inject control line fluid into both sides <strong>of</strong> the chip by introducing the syringe through theinlets without bending the pipette tip, and by pushing down the black O-ring.35| Once the fluid has been injected and the syringe removed, ensure that the O-ring is returned to its original position. CRITICAL STEP Ensure that there are no drops <strong>of</strong> control line fluid on the chip or in the inlets, as this would cause thechip to be unusable.36| Place the chip in a bay <strong>of</strong> the NanoFlex IFC controller.37| Introduce the chip ID, which corresponds to the barcode. CRITICAL STEP Type the barcode number correctly, because it is identical to the identification number <strong>for</strong> this <strong>real</strong>-<strong>time</strong><strong>PCR</strong> on the BioMark system.38| Assign a name to the experiment and enter operator in<strong>for</strong>mation into the computer s<strong>of</strong>tware.39| Select the script: 113 × chip prime.© 2012 Nature America, Inc. All rights reserved.40| Selecting ‘OK’ starts the prime.Chip loading ● TIMING 1.5 h41| Mix well by pipetting up and down the mixes containing the samples (from Step 31) and Taqman assays (from Step 30)prepared in the 96-well plate. CRITICAL STEP The chip should be loaded with samples and assays no later than 60 min after priming the chip.42| Take 5 µl from each well <strong>of</strong> the assay mix that was prepared on the left side <strong>of</strong> the 96-well plate in Step 30 andtransfer it to a chip well on the left side <strong>of</strong> the chip following the distribution presented in Figure 3. Do the same withthe sample mix that was prepared on the right side <strong>of</strong> the 96-well plate in Step 31 and transfer it to the right side <strong>of</strong> thechip (Fig. 3). CRITICAL STEP It is crucial to avoid producing any bubbles inside the chip wells when combining assay and sample mixes.To avoid bubbles, press the pipette only until the first stop.43| Place the chip back onto a bay <strong>of</strong> the NanoFlex IFC Controller machine.44| Enter the chip barcode and operator in<strong>for</strong>mation to the computer s<strong>of</strong>tware.45| Select the script: 113 × load-mix.46| Selecting ‘OK’ starts the loading.? TROUBLESHOOTINGReal-<strong>time</strong> <strong>PCR</strong> ● TIMING 2 h47| Start the Fluidigm BioMarkmachine to warm up the lamp20 min be<strong>for</strong>e starting the<strong>real</strong>-<strong>time</strong> <strong>PCR</strong>. Select ‘BioMarkdata collection Fluidigm’ programfrom the computer.Taqman assaysSamplesNotchcornerAssaysSamplesInletFigure 3 | Distribution in the 48 × 48 DynamicArray. This figure outlines how assays (left side<strong>of</strong> the 96-well plate) and samples (right side<strong>of</strong> the 96-well plate) are loaded into the chipby showing a letter/number code. Althoughboth halves <strong>of</strong> the 96-well plate and oneside <strong>of</strong> the chip have 48 wells, their spatialdistribution is different.1ABCDEFGH2 3 4 5 6 7 8 9 10 11 12AssaysSamplesA1 Samples A2 A4 A6A8 A10 A12B1 B3 B5B7 B9 B11B2 B4 B6B8 B10 B12C1 C3 C5C7 C9 C11C2 C4 C6C8 C10 C12D1 D3 D5D7 D9 D11D2 D4 D6D8 D10 D12E1 E3 E5E7 E9 E11E2 E4 E6E8 E10 E12F1 F3 F5F7 F9 F11F2 F4 F6F8 F10 F12G1 G3 G5G7 G9 G11G2 G4 G6G8 G10 G12H1 H3 H5H7 H9 H11AssaysH2 H4 H6H8 H10 H12nature protocols | VOL.7 NO.5 | 2012 | 835
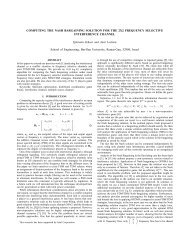
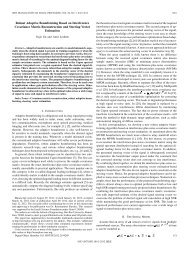
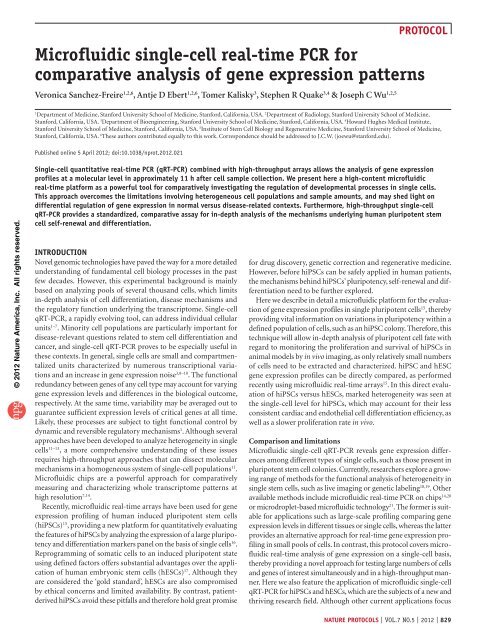
protocol48| Select ‘double-click to warm up the lamp’ from the program. The lamp will be ready in 20 min. CRITICAL STEP To start the <strong>real</strong>-<strong>time</strong> <strong>PCR</strong>, the camera and the lamp indicator on the s<strong>of</strong>tware should be in green.49| When the chip is ready, open the ‘BioMark Data Collection Fluidigm’ program. Selecting ‘start a new run’ opens themachine door.50| Insert the chip with the barcode facing the outside <strong>of</strong> the machine. CRITICAL STEP Do not <strong>for</strong>get to remove the protective plastic cover from the chip.51| Select ‘load’. The Fluidigm BioMark system loads the chip and reads the barcode.52| Enter chip in<strong>for</strong>mation: select ‘new chip run’, select a name <strong>for</strong> the run and save it.53| In the next window, select ‘gene expression’, ‘ROX’, ‘<strong>single</strong> probe’ and ‘Probes: FAM-MGB’.54| The next screen shows the different protocols. Select the protocol ‘Default-10-min-Hot-start’.© 2012 Nature America, Inc. All rights reserved.50 °C <strong>for</strong> 2 min Amplification erase phase95 °C <strong>for</strong> 10 min Hot start phase40 cycles <strong>of</strong> 95 °C <strong>for</strong> 15 s and 60 °C <strong>for</strong> 1 min Denature phase, anneal phase55| Select ‘Start Run’ to begin the <strong>real</strong>-<strong>time</strong> <strong>PCR</strong>. CRITICAL STEP The chip run should begin within 4 h <strong>of</strong> the sample and assay loading.Results <strong>analysis</strong> ● TIMING 1–2 h56| When the run has been completed, open the program ‘Fluidigm Real-<strong>time</strong> <strong>PCR</strong> <strong>analysis</strong>’.57| Open the chip run to be analyzed.58| Select ‘Analysis view’.59| With the view <strong>of</strong> the results,change any parameter <strong>of</strong> interest, suchas the threshold or baseline correction.Click ‘Analyze’.ab60| The results are shown as C Tvalues.The C Tvalues can be seen in the s<strong>of</strong>twareas a heat-map view, image viewor results table. Export all <strong>for</strong>mats withthe ‘.csv’ extension (Fig. 4).? TROUBLESHOOTING61| The data can be visualized and fullyanalyzed using Fluidigm <strong>real</strong>-<strong>time</strong> <strong>PCR</strong><strong>analysis</strong> or any program <strong>for</strong> geneexpression arrays.? TROUBLESHOOTINGFigure 4 | Single-<strong>cell</strong> <strong>real</strong>-<strong>time</strong> <strong>PCR</strong> results.(a–c) Results can be obtained from the Fluidigm<strong>real</strong>-<strong>time</strong> <strong>PCR</strong> <strong>analysis</strong> s<strong>of</strong>tware in three different<strong>for</strong>mats: results table (a), image view (b) andheat map (c). (d) Different s<strong>of</strong>tware types canbe used to analyze the data and create graphs toshow gene expression levels.836 | VOL.7 NO.5 | 2012 | nature protocolscdFold differenceColony 1 Colony 2 Colony 3 Colony 4 Colony 54.54.03.53.02.52.01.51.00.50NANOGLIN28SOX2KLF4POU5F1UTF1ZFP42DNMT3BPODXLMEF2CMESP1
protocol? TROUBLESHOOTINGTroubleshooting advice can be found in Table 2.Table 2 | Troubleshooting table.Step Problem Possible reason Solution46 After loading the array,light lines can be seen onthe chipThe assay or sample mixes did notflow through the chip properlyMake sure that there are no bubbles on the bottom <strong>of</strong> the chipwells after loading the assays and sample mixes60 No product amplification<strong>for</strong> some samplesSorted <strong>cell</strong>s are attached to thewell wallFlick the 96-well plate after <strong>cell</strong> sorting and then spindown brieflyCell sorting did not work properlyRevise FACS settings to sort <strong>single</strong> <strong>cell</strong>s into 96-well platesRNA degradationWork in an RNase-free environment. Use clean instruments andtips with filters© 2012 Nature America, Inc. All rights reserved.No product amplificationin the whole chip61 New results are not consistentwith results fromprevious chip runsAir bubbles on chipChip is dirtyGene is not presentProtective plastic was not removedRT-STA did not workWrong sorted <strong>cell</strong>s; FACS gates wereincorrectCell gene expression pattern haschangedAdd the assays and samples to the chip while pushing thepipette only down to the first pipette stopAvoid touching the top <strong>of</strong> the chip with your hands orany liquidThe sample does not contain the geneRemove the blue plastic film just be<strong>for</strong>e starting the<strong>real</strong>-<strong>time</strong> <strong>PCR</strong>Double-check that all the reagents were added and that thethermal cycle was correctMake sure the gating principles are consistent over <strong>time</strong> whensorting <strong>cell</strong>sSort the <strong>cell</strong>s as soon as possible and always keep them on ice● TIMINGSteps 1–4, preparation <strong>of</strong> RT-STA master mix: ~1 hSteps 5–21, <strong>cell</strong> sample preparation: 1 hSteps 22–26, FACS sorting: 30 minSteps 27–29, reverse transcription and specific target amplification: ~2 hSteps 30–32, sample preparation <strong>for</strong> <strong>real</strong>-<strong>time</strong> <strong>PCR</strong>: 1 hSteps 33–40, chip priming: 20 minSteps 41–46, chip loading: 1.5 hSteps 47–55, <strong>real</strong>-<strong>time</strong> <strong>PCR</strong>: 2 hSteps 56–61, results <strong>analysis</strong>: 1–2 hANTICIPATED RESULTSSuccessful chip runs will generate heat maps with gene C Tvalues encoded by different colors (Fig. 5). In an optimalsituation, all the sample rows loaded with <strong>cell</strong> cDNA will show C Tvalues at least in the housekeeping gene column. However,depending on the experimental design, not all the gene columns may yield a value. The lack <strong>of</strong> C Tvalues <strong>for</strong> a specific gene,represented in the heat map in black, can be read as the absence <strong>of</strong> gene expression in that sample. In a bad chip run, thehousekeeping gene levels will be barely detected or not detected, or the same <strong>cell</strong> type will create overly different transcriptomepatterns, which will hinder result interpretation.nature protocols | VOL.7 NO.5 | 2012 | 837
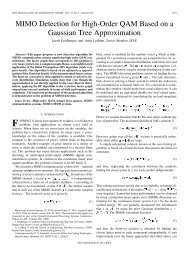
protocolFigure 5 | Interpretation <strong>of</strong> heat map results.The heat map shows C Tvalues encoded bydifferent colors. Positive controls will showresults <strong>for</strong> all the studied genes, whereasnegative controls will not show any C Tvalue(encoded in black). Good samples will havehigh C Tvalues <strong>for</strong> the housekeeping gene,whereas a bad sample or chip run will notshow housekeeping gene C Tvalues or thesewill be contradictory. Among the goodsamples, there will be genes that are highlyexpressed compared with others that arebarely detected. It is also possible thatC Tvalues are not obtained <strong>for</strong> a specificgene, which can be interpreted as a lack <strong>of</strong>expression in this particular <strong>cell</strong> sample.Samples25 : S2526 : S2640 : S4032 : S3247 : S47Gene assays48 : A4847 : A4746 : A4645 : A4544 : A4443 : A4342 : A4241 : A4140 : A4039 : A3938 : A3837 : A3736 : A3635 : A3534 : A3433 : A3332 : A3231 : A3130 : A3029 : A2928 : A2827 : A2726 : A2625 : A2524 : A2423 : A2322 : A2221 : A2120 : A2019 : A1918 : A1817 : A1716 : A1615 : A1514 : A1413 : A1312 : A1211 : A1110 : A1009 : A0908 : A0807 : A0706 : A0605 : A0504 : A0403 : A0302 : A0201 : A01Housekeeping genein triplicatePositive controlNegative controlBad sample OR Chip runSample with C T values <strong>for</strong> all the genesSample with some undertermined genesUndeterminedgeneHighgene expressionVery lowgene expression© 2012 Nature America, Inc. All rights reserved.Acknowledgments We are grateful to P.E. de Almeida <strong>for</strong> FACS discussion.We acknowledge funding support from the Swiss National Science FoundationPBBEP3_129803 (V.S.-F.); the German Research Foundation (A.D.E.); the HowardHughes Medical Institute (S.R.Q.); the US National Institutes <strong>of</strong> Health (NIH)DP2OD004437, RC1AG036142, R01AI085575 (J.C.W.), and the Burroughs WellcomeFoundation (J.C.W.).AUTHOR CONTRIBUTIONS V.S.-F. and A.D.E. prepared most <strong>of</strong> the paper. T.K.,S.R.Q. and J.C.W. provided advice and pro<strong>of</strong>read the paper.COMPETING FINANCIAL INTERESTS The authors declare competing financialinterests: details accompany the full-text HTML version <strong>of</strong> the paper at http://www.natureprotocols.com/.Published online at http://www.natureprotocols.com/.Reprints and permissions in<strong>for</strong>mation is available online at http://www.nature.com/reprints/index.html.1. Kalisky, T. & Quake, S.R. Single-<strong>cell</strong> genomics. Nat. Methods 8, 311–314(2011).2. Heid, C.A., Stevens, J., Livak, K.J. & Williams, P.M. Real <strong>time</strong> quantitative<strong>PCR</strong>. Genome Res. 6, 986–994 (1996).3. Harris, T.D. et al. Single-molecule DNA sequencing <strong>of</strong> a viral genome.Science 320, 106–109 (2008).4. Kurimoto, K., Yabuta, Y., Ohinata, Y. & Saitou, M. Global <strong>single</strong>-<strong>cell</strong> cDNAamplification to provide a template <strong>for</strong> representative high-densityoligonucleotide microarray <strong>analysis</strong>. Nat. Protoc. 2, 739–752 (2007).5. Flatz, L. et al. Single-<strong>cell</strong> gene-expression pr<strong>of</strong>iling reveals qualitativelydistinct CD8 T <strong>cell</strong>s elicited by different gene-based vaccines. Proc. Natl.Acad. Sci. USA 108, 5724–5729 (2011).6. Guo, G. et al. Resolution <strong>of</strong> <strong>cell</strong> fate decisions revealed by <strong>single</strong>-<strong>cell</strong>gene expression <strong>analysis</strong> from zygote to blastocyst. Dev. Cell 18, 675–685(2010).7. Shi, X. et al. Real-<strong>time</strong> <strong>PCR</strong> <strong>of</strong> <strong>single</strong> bacterial <strong>cell</strong>s on an array <strong>of</strong>adhering droplets. Lab Chip 11, 2276–2281 (2011).8. Elowitz, M.B., Levine, A.J., Siggia, E.D. & Swain, P.S. Stochastic geneexpression in a <strong>single</strong> <strong>cell</strong>. Science 297, 1183–1186 (2002).9. Levsky, J.M. & Singer, R.H. Gene expression and the myth <strong>of</strong> the average <strong>cell</strong>.Trends Cell. Biol. 13, 4–6 (2003).10. Stahlberg, A. & Bengtsson, M. Single-<strong>cell</strong> gene expression pr<strong>of</strong>iling usingreverse transcription quantitative <strong>real</strong>-<strong>time</strong> <strong>PCR</strong>. Methods 50, 282–288 (2010).11. Rajan, S., Djambazian, H., Dang, H.C., Sladek, R. & Hudson, T.J. Theliving microarray: a high-throughput plat<strong>for</strong>m <strong>for</strong> measuring transcriptiondynamics in <strong>single</strong> <strong>cell</strong>s. BMC Genomics 12, 115 (2011).12. Zhang, Y., Zhu, Y., Yao, B. & Fang, Q. Nanolitre droplet array <strong>for</strong> <strong>real</strong>-<strong>time</strong>reverse transcription polymerase chain reaction. Lab Chip 11, 1545–1549(2011).13. Morris, J., Singh, J.M. & Eberwine, J.H. Transcriptome <strong>analysis</strong> <strong>of</strong> <strong>single</strong><strong>cell</strong>s. J. Vis. Exp. (2011).14. White, A.K. et al. High-throughput micr<strong>of</strong>luidic <strong>single</strong>-<strong>cell</strong> RT-q<strong>PCR</strong>.Proc. Natl. Acad. Sci. USA 108, 13999–14004 (2011).15. Narsinh, K.H. et al. Single <strong>cell</strong> transcriptional pr<strong>of</strong>iling revealsheterogeneity <strong>of</strong> human induced pluripotent stem <strong>cell</strong>s. J. Clin. Invest. 121,1217–1221 (2011).16. Warren, L., Bryder, D., Weissman, I.L. & Quake, S.R. Transcription factorpr<strong>of</strong>iling in individual hematopoietic progenitors by digital RT-<strong>PCR</strong>.Proc. Natl. Acad. Sci. USA 103, 17807–17812 (2006).17. Takahashi, K. & Yamanaka, S. Induction <strong>of</strong> pluripotent stem <strong>cell</strong>s frommouse embryonic and adult fibroblast cultures by defined factors.Cell 126, 663–676 (2006).18. Schroeder, T. Long-term <strong>single</strong>-<strong>cell</strong> imaging <strong>of</strong> mammalian stem <strong>cell</strong>s.Nat. Methods 8, S30–S35 (2011).19. Hope, K. & Bhatia, M. Clonal interrogation <strong>of</strong> stem <strong>cell</strong>s. Nat. Methods 8,S36–S40 (2011).20. Spurgeon, S.L., Jones, R.C. & Ramakrishnan, R. High throughput geneexpression measurement with <strong>real</strong> <strong>time</strong> <strong>PCR</strong> in a micr<strong>of</strong>luidic dynamicarray. PLoS ONE 3, e1662 (2008).21. Mary, P. et al. Analysis <strong>of</strong> gene expression at the <strong>single</strong>-<strong>cell</strong> level usingmicrodroplet-based micr<strong>of</strong>luidic technology. Biomicr<strong>of</strong>luidics 5, 24109(2011).22. Tamburini, B.A. et al. Gene expression pr<strong>of</strong>iling identifies inflammationand angiogenesis as distinguishing features <strong>of</strong> canine hemangiosarcoma.BMC Cancer 10, 619 (2010).23. Stahlberg, A., Kubista, M. & Aman, P. Single-<strong>cell</strong> gene-expression pr<strong>of</strong>ilingand its potential diagnostic applications. Expert Rev. Mol. Diagn. 11,735–740 (2011).24. Al Dahouk, S., Tomaso, H., Nockler, K. & Neubauer, H. The detection <strong>of</strong>Bru<strong>cell</strong>a spp. using <strong>PCR</strong>-ELISA and <strong>real</strong>-<strong>time</strong> <strong>PCR</strong> assays. Clin. Lab 50,387–394 (2004).25. Simunovic, F., Yi, M., Wang, Y., Stephens, R. & Sonntag, K.C. Evidence <strong>for</strong>gender-specific transcriptional pr<strong>of</strong>iles <strong>of</strong> nigral dopamine neurons inParkinson disease. PLoS ONE 5, e8856 (2010).26. Lindstrom, S., Hammond, M., Brismar, H., Andersson-Svahn, H. &Ahmadian, A. <strong>PCR</strong> amplification and genetic <strong>analysis</strong> in a microwell <strong>cell</strong>culturing chip. Lab Chip 9, 3465–3471 (2009).27. Zeng, Y., Novak, R., Shuga, J., Smith, M.T. & Mathies, R.A. Highper<strong>for</strong>mance<strong>single</strong> <strong>cell</strong> genetic <strong>analysis</strong> using micr<strong>of</strong>luidic emulsiongenerator arrays. Anal. Chem. 82, 3183–3190 (2010).28. Chan, E.M. et al. Live <strong>cell</strong> imaging distinguishes bona fide human iPS<strong>cell</strong>s from partially reprogrammed <strong>cell</strong>s. Nat. Biotechnol. 27, 1033–1037(2009).29. Sun, N. et al. Feeder-free derivation <strong>of</strong> induced pluripotent stem <strong>cell</strong>sfrom adult human adipose stem <strong>cell</strong>s. Proc. Natl. Acad. Sci. USA 106,15720–15725 (2009).30. Liu, J., Hansen, C. & Quake, S.R. Solving the ‘world-to-chip’ interfaceproblem with a micr<strong>of</strong>luidic matrix. Anal. Chem. 75, 4718–4723(2003).31. Li, Z. et al. Functional and transcriptional characterization <strong>of</strong> humanembryonic stem <strong>cell</strong>-derived endothelial <strong>cell</strong>s <strong>for</strong> treatment <strong>of</strong> myocardialinfarction. PLoS ONE 4, e8443 (2009).32. Ludwig, T.E. et al. Derivation <strong>of</strong> human embryonic stem <strong>cell</strong>s in definedconditions. Nat. Biotechnol. 24, 185–187 (2006).838 | VOL.7 NO.5 | 2012 | nature protocols