Manpower Survey Results in May 2012
Manpower Survey Results in May 2012
Manpower Survey Results in May 2012

You also want an ePaper? Increase the reach of your titles
YUMPU automatically turns print PDFs into web optimized ePapers that Google loves.
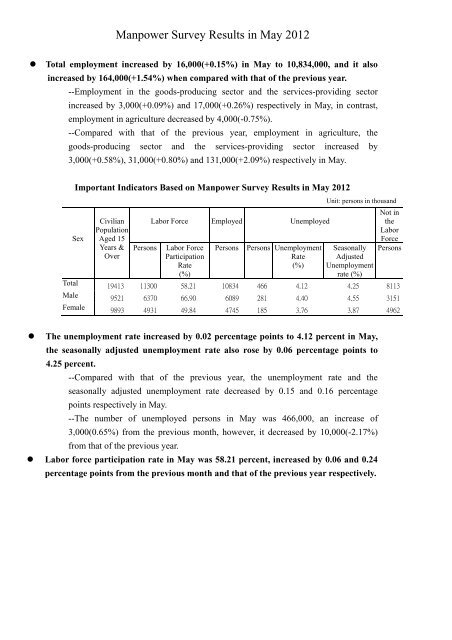
<strong>Manpower</strong> <strong>Survey</strong> <strong>Results</strong> <strong>in</strong> <strong>May</strong> <strong>2012</strong>• Total employment <strong>in</strong>creased by 16,000(+0.15%) <strong>in</strong> <strong>May</strong> to 10,834,000, and it also<strong>in</strong>creased by 164,000(+1.54%) when compared with that of the previous year.--Employment <strong>in</strong> the goods-produc<strong>in</strong>g sector and the services-provid<strong>in</strong>g sector<strong>in</strong>creased by 3,000(+0.09%) and 17,000(+0.26%) respectively <strong>in</strong> <strong>May</strong>, <strong>in</strong> contrast,employment <strong>in</strong> agriculture decreased by 4,000(-0.75%).--Compared with that of the previous year, employment <strong>in</strong> agriculture, thegoods-produc<strong>in</strong>g sector and the services-provid<strong>in</strong>g sector <strong>in</strong>creased by3,000(+0.58%), 31,000(+0.80%) and 131,000(+2.09%) respectively <strong>in</strong> <strong>May</strong>.Important Indicators Based on <strong>Manpower</strong> <strong>Survey</strong> <strong>Results</strong> <strong>in</strong> <strong>May</strong> <strong>2012</strong>SexCivilianPopulationAged 15Years &OverLabor Force Employed UnemployedUnit: persons <strong>in</strong> thousandNot <strong>in</strong>theLaborForcePersonsPersons Labor ForceParticipationRate(%)Persons Persons UnemploymentRate(%)SeasonallyAdjustedUnemploymentrate (%)Total 19413 11300 58.21 10834 466 4.12 4.25 8113Male 9521 6370 66.90 6089 281 4.40 4.55 3151Female 9893 4931 49.84 4745 185 3.76 3.87 4962• The unemployment rate <strong>in</strong>creased by 0.02 percentage po<strong>in</strong>ts to 4.12 percent <strong>in</strong> <strong>May</strong>,the seasonally adjusted unemployment rate also rose by 0.06 percentage po<strong>in</strong>ts to4.25 percent.--Compared with that of the previous year, the unemployment rate and theseasonally adjusted unemployment rate decreased by 0.15 and 0.16 percentagepo<strong>in</strong>ts respectively <strong>in</strong> <strong>May</strong>.--The number of unemployed persons <strong>in</strong> <strong>May</strong> was 466,000, an <strong>in</strong>crease of3,000(0.65%) from the previous month, however, it decreased by 10,000(-2.17%)from that of the previous year.• Labor force participation rate <strong>in</strong> <strong>May</strong> was 58.21 percent, <strong>in</strong>creased by 0.06 and 0.24percentage po<strong>in</strong>ts from the previous month and that of the previous year respectively.
Year & monthTable 1. Statistical Brief Based on <strong>Manpower</strong> <strong>Survey</strong> <strong>Results</strong>Civilianpopulationaged 15years &overLabor forceTotal EmployedpersonsUnemployedpersonsNot <strong>in</strong>laborforceUnit: Thousand PersonsLabor forceUnemploymentparticipatirate(%) 15~24on rate(%)YearsUnemployedpersons, by age25~44Years45~64YearsAve., 2000 16963 9784 9491 293 7178 57.68 2.99 94 154 44Ave., 2001 17179 9832 9383 450 7347 57.23 4.57 130 243 76Ave., 2002 17387 9969 9454 515 7417 57.34 5.17 145 279 91Ave., 2003 17572 10076 9573 503 7495 57.34 4.99 131 265 106Ave., 2004 17760 10240 9786 454 7520 57.66 4.44 120 239 95Ave., 2005 17949 10371 9942 428 7578 57.78 4.13 112 230 86Ave., 2006 18166 10522 10111 411 7644 57.92 3.91 104 233 74Ave., 2007 18392 10713 10294 419 7679 58.25 3.91 104 240 75Ave., 2008 18623 10853 10403 450 7770 58.28 4.14 110 251 88Ave., 2009 18855 10917 10279 639 7937 57.90 5.85 127 372 139Ave., 2010 19062 11070 10493 577 7992 58.07 5.21 114 337 125Ave., 2011 19253 11200 10709 491 8053 58.17 4.39 109 281 101<strong>May</strong> 19228 11146 10670 476 8082 57.97 4.27 99 278 99June 19244 11183 10696 486 8061 58.11 4.35 107 277 102July 19260 11248 10752 496 8012 58.40 4.41 116 276 104Aug. 19276 11284 10782 502 7992 58.54 4.45 122 277 103Sept. 19291 11231 10750 481 8060 58.22 4.28 113 270 98Oct. 19309 11249 10765 484 8060 58.26 4.30 111 275 98Nov. 19326 11270 10788 482 8055 58.32 4.28 108 274 100Dec. 19342 11273 10802 471 8069 58.28 4.18 104 270 97Ave., <strong>2012</strong> 19386 11281 10811 470 8104 58.20 4.17 104 275 91Jan. 19359 11280 10808 472 8079 58.27 4.18 103 273 95Feb. 19372 11270 10790 479 8102 58.18 4.25 106 278 96Mar. 19385 11276 10806 470 8109 58.17 4.17 107 274 90Apr. 19399 11281 10818 463 8118 58.15 4.10 102 272 89<strong>May</strong> 19413 11300 10834 466 8113 58.21 4.12 102 277 87Change <strong>in</strong> percent(percentage po<strong>in</strong>ts)from the previous0.07 0.17 0.15 0.65 -0.06 ( 0.06) ( 0.02) 0.45 1.98 -3.01monthChange <strong>in</strong> percent(percentage po<strong>in</strong>ts)from the same month0.96 1.39 1.54 -2.17 0.38 ( 0.24) (-0.15) 3.2 -0.39 -12.28of previous yearChange <strong>in</strong> percent(percentage po<strong>in</strong>ts)from the cumulativeaverage year-on-year0.98 1.34 1.67 -5.65 0.47 ( 0.21) (-0.31) -1.09 -5.45 -10.94
Table 2. Important Indicator Based on <strong>Manpower</strong> <strong>Survey</strong> <strong>Results</strong>, by YearYear & monthLabor forceNumber ofpersons(ThousandPersons)Annual<strong>in</strong>creaserate(%)Employed personsNumber ofpersons(ThousandPersons)Labor forceparticipation rateAnnual<strong>in</strong>crease (%) Seasonallyadjustedrate(%)Unemployedpersons(ThousandPersons)Unemployment rate(%)Seasonallyadjusted<strong>May</strong>, 1983 7068 3.91 6897 3.44 57.83 58.69 171 2.42 2.68<strong>May</strong>, 1984 7357 4.08 7202 4.42 58.87 59.73 156 2.11 2.37<strong>May</strong>, 1985 7568 2.87 7374 2.39 59.01 59.83 194 2.57 2.79<strong>May</strong>, 1986 7800 3.07 7618 3.31 59.43 60.19 182 2.34 2.51<strong>May</strong>, 1987 8055 3.26 7898 3.67 60.14 60.83 156 1.94 2.07<strong>May</strong>, 1988 8072 0.22 7931 0.42 59.11 59.74 141 1.74 1.85<strong>May</strong>, 1989 8343 3.35 8217 3.60 59.87 60.40 126 1.50 1.60<strong>May</strong>, 1990 8318 -0.29 8196 -0.26 58.67 59.09 123 1.48 1.59<strong>May</strong>, 1991 8554 2.83 8432 2.88 59.13 59.46 122 1.43 1.53<strong>May</strong>, 1992 8703 1.74 8582 1.78 59.10 59.38 122 1.40 1.53<strong>May</strong>, 1993 8816 1.29 8702 1.41 58.59 58.81 114 1.29 1.42<strong>May</strong>, 1994 9008 2.17 8879 2.03 58.63 58.83 129 1.43 1.57<strong>May</strong>, 1995 9158 1.67 9008 1.46 58.51 58.72 149 1.63 1.77<strong>May</strong>, 1996 9268 1.20 9050 0.46 58.28 58.49 218 2.35 2.49<strong>May</strong>, 1997 9373 1.14 9138 0.97 58.11 58.32 236 2.51 2.66<strong>May</strong>, 1998 9501 1.36 9276 1.51 57.84 58.05 225 2.37 2.52<strong>May</strong>, 1999 9621 1.26 9348 0.78 57.80 58.01 273 2.84 2.98<strong>May</strong>, 2000 9741 1.25 9470 1.30 57.51 57.72 271 2.78 2.93<strong>May</strong>, 2001 9748 0.08 9337 -1.40 56.84 57.04 411 4.22 4.35<strong>May</strong>, 2002 9951 2.07 9451 1.22 57.31 57.48 499 5.02 5.13<strong>May</strong>, 2003 10022 0.72 9523 0.75 57.13 57.27 499 4.98 5.09<strong>May</strong>, 2004 10214 1.91 9764 2.53 57.59 57.71 450 4.41 4.49<strong>May</strong>, 2005 10343 1.26 9918 1.58 57.72 57.82 424 4.10 4.18<strong>May</strong>, 2006 10466 1.20 10064 1.47 57.72 57.82 402 3.84 3.91<strong>May</strong>, 2007 10673 1.98 10260 1.95 58.14 58.24 413 3.87 3.94<strong>May</strong>, 2008 10829 1.46 10413 1.49 58.25 58.36 416 3.84 3.93<strong>May</strong>, 2009 10874 0.42 10241 -1.65 57.76 57.89 633 5.82 5.92<strong>May</strong>, 2010 11026 1.39 10459 2.12 57.92 58.06 567 5.14 5.27<strong>May</strong>, 2011 11146 1.09 10670 2.01 57.97 58.11 476 4.27 4.41<strong>May</strong>, <strong>2012</strong> 11300 1.39 10834 1.54 58.21 58.36 466 4.12 4.25
Table 3. Comparison of Unemployment Rates <strong>in</strong> Major Countries, by YearYear & monthR.O.CSeasonaladjustedHong*KongJapan*Korea,*R.O.S<strong>in</strong>gapore *ResidentUnited*StatesCanada* Germany UnitedK<strong>in</strong>gdom* Australia*Ave.,2009 5.85 5.85 5.3 5.1 3.6 3.0 4.3 9.3 8.3 8.2 7.7 5.6Ave.,2010 5.21 5.21 4.3 5.1 3.7 2.2 3.1 9.6 8.0 7.7 7.8 5.2Ave.,2011 4.39 4.39 3.4 4.5 3.4 2.0 2.9 8.9 7.4 7.1 8.1 5.1Apr. 4.29 4.36 3.6 4.7 3.6 ... ... 9.0 7.6 7.3 7.7 4.9<strong>May</strong> 4.27 4.41 3.6 4.6 3.3 ... ... 9.0 7.4 7.0 7.7 5.0June 4.35 4.40 3.6 4.6 3.3 2.1 3.0 9.1 7.4 6.9 7.9 5.0July 4.41 4.36 3.5 4.6 3.3 ... ... 9.1 7.2 7.0 7.9 5.1Aug. 4.45 4.34 3.2 4.4 3.1 ... ... 9.1 7.3 7.0 8.1 5.3Sept. 4.28 4.29 3.2 4.2 3.3 2.0 2.9 9.0 7.1 6.6 8.3 5.3Oct. 4.30 4.29 3.3 4.4 3.1 ... ... 8.9 7.3 6.5 8.3 5.2Nov. 4.28 4.29 3.3 4.5 3.1 ... ... 8.7 7.4 6.4 8.4 5.2Dec. 4.18 4.21 3.3 4.5 3.1 2.0 2.9 8.5 7.5 6.6 8.4 5.2Ave.,<strong>2012</strong>Jan. 4.18 4.19 3.2 4.6 3.2 ... ... 8.3 7.6 7.3 8.4 5.1Feb. 4.25 4.15 3.4 4.5 3.7 ... ... 8.3 7.4 7.4 8.3 5.2Mar. 4.17 4.14 3.4 4.5 3.4 2.1 3.0 8.2 7.2 7.2 8.2 5.2Apr. 4.10 4.19 3.3 4.6 3.4 ... ... 8.1 7.3 7.0 8.2 5.0<strong>May</strong> 4.12 4.25 3.2 ... 3.2 ... ... 8.2 7.3 6.7 ... 5.1Note:1. The unemployment rates (UR) of Hong Kong and United K<strong>in</strong>gdom are the mov<strong>in</strong>g averages of 3 consecutivemonths.2.’*’ implies seasonally adjusted figure.3. German UR are based on Employment Registry data.4. Devastated quake-hit prefectures are not <strong>in</strong>cluded <strong>in</strong> the figures from March to Aug. 2011 and 2011 annualaverage <strong>in</strong> Japan.