An Analysis of 35 Water Districts Prospects and Pitfalls in ... - WSP
An Analysis of 35 Water Districts Prospects and Pitfalls in ... - WSP
An Analysis of 35 Water Districts Prospects and Pitfalls in ... - WSP

You also want an ePaper? Increase the reach of your titles
YUMPU automatically turns print PDFs into web optimized ePapers that Google loves.
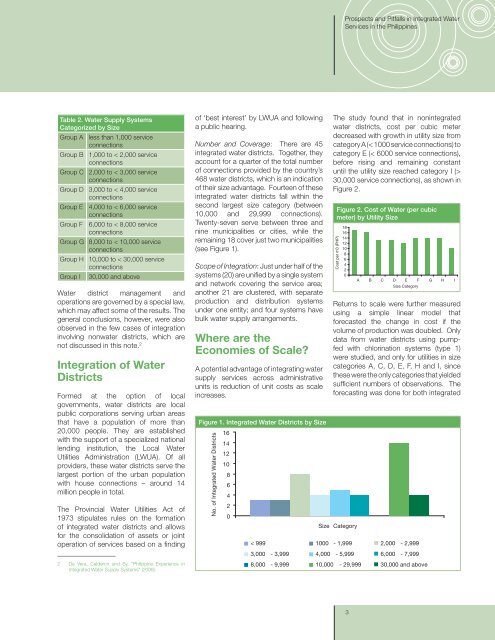
<strong>Prospects</strong> <strong>and</strong> <strong>Pitfalls</strong> <strong>in</strong> Integrated <strong>Water</strong>Services <strong>in</strong> the Philipp<strong>in</strong>esTable 2. <strong>Water</strong> Supply SystemsCategorized by SizeGroup AGroup BGroup CGroup DGroup EGroup FGroup GGroup HGroup Iless than 1,000 serviceconnections1,000 to < 2,000 serviceconnections2,000 to < 3,000 serviceconnections3,000 to < 4,000 serviceconnections4,000 to < 6,000 serviceconnections6,000 to < 8,000 serviceconnections8,000 to < 10,000 serviceconnections10,000 to < 30,000 serviceconnections30,000 <strong>and</strong> above<strong>Water</strong> district management <strong>and</strong>operations are governed by a special law,which may affect some <strong>of</strong> the results. Thegeneral conclusions, however, were alsoobserved <strong>in</strong> the few cases <strong>of</strong> <strong>in</strong>tegration<strong>in</strong>volv<strong>in</strong>g nonwater districts, which arenot discussed <strong>in</strong> this note. 2Integration <strong>of</strong> <strong>Water</strong><strong>Districts</strong>Formed at the option <strong>of</strong> localgovernments, water districts are localpublic corporations serv<strong>in</strong>g urban areasthat have a population <strong>of</strong> more than20,000 people. They are establishedwith the support <strong>of</strong> a specialized nationallend<strong>in</strong>g <strong>in</strong>stitution, the Local <strong>Water</strong>Utilities Adm<strong>in</strong>istration (LWUA). Of allproviders, these water districts serve thelargest portion <strong>of</strong> the urban populationwith house connections – around 14million people <strong>in</strong> total.The Prov<strong>in</strong>cial <strong>Water</strong> Utilities Act <strong>of</strong>1973 stipulates rules on the formation<strong>of</strong> <strong>in</strong>tegrated water districts <strong>and</strong> allowsfor the consolidation <strong>of</strong> assets or jo<strong>in</strong>toperation <strong>of</strong> services based on a fi nd<strong>in</strong>g2 De Vera, Calderon <strong>and</strong> Sy, ”Philipp<strong>in</strong>e Experience <strong>in</strong>Integrated <strong>Water</strong> Supply Systems” (2008).<strong>of</strong> ‘best <strong>in</strong>terest’ by LWUA <strong>and</strong> follow<strong>in</strong>ga public hear<strong>in</strong>g.Number <strong>and</strong> Coverage: There are 45<strong>in</strong>tegrated water districts. Together, theyaccount for a quarter <strong>of</strong> the total number<strong>of</strong> connections provided by the country’s468 water districts, which is an <strong>in</strong>dication<strong>of</strong> their size advantage. Fourteen <strong>of</strong> these<strong>in</strong>tegrated water districts fall with<strong>in</strong> thesecond largest size category (between10,000 <strong>and</strong> 29,999 connections).Twenty-seven serve between three <strong>and</strong>n<strong>in</strong>e municipalities or cities, while therema<strong>in</strong><strong>in</strong>g 18 cover just two municipalities(see Figure 1).Scope <strong>of</strong> Integration: Just under half <strong>of</strong> thesystems (20) are unifi ed by a s<strong>in</strong>gle system<strong>and</strong> network cover<strong>in</strong>g the service area;another 21 are clustered, with separateproduction <strong>and</strong> distribution systemsunder one entity; <strong>and</strong> four systems havebulk water supply arrangements.Where are theEconomies <strong>of</strong> Scale?A potential advantage <strong>of</strong> <strong>in</strong>tegrat<strong>in</strong>g watersupply services across adm<strong>in</strong>istrativeunits is reduction <strong>of</strong> unit costs as scale<strong>in</strong>creases.Figure 1. Integrated <strong>Water</strong> <strong>Districts</strong> by SizeNo. <strong>of</strong> Integrated <strong>Water</strong> <strong>Districts</strong>1614121086420The study found that <strong>in</strong> non<strong>in</strong>tegratedwater districts, cost per cubic meterdecreased with growth <strong>in</strong> utility size fromcategory A (< 1000 service connections) tocategory E (< 6000 service connections),before ris<strong>in</strong>g <strong>and</strong> rema<strong>in</strong><strong>in</strong>g constantuntil the utility size reached category I (>30,000 service connections), as shown <strong>in</strong>Figure 2.Figure 2. Cost <strong>of</strong> <strong>Water</strong> (per cubicmeter) by Utility SizeCost per m3 (PHP)181614121086420A B C D E F G H ISize CategoryReturns to scale were further measuredus<strong>in</strong>g a simple l<strong>in</strong>ear model thatforecasted the change <strong>in</strong> cost if thevolume <strong>of</strong> production was doubled. Onlydata from water districts us<strong>in</strong>g pumpfedwith chlor<strong>in</strong>ation systems (type 1)were studied, <strong>and</strong> only for utilities <strong>in</strong> sizecategories A, C, D, E, F, H <strong>and</strong> I, s<strong>in</strong>cethese were the only categories that yieldedsuffi cient numbers <strong>of</strong> observations. Theforecast<strong>in</strong>g was done for both <strong>in</strong>tegratedSize Category< 999 1000 - 1,999 2,000 - 2,9993,000 - 3,999 4,000 - 5,999 6,000 - 7,9998,000 - 9,999 10,000 - 29,999 30,000 <strong>and</strong> above3