lesson plans for Energy Skate park 4.pdf - PhET
lesson plans for Energy Skate park 4.pdf - PhET
lesson plans for Energy Skate park 4.pdf - PhET

You also want an ePaper? Increase the reach of your titles
YUMPU automatically turns print PDFs into web optimized ePapers that Google loves.
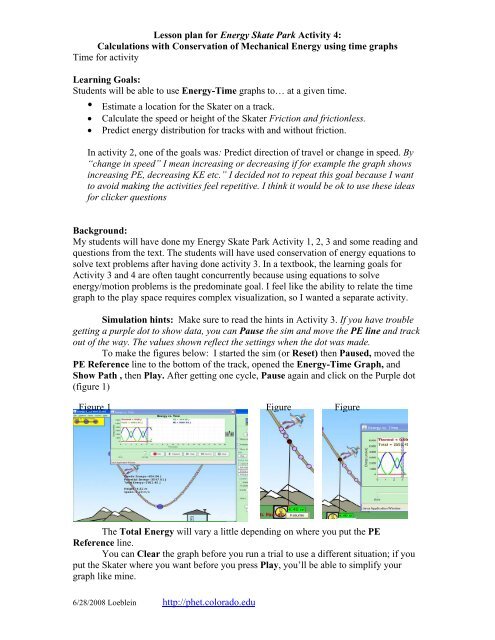
Lesson plan <strong>for</strong> <strong>Energy</strong> <strong>Skate</strong> Park Activity 4:Calculations with Conservation of Mechanical <strong>Energy</strong> using time graphsTime <strong>for</strong> activityLearning Goals:Students will be able to use <strong>Energy</strong>-Time graphs to… at a given time.• Estimate a location <strong>for</strong> the <strong>Skate</strong>r on a track.• Calculate the speed or height of the <strong>Skate</strong>r Friction and frictionless.• Predict energy distribution <strong>for</strong> tracks with and without friction.In activity 2, one of the goals was: Predict direction of travel or change in speed. By“change in speed” I mean increasing or decreasing if <strong>for</strong> example the graph showsincreasing PE, decreasing KE etc.” I decided not to repeat this goal because I wantto avoid making the activities feel repetitive. I think it would be ok to use these ideas<strong>for</strong> clicker questionsBackground:My students will have done my <strong>Energy</strong> <strong>Skate</strong> Park Activity 1, 2, 3 and some reading andquestions from the text. The students will have used conservation of energy equations tosolve text problems after having done activity 3. In a textbook, the learning goals <strong>for</strong>Activity 3 and 4 are often taught concurrently because using equations to solveenergy/motion problems is the predominate goal. I feel like the ability to relate the timegraph to the play space requires complex visualization, so I wanted a separate activity.Simulation hints: Make sure to read the hints in Activity 3. If you have troublegetting a purple dot to show data, you can Pause the sim and move the PE line and trackout of the way. The values shown reflect the settings when the dot was made.To make the figures below: I started the sim (or Reset) then Paused, moved thePE Reference line to the bottom of the track, opened the <strong>Energy</strong>-Time Graph, andShow Path , then Play. After getting one cycle, Pause again and click on the Purple dot(figure 1)Figure 1 Figure FigureThe Total <strong>Energy</strong> will vary a little depending on where you put the PEReference line.You can Clear the graph be<strong>for</strong>e you run a trial to use a different situation; if youput the <strong>Skate</strong>r where you want be<strong>for</strong>e you press Play, you’ll be able to simplify yourgraph like mine.6/28/2008 Loeblein http://phet.colorado.edu
Lesson plan <strong>for</strong> <strong>Energy</strong> <strong>Skate</strong> Park Activity 4:Calculations with Conservation of Mechanical <strong>Energy</strong> using time graphsTime <strong>for</strong> activityTo relate the data to the <strong>Energy</strong>-Time graph, (remember the window can bemoved to help viewing) I selected a purple dot to get the Height and Speed then I usedthe Measuring Tape to mark the dot’s location. (figure 2). Then I moved the vertical barso that the <strong>Skate</strong>rs red dot was on top of the tape (figure 3).Lesson: Have the students use the lab sheet <strong>for</strong> guidance. I handed out the directions andhad them make predictions.For question 1, I opened the simulation, Paused. Then I moved the PE line to the bottomof the track, pressed Return <strong>Skate</strong>r, selected the <strong>Energy</strong>-Time graph and zoomedso 3500 was the max y value. Then I pressed Play and let the sim run 11 secondsand then Paused. One of the nice things about using the default track and initial<strong>Skate</strong>r position is that it is very quick to rerun trials with variation by Return <strong>Skate</strong>r.His place on the track is at the time shown by the vertical bar on the graph.Answers: ( I’m expecting estimates the first time around and then more exactwhen they do #2). The picture on the student directions shows total energy at 2918J.When the students sun their trials, the Total <strong>Energy</strong> will vary a little depending on wherethey put the PE Reference line. I used acceleration = 9.81 m/s 2 in my calculations.2a. 0 =left side, same height; 7s=same place; 8s=bottom; 5s= on way back downfrom right side at about 80% of original height (PE = 2500 which is about 2500/2918=85% of max)2b. 0 and 7s = 4m; 8s=0; 5s= 3.4m (85% of 4m)2c. 0 and 7s = 0; 8s= 8.8m/s (KE= 2918= 1/2mv 2 = .5*75* 2 ); at 5s= 3.6m/s(KE=500=1/2*75*3.6 2 )2d. a complete cycle is about 4. 7s, so the cycle should restart bout 14s.6/28/2008 Loeblein http://phet.colorado.edu
Lesson plan <strong>for</strong> <strong>Energy</strong> <strong>Skate</strong> Park Activity 4:Calculations with Conservation of Mechanical <strong>Energy</strong> using time graphsTime <strong>for</strong> activity3. I made this graph by setting the Friction on the first tick. The only thing thatchanges on the graph is that Total <strong>Energy</strong> decreases along with max PE and KE.Notice that the max, min points are still at the same time, so the <strong>Skate</strong>r is at thesame horizontal location, but not going as high. The calculations <strong>for</strong> speed andheight should reflect the lower PE and KE values. I didn’t give answers becausethe amount of friction that the students use will matter.4. If you use the Return <strong>Skate</strong>r button after changing the <strong>Skate</strong>r (which really onlychanges the mass), the only thing that changes is that Total <strong>Energy</strong>, max PE and KE areless. It may be important to help students see that the time <strong>for</strong> max and min are still thesame and that both the horizontal and vertical location at any time is the same whetherthere is friction or not. Students make think Track Friction that she will go higher orfaster because the <strong>Skate</strong>r has less mass and there<strong>for</strong>e less Friction <strong>for</strong>ce, but she startedwith less energy, so there is no net difference.Post <strong>lesson</strong>: Use clicker questions (yet to be written)6/28/2008 Loeblein http://phet.colorado.edu