Household Expenditure on Sports and Physical Recreation (1)
Household Expenditure on Sports and Physical Recreation (1)
Household Expenditure on Sports and Physical Recreation (1)

You also want an ePaper? Increase the reach of your titles
YUMPU automatically turns print PDFs into web optimized ePapers that Google loves.
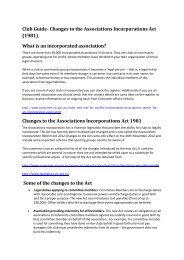
1 <strong>Sports</strong> <strong>and</strong> <strong>Physical</strong> Recreati<strong>on</strong> <str<strong>on</strong>g>Expenditure</str<strong>on</strong>g>During 2003–04, the average expenditure by Australian households <strong>on</strong> all goods <strong>and</strong> services(including in-ground swimming pools) was $886.63 per week. Of this amount, $15.70 (1.8%) wasspent <strong>on</strong> the sports <strong>and</strong> physical recreati<strong>on</strong> products detailed in table 1. The term 'products' is usedby the ABS to encompass both the tangible (otherwise known as goods) <strong>and</strong> the intangible (otherwiseknown as services).Nearly half (48.2%) of the expenditure <strong>on</strong> sports <strong>and</strong> physical recreati<strong>on</strong> products went <strong>on</strong> <strong>Sports</strong>,physical recreati<strong>on</strong> <strong>and</strong> camping equipment ($7.57 per week). A further 44.7% was spent <strong>on</strong> <strong>Sports</strong><strong>and</strong> physical recreati<strong>on</strong> services ($7.02 per week), while <strong>Sports</strong> <strong>and</strong> recreati<strong>on</strong> vehicles accounted forthe remaining 7.1% ($1.11 per week).The product categories for which the highest expenditures were recorded were Swimming pools($3.41 per week), <strong>Sports</strong> facility hire charges ($2.30 per week) <strong>and</strong> Other sports <strong>and</strong> physicalrecreati<strong>on</strong> equipment ($2.03 per week).AVERAGE WEEKLY HOUSEHOLD EXPENDITURE ON SELECTED SPORTS AND PHYSICAL RECREATIONPRODUCTS—2003–04BicyclesBoats, their parts <strong>and</strong> accessoriesCamping equipmentFishing equipmentGolf equipment<strong>Sports</strong> or physical recreati<strong>on</strong> footwearSwimming poolsOther sports & physical recreati<strong>on</strong> equipmentHire of sports equipmentHealth <strong>and</strong> fitness studio chargesSporting club subscripti<strong>on</strong>sSpectator admissi<strong>on</strong> fees to sport<strong>Sports</strong> facility hire charges<strong>Sports</strong> less<strong>on</strong>s<strong>Physical</strong> recreati<strong>on</strong> charges nec0 0.5 1.0 1.5 2.0 2.5 3.0 3.5$/weekThe 2003–04 <str<strong>on</strong>g>Household</str<strong>on</strong>g> <str<strong>on</strong>g>Expenditure</str<strong>on</strong>g> Survey also captured data regarding the numbers ofhouseholds reporting expenditure <strong>on</strong> each product category. The category <strong>on</strong> which the largestnumber had expenditure was <strong>Sports</strong> facility hire charges which was reported by 15.8% of households.<strong>Physical</strong> recreati<strong>on</strong> charges nec <strong>and</strong> Other sport <strong>and</strong> physical recreati<strong>on</strong> equipment were thecategories reported by the next highest percentages of households. These were little different at 5.8%<strong>and</strong> 5.7% respectively.The product categories <strong>on</strong> which the lowest percentages of households had expenditure were Hire ofsports equipment (0.4%); Boats, their parts <strong>and</strong> accessories (0.7%) <strong>and</strong> Bicycles (0.8%).In total, $6,332.5m was spent <strong>on</strong> the sports <strong>and</strong> physical recreati<strong>on</strong> products detailed in table 1 during2003–04. The expenditure <strong>on</strong> <strong>Sports</strong>, physical recreati<strong>on</strong> <strong>and</strong> camping equipment was $3,053.3m,while $2,831.5m was spent <strong>on</strong> <strong>Sports</strong> <strong>and</strong> physical recreati<strong>on</strong> services <strong>and</strong> $447.7m <strong>on</strong> <strong>Sports</strong> <strong>and</strong>recreati<strong>on</strong> vehicles.
Table 1 EXPENDITURE ON SELECTED SPORTS AND PHYSICAL RECREATION PRODUCTS BY AUSTRALIANHOUSEHOLDS – 2003–04AveragehouseholdexpenditureTotalhouseholdexpenditureNumber ofhouseholdsreportingexpenditure(a)$/w eek $m/year '000<strong>Sports</strong> <strong>and</strong> recreati<strong>on</strong> vehiclesBicycles *0.13 *52.4 (b)61.1Boats, their parts <strong>and</strong> accessories 0.98 395.3 (c)51.8Total 1.11 447.7 112.9<strong>Sports</strong>, physical recreati<strong>on</strong> <strong>and</strong> camping equipmentCamping equipment 0.33 133.1 72.6Fishing equipment 0.46 185.5 178.3Golf equipment 0.20 80.7 82.2<strong>Sports</strong> or physical recreati<strong>on</strong> footw ear 1.14 459.8 228.0Sw imming pools 3.41 1,375.4 (b)86.7Other sports <strong>and</strong> physical recreati<strong>on</strong> equipment 2.03 818.8 441.1Total 7.57 3,053.3 978.4<strong>Sports</strong> <strong>and</strong> physical recreati<strong>on</strong> servicesHire of sports equipment *0.06 *24.2 33.8Health <strong>and</strong> fitness studio charges 1.44 580.8 332.2Sporting club subscrpti<strong>on</strong>s 1.04 419.5 236.1Spectator admissi<strong>on</strong> fees to sport 0.73 294.4 278.6<strong>Sports</strong> facility hire charges 2.30 927.7 1,225.1<strong>Sports</strong> less<strong>on</strong>s 1.05 423.5 294.3<strong>Physical</strong> recreati<strong>on</strong> charges nec(d) 0.40 161.3 444.9Total 7.02 2,831.5 2,169.2Total expenditure <strong>on</strong> selected sports <strong>and</strong>physical recreati<strong>on</strong> products 15.70 6,332.5 2,717.7Total expenditure <strong>on</strong> all products 886.63 357,617.4 7,735.8* estimate has a relative st<strong>and</strong>ard error of betw een 25% <strong>and</strong> 50% <strong>and</strong> should be used w ith cauti<strong>on</strong>(a) <str<strong>on</strong>g>Household</str<strong>on</strong>g>s reporting expenditure in the tw o w eek enumerati<strong>on</strong> period unless otherw ise noted.(b) <str<strong>on</strong>g>Household</str<strong>on</strong>g>s reporting expenditure in the tw elve m<strong>on</strong>ths prior to interview .(c) <str<strong>on</strong>g>Household</str<strong>on</strong>g>s reporting expenditure in the tw elve m<strong>on</strong>ths or tw o w eeks prior to interview for differentcommodities w ithin this category.(d) This is a new expenditure category for 2003–04 <strong>and</strong> includes charges for horse riding, ice-skating,snooker <strong>and</strong> related games, sw imming pool admissi<strong>on</strong>, parasailing <strong>and</strong> skydiving. For 1998–99 these w ereall included in an expenditure category w hich w as predominantly out of scope of sports <strong>and</strong> physicalrecreati<strong>on</strong>.
2 Comparis<strong>on</strong> of <strong>Sports</strong> <strong>and</strong> <strong>Physical</strong> Recreati<strong>on</strong> <str<strong>on</strong>g>Expenditure</str<strong>on</strong>g> Over TimeChanges in expenditure over time are a result of changes in prices (both in the general level of prices<strong>and</strong> the relative prices of different products) <strong>and</strong> changes in quantities of products purchased. Peoplemay pay more (or less) for items or collectively buy more (or less) of them for a variety of reas<strong>on</strong>s,such as• changes in the quality of a product• the introducti<strong>on</strong> of new products• changes in people’s preferences• changes in the compositi<strong>on</strong> of the populati<strong>on</strong> (e.g. age, ethnicity, family size, etc.)• increases in the number of people <strong>and</strong> the number of households.It is possible to adjust <str<strong>on</strong>g>Household</str<strong>on</strong>g> <str<strong>on</strong>g>Expenditure</str<strong>on</strong>g> Survey data for different years to eliminate the effect ofprice changes. This enables a better underst<strong>and</strong>ing of the change in dem<strong>and</strong> over time for sports <strong>and</strong>physical recreati<strong>on</strong> products. The effect of price changes can be removed by adjusting theexpenditure <strong>on</strong> each product category by the index number for the relevant sub-group of theC<strong>on</strong>sumer Price Index (CPI). The time period comparis<strong>on</strong>s presented in the graph below <strong>and</strong> in table2 are in c<strong>on</strong>stant price terms – that is, for both 1998–99 <strong>and</strong> 2003–04, the expenditure <strong>on</strong> sports <strong>and</strong>physical recreati<strong>on</strong> products is presented in 2003–04 prices. However, these data should be treatedwith cauti<strong>on</strong> as the sub-groups of the CPI do not corresp<strong>on</strong>d exactly to the product categories used bythe <str<strong>on</strong>g>Household</str<strong>on</strong>g> <str<strong>on</strong>g>Expenditure</str<strong>on</strong>g> Survey. In additi<strong>on</strong>, the CPI is <strong>on</strong>ly applicable to capital cities, whereasthe <str<strong>on</strong>g>Household</str<strong>on</strong>g> <str<strong>on</strong>g>Expenditure</str<strong>on</strong>g> Survey covers households throughout Australia. Also, there are twoproduct categories which have a slightly different c<strong>on</strong>tent for 2003–04 than they did for 1998–99.These differences – which will have <strong>on</strong>ly a slight effect <strong>on</strong> comparability – are detailed in the footnotesto table 2.AVERAGE WEEKLY HOUSEHOLD EXPENDITURE(a) ON SELECTED SPORTS AND PHYSICAL RECREATIONPRODUCTS—1998–99 <strong>and</strong> 2003–04BicyclesBoats, their parts <strong>and</strong> accessoriesCamping equipmentFishing equipmentGolf equipment<strong>Sports</strong> or physical recreati<strong>on</strong> footwearSwimming poolsOther sports & physical recreati<strong>on</strong> equipmentHire of sports equipmentHealth <strong>and</strong> fitness studio chargesSporting club subscripti<strong>on</strong>sSpectator admissi<strong>on</strong> fees to sport<strong>Sports</strong> facility hire charges<strong>Sports</strong> less<strong>on</strong>s(a) At 2003–04 prices.1998–992003–040 0.5 1.0 1.5 2.0 2.5 3.0 3.5$/weekOverall, the average weekly expenditure <strong>on</strong> sports <strong>and</strong> physical recreati<strong>on</strong> products increased by18.8%, from $12.88 in 1998–99 to $15.30 in 2003–04, despite a slight fall in the percentage ofhouseholds reporting this expenditure.This rise was largely the result of substantial increases in expenditure <strong>on</strong> Swimming pools, Othersports <strong>and</strong> physical recreati<strong>on</strong> equipment, <strong>and</strong> Health <strong>and</strong> fitness studio charges counteracting falls inexpenditure <strong>on</strong> several other product categories. The average expenditure <strong>on</strong> Swimming pools roseby 106.7% from $1.65 per week to $3.41 per week, while the increase for Other sports <strong>and</strong> physicalrecreati<strong>on</strong> equipment was similar at 107.1% from $0.98 to $2.03. For Health <strong>and</strong> fitness studiocharges, average weekly expenditure rose by 92.0% from $0.75 to $1.44.
The rise in expenditure <strong>on</strong> Health <strong>and</strong> fitness studio charges was accompanied by an increase from2.8% to 4.3% in the percentage of households reporting this expenditure. Over the same period,average weekly expenditure <strong>on</strong> <strong>Sports</strong> facility hire charges fell from $2.81 to $2.30 while thepercentage of households reporting this expenditure decreased from 19.3% to 15.8%. This suggeststhat health <strong>and</strong> fitness studios may have gained business at the expense of sports facilities.The total annual expenditure <strong>on</strong> sport <strong>and</strong> physical recreati<strong>on</strong> products by all Australian householdsrose by 29.0% from $4,784.9m in 1998–99 to $6,171.2m in 2003–04. This was brought about by theincrease in average weekly household expenditure (18.8%) in combinati<strong>on</strong> with an 8.6% increase inthe total number of Australian households from 7.1m to 7.7m over the same period. The increase intotal annual expenditure <strong>on</strong> all products over this period was 16.7% from $306,329.4m to$357,617.4m.
Table 2 HOUSEHOLD EXPENDITURE ON SELECTED SPORTS AND PHYSICAL RECREATION PRODUCTS AT CONSTANT PRICES(a)– 1998–99 <strong>and</strong> 2003–04AVERAGE HOUSEHOLDEXPENDITURETOTAL HOUSEHOLDEXPENDITUREPERCENTAGE OFHOUSEHOLDSREPORTING EXPENDITURE1998–99 2003–04 1998–99 2003–04 1998–99 2003–04$/w eek $/w eek $m/year $m/year % %<strong>Sports</strong> <strong>and</strong> recreati<strong>on</strong> vehiclesBicycles 0.11 *0.13 40.4 *52.4 1.6 0.8Boats, their parts <strong>and</strong> accessories *1.10 0.98 *406.9 395.3 1.4 0.7Total *1.20 1.11 *447.3 447.7 2.8 1.5<strong>Sports</strong>, physical recreati<strong>on</strong> <strong>and</strong> campingequipmentCamping equipment *0.30 0.33 *111.0 133.1 0.8 0.9Fishing equipment 0.38 0.46 141.2 185.5 3.5 2.3Golf equipment 0.22 0.20 80.7 80.7 1.4 1.1<strong>Sports</strong> or physical recreati<strong>on</strong> footw ear 1.03 1.14 380.7 459.8 3.5 2.9Sw imming pools 1.65 3.41 611.5 1,375.4 0.7 1.1Other sports <strong>and</strong> physical recreati<strong>on</strong>equipment(b) 0.98 2.03 363.1 818.8 5.1 5.7Total 4.55 7.57 1,688.3 3,053.3 13.3 12.6<strong>Sports</strong> <strong>and</strong> physical recreati<strong>on</strong> servicesHire of sports equipment *0.16 *0.06 *60.4 *24.2 0.9 0.4Health <strong>and</strong> fitness studio charges 0.75 1.44 276.9 580.8 2.8 4.3Sporting club subscripti<strong>on</strong>s 1.30 1.04 483.1 419.5 2.6 3.1Spectator admissi<strong>on</strong> fees to sport 0.94 0.73 349.3 294.4 5.1 3.6<strong>Sports</strong> facility hire charges(c) 2.81 2.30 1,041.8 927.7 19.3 15.8<strong>Sports</strong> less<strong>on</strong>s 1.18 1.05 437.8 423.5 3.8 3.8Total(d) 7.13 6.62 2,649.3 2,670.1 27.1 24.8Total expenditure <strong>on</strong> selected sports<strong>and</strong> physical recreati<strong>on</strong> products(d) 12.88 15.30 4,784.9 6,171.2 35.9 32.6Total expenditure <strong>on</strong> all products 824.83 886.63 306,329.4 357,617.4 100.0 100.0* estimate has a relative st<strong>and</strong>ard error of betw een 25% <strong>and</strong> 50% <strong>and</strong> should be used w ith cauti<strong>on</strong>(a) At 2003–04 prices.(b) In additi<strong>on</strong> to the products included for 1998–99, for 2003–04 this expenditure category includes skipping ropes, roller blades,roller skates, skateboards <strong>and</strong> toboggans. For 1998–99 these w ere all included in an expenditure category w hich w aspredominantly out of scope of sports <strong>and</strong> physical recreati<strong>on</strong>.(c) In additi<strong>on</strong> to the products included for 1998–99, for 2003–04 this expenditure category includes tenpin bow ling parties. For1998–99 these w ere included in an expenditure category w hich w as predominantly out of scope of sports <strong>and</strong> physicalrecreati<strong>on</strong>.(d) Excludes <strong>Physical</strong> recreati<strong>on</strong> charges nec because this expenditure category did not exist at the time of the 1998–99<str<strong>on</strong>g>Household</str<strong>on</strong>g> <str<strong>on</strong>g>Expenditure</str<strong>on</strong>g> Survey. For the 1998-99 survey, the comp<strong>on</strong>ent products of <strong>Physical</strong> recreati<strong>on</strong> charges nec w ereincluded in an expenditure category predominantly out of scope of sports <strong>and</strong> physical recreati<strong>on</strong>.
3 <strong>Sports</strong> <strong>and</strong> <strong>Physical</strong> Recreati<strong>on</strong> <str<strong>on</strong>g>Expenditure</str<strong>on</strong>g> by Major Regi<strong>on</strong>Table 3 shows that the average weekly household expenditure <strong>on</strong> <strong>Sports</strong> <strong>and</strong> physical recreati<strong>on</strong>services during 2003–04 for people living in capital cities was 35.6% higher than for people livingelsewhere – $7.77 compared with $5.73. On the other h<strong>and</strong>, the average weekly householdexpenditure <strong>on</strong> <strong>Sports</strong>, physical recreati<strong>on</strong> <strong>and</strong> camping equipment was 31.3% lower in the capitalcities than elsewhere – $6.50 compared with $9.46. This was largely due to the estimate ofexpenditure <strong>on</strong> swimming pools being c<strong>on</strong>siderably higher for areas outside the capital cities. Theoverall estimates of household expenditure <strong>on</strong> sports <strong>and</strong> physical recreati<strong>on</strong> products were $15.50for capital cities <strong>and</strong> $16.10 for other areas. However, the difference in these estimates was notstatistically significant.AVERAGE WEEKLY HOUSEHOLD EXPENDITURE ON SELECTED SPORTS AND PHYSICAL RECREATIONPRODUCTS, By major regi<strong>on</strong>—2003–04BicyclesBoats, their parts <strong>and</strong> accessoriesCamping equipmentFishing equipmentGolf equipment<strong>Sports</strong> or physical recreati<strong>on</strong> footwearSwimming poolsOther sports & physical recreati<strong>on</strong> equipmentHire of sports equipmentHealth <strong>and</strong> fitness studio chargesSporting club subscrpti<strong>on</strong>sSpectator admissi<strong>on</strong> fees to sport<strong>Sports</strong> facility hire charges<strong>Sports</strong> less<strong>on</strong>s<strong>Physical</strong> recreati<strong>on</strong> charges necCapital cityRest of state0 1 2 3 4 5$/weekThe lack of significant difference between capital-city <strong>and</strong> rest-of-state spending <strong>on</strong> sports <strong>and</strong>physical recreati<strong>on</strong> c<strong>on</strong>trasts with the situati<strong>on</strong>s existing for spending <strong>on</strong> all products, <strong>and</strong> for averagehousehold income. The average weekly household expenditure in capital cities <strong>on</strong> all products was18.4% higher than in other areas – $940.12 compared with $793.82. Similarly, the capital-city averageweekly household income of $1,210 was 22.7% higher than the corresp<strong>on</strong>ding rest-of-state figure of$986. Hence, despite their average income being lower, the spending by regi<strong>on</strong>al households <strong>on</strong>sports <strong>and</strong> physical recreati<strong>on</strong> products in 2003-04 was similar to that of their capital-citycounterparts. In percentage terms, regi<strong>on</strong>al households spent 1.6% of their weekly income <strong>on</strong> sports<strong>and</strong> physical recreati<strong>on</strong>, compared with 1.3% for capital-city households.The lack of significant regi<strong>on</strong>al difference in sports <strong>and</strong> physical recreati<strong>on</strong> spending in 2003–04 alsoc<strong>on</strong>trasts with the corresp<strong>on</strong>ding data from the previous <str<strong>on</strong>g>Household</str<strong>on</strong>g> <str<strong>on</strong>g>Expenditure</str<strong>on</strong>g> Survey. For 1998–99, sports <strong>and</strong> physical recreati<strong>on</strong> spending in capital cities was 18.2% higher than in other areas –$11.68 per week compared with $9.88 (1998–99 prices).
Table 3 HOUSEHOLD EXPENDITURE ON SELECTED SPORTS AND PHYSICAL RECREATION PRODUCTS, Bymajor regi<strong>on</strong> – 2003–04Capital city Rest of state AustraliaAVERAGE WEEKLY HOUSEHOLD EXPENDITURE ($)<strong>Sports</strong> <strong>and</strong> recreati<strong>on</strong> vehiclesBicycles *0.16 *0.08 *0.13Boats, their parts <strong>and</strong> accessories *1.07 *0.83 0.98Total *1.23 *0.91 1.11<strong>Sports</strong>, physical recreati<strong>on</strong> <strong>and</strong> camping equipmentCamping equipment 0.25 *0.48 0.33Fishing equipment *0.39 *0.58 0.46Golf equipment *0.20 *0.21 0.20<strong>Sports</strong> or physical recreati<strong>on</strong> footw ear 1.12 1.19 1.14Sw imming pools 2.48 *5.01 3.41Other sports <strong>and</strong> physical recreati<strong>on</strong> equipment 2.06 *1.99 2.03Total 6.50 9.46 7.57<strong>Sports</strong> <strong>and</strong> physical recreati<strong>on</strong> servicesHire of sports equipment *0.08 **0.01 *0.06Health <strong>and</strong> fitness studio charges 1.77 *0.85 1.44Sporting club subscrpti<strong>on</strong>s 1.17 0.82 1.04Spectator admissi<strong>on</strong> fees to sport 0.82 *0.57 0.73<strong>Sports</strong> facility hire charges 2.20 2.51 2.30<strong>Sports</strong> less<strong>on</strong>s 1.28 *0.66 1.05<strong>Physical</strong> recreati<strong>on</strong> charges nec 0.45 *0.31 0.40Total 7.77 5.73 7.02Total expenditure <strong>on</strong> selected sports <strong>and</strong>physical recreati<strong>on</strong> products 15.50 16.10 15.70Total expenditure <strong>on</strong> all products 940.12 793.82 886.63Average w eekly household income ($) 1,210 986 1,128Number of households ('000) 4,907.5 2,828.2 7,735.8Number of pers<strong>on</strong>s ('000) 12,567.8 7,038.9 19,606.6* estimate has a relative st<strong>and</strong>ard error of betw een 25% <strong>and</strong> 50% <strong>and</strong> should be used w ith cauti<strong>on</strong>** estimate has a relative st<strong>and</strong>ard error greater than 50% but less than or equal to 75% <strong>and</strong> is c<strong>on</strong>sidered toounreliable for general use
4 <strong>Sports</strong> <strong>and</strong> <strong>Physical</strong> Recreati<strong>on</strong> <str<strong>on</strong>g>Expenditure</str<strong>on</strong>g> by States <strong>and</strong> TerritoriesFor 2003–04, the state or territory with the highest estimate of average weekly household expenditure<strong>on</strong> sports <strong>and</strong> physical recreati<strong>on</strong> products was the Northern Territory with $42.17. This was morethan double the next highest figure of $20.83 recorded for the Australian Capital Territory. However,the Northern Territory estimate has a very high relative st<strong>and</strong>ard error (57.2%) <strong>and</strong> hence isc<strong>on</strong>sidered too unreliable for general use. As a result, it has been omitted from the graph below.Across the states, sports <strong>and</strong> physical recreati<strong>on</strong> expenditure ranged from $9.63 per week in SouthAustralia to $17.84 per week in Queensl<strong>and</strong>.AVERAGE WEEKLY HOUSEHOLD EXPENDITURE ON SELECTED SPORTS AND PHYSICAL RECREATIONPRODUCTS, By states <strong>and</strong> territories—2003–04$/week2520151050NSW Vic. Qld SA WA Tas. ACTThe South Australian expenditure of $9.63 per week was significantly lower than the expenditurelevels of all the states <strong>and</strong> the territory appearing in the graph above with the excepti<strong>on</strong> of Tasmania.This c<strong>on</strong>trasts with the results of the 1998–99 <str<strong>on</strong>g>Household</str<strong>on</strong>g> <str<strong>on</strong>g>Expenditure</str<strong>on</strong>g> Survey in which the estimatefor South Australia was exceeded <strong>on</strong>ly by those for the two territories.AVERAGE WEEKLY HOUSEHOLD EXPENDITURE ON SELECTED SPORTS AND PHYSICAL RECREATIONPRODUCTS, By states <strong>and</strong> territories—1998–99$/week20151050NSW Vic. Qld SA WA Tas. NT ACT
The fall, relative to the other states <strong>and</strong> territories, in South Australian household expenditure <strong>on</strong>sports <strong>and</strong> physical recreati<strong>on</strong> also c<strong>on</strong>trasts with the results of the <str<strong>on</strong>g>Household</str<strong>on</strong>g> <str<strong>on</strong>g>Expenditure</str<strong>on</strong>g> Surveywith respect to cultural expenditure. The level of South Australian cultural expenditure relative to theoverall level of the other states <strong>and</strong> territories was similar for both the 1998-99 <strong>and</strong> 2003-04 surveys<strong>and</strong>, relative to a couple of states, was actually higher in 2003-04.In 2003–04, the Northern Territory <strong>and</strong> the Australian Capital Territory had the highest levels of bothaverage weekly household income ($1,401 <strong>and</strong> $1,399 respectively) <strong>and</strong> average weekly householdexpenditure <strong>on</strong> all products ($1,040.72 <strong>and</strong> $1,054.66 respectively). For both data items, the statewith the lowest estimate was Tasmania.The percentage of total expenditure devoted to sports <strong>and</strong> physical recreati<strong>on</strong> ranged from 1.2% inSouth Australia up to 2.2% in Queensl<strong>and</strong>, compared with 1.8% for Australia as a whole. Forhousehold income, the percentage devoted to sports <strong>and</strong> physical recreati<strong>on</strong> expenditure was 1.4%for Australia, but ranged from 0.9% in South Australia to 1.7% in Queensl<strong>and</strong>.
Table 4 HOUSEHOLD EXPENDITURE ON SELECTED SPORTS AND PHYSICAL RECREATION PRODUCTS, By states <strong>and</strong> territories– 2003–04NSW Vic. Qld SA WA Tas. NT(a) ACT Aust.AVERAGE WEEKLY HOUSEHOLD EXPENDITURE ($)<strong>Sports</strong> <strong>and</strong> recreati<strong>on</strong> vehiclesBicycles **0.26 *0.05 **0.03 *0.16 *0.10 np **0.03 **0.45 *0.13Boats, their parts <strong>and</strong> accessories *0.85 *0.83 np **1.19 **0.76 **2.04 np np 0.98Total *1.11 *0.88 **0.45 **1.35 **0.86 **2.09 np **1.05 1.11<strong>Sports</strong>, physical recreati<strong>on</strong> <strong>and</strong> campingequipmentCamping equipment *0.16 *0.56 *0.50 **0.31 np np **0.47 **0.15 0.33Fishing equipment *0.28 *0.34 **0.35 *0.26 **1.64 *0.52 *1.74 np 0.46Golf equipment *0.19 *0.18 **0.24 *0.17 **0.14 **0.19 np np 0.20<strong>Sports</strong> or physical recreati<strong>on</strong> footw ear 1.20 1.60 *0.89 *1.05 *0.61 *0.59 *0.96 *1.12 1.14Sw imming pools *3.42 *1.96 *6.98 **0.59 *2.82 np *3.45 np 3.41Other sports <strong>and</strong> physical recreati<strong>on</strong>equipment 2.17 *2.64 *1.97 0.53 *1.60 *1.84 **2.63 *1.35 2.03Total 7.42 7.28 10.93 2.91 *6.88 *4.24 9.28 *6.92 7.57<strong>Sports</strong> <strong>and</strong> physical recreati<strong>on</strong> servicesHire of sports equipment *0.02 **0.03 **0.02 np np **0.04 np np *0.06Health <strong>and</strong> fitness studio charges 0.96 *1.62 *2.13 1.13 *1.10 *0.35 **2.15 *4.60 1.44Sporting club subscrpti<strong>on</strong>s 0.68 1.47 *0.88 *0.50 **1.94 *1.39 **0.33 np 1.04Spectator admissi<strong>on</strong> fees to sport *0.98 1.06 *0.22 0.51 *0.25 *0.40 0.69 *1.33 0.73<strong>Sports</strong> facility hire charges 2.31 2.41 2.14 2.00 2.40 1.65 3.29 *4.13 2.30<strong>Sports</strong> less<strong>on</strong>s 1.17 1.16 0.86 *0.90 *1.10 *0.43 *0.62 *0.98 1.05<strong>Physical</strong> recreati<strong>on</strong> charges nec 0.56 0.37 0.21 *0.26 0.35 *0.29 *0.26 *1.02 0.40Total 6.68 8.12 6.46 5.37 7.44 4.55 7.43 12.86 7.02Total expenditure <strong>on</strong> selected sports<strong>and</strong> physical recreati<strong>on</strong> products 15.21 16.28 17.84 9.63 15.18 10.88 **42.17 20.83 15.70Total expenditure <strong>on</strong> all products 941.06 889.70 826.65 814.14 873.25 754.23 1,040.72 1,054.66 886.63Average w eekly household income ($) 1,212 1,134 1,036 1,033 1,098 897 1,401 1,399 1,128Number of households ('000) 2,523.5 1,906.0 1,526.4 626.5 770.5 198.2 56.2 128.7 7,735.8Number of pers<strong>on</strong>s ('000) 6,602.2 4,871.3 3,764.8 1,502.6 1,932.6 472.6 145.8 314.8 19,606.6* estimate has a relative st<strong>and</strong>ard error of betw een 25% <strong>and</strong> 50% <strong>and</strong> should be used w ith cauti<strong>on</strong>** estimate has a relative st<strong>and</strong>ard error greater than 50% but less than or equal to 75% <strong>and</strong> is c<strong>on</strong>sidered too unreliable forgeneral usenp not available for publicati<strong>on</strong> but included in totals w here applicable (relative st<strong>and</strong>ard error greater than 75%)(a) Comprises predominantly urban areas <strong>on</strong>ly.
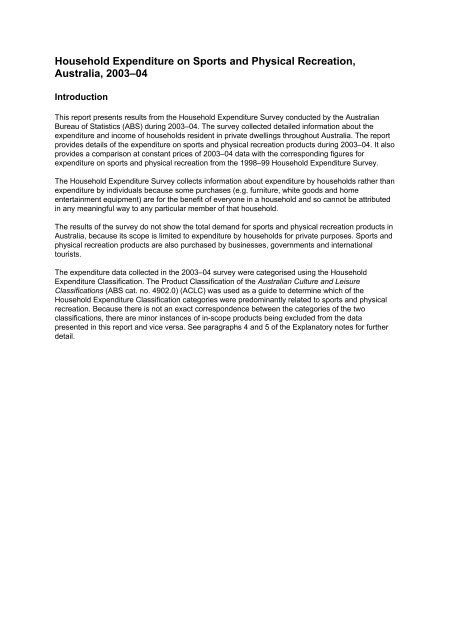
Explanatory notesIntroducti<strong>on</strong>1 The ABS collects informati<strong>on</strong> about the expenditure <strong>and</strong> income of households resident inprivate dwellings throughout Australia approximately every five years via the <str<strong>on</strong>g>Household</str<strong>on</strong>g> <str<strong>on</strong>g>Expenditure</str<strong>on</strong>g>Survey. This report presents some informati<strong>on</strong> from the 2003–04 <str<strong>on</strong>g>Household</str<strong>on</strong>g> <str<strong>on</strong>g>Expenditure</str<strong>on</strong>g> Surveyabout the purchase by households of sports <strong>and</strong> physical recreati<strong>on</strong> products. It also presents acomparis<strong>on</strong> at c<strong>on</strong>stant prices of this 2003–04 data with the data relating to sports <strong>and</strong> physicalrecreati<strong>on</strong> purchases made by households during 1998–99.2 For the 2003–04 <str<strong>on</strong>g>Household</str<strong>on</strong>g> <str<strong>on</strong>g>Expenditure</str<strong>on</strong>g> Survey, informati<strong>on</strong> was collected during pers<strong>on</strong>alinterviews <strong>and</strong> from diaries in which survey participants recorded all their expenditure over a two-weekperiod. For some of the less frequently purchased items, the time period asked about varied fromthree m<strong>on</strong>ths (e.g. for video cassette recorders) to two years for real estate. Interviews were evenlyspread throughout the financial year beginning July 2003 <strong>and</strong> ending June 2004.<str<strong>on</strong>g>Expenditure</str<strong>on</strong>g> classificati<strong>on</strong>s3 The 2003–04 <str<strong>on</strong>g>Household</str<strong>on</strong>g> <str<strong>on</strong>g>Expenditure</str<strong>on</strong>g> Survey used the <str<strong>on</strong>g>Household</str<strong>on</strong>g> <str<strong>on</strong>g>Expenditure</str<strong>on</strong>g> Classificati<strong>on</strong> tocategorise products. The Australian Culture <strong>and</strong> Leisure Classificati<strong>on</strong>s (ABS cat. no. 4902.0) (ACLC)was used as a guide to determine which of the <str<strong>on</strong>g>Household</str<strong>on</strong>g> <str<strong>on</strong>g>Expenditure</str<strong>on</strong>g> Classificati<strong>on</strong> categories werepredominantly related to sports <strong>and</strong> physical recreati<strong>on</strong>. See the appendix for examples of theproducts included in each of the categories presented in this report.4 Because there is not an exact match between the categories of the <str<strong>on</strong>g>Household</str<strong>on</strong>g> <str<strong>on</strong>g>Expenditure</str<strong>on</strong>g>Classificati<strong>on</strong> <strong>and</strong> those of the Product Classificati<strong>on</strong> of the ACLC, there are instances of individualproducts which are out of scope of the ACLC being included, <strong>and</strong> in-scope products being excluded.For example; sports bags, gun oil <strong>and</strong> powder scales are all classed as sports <strong>and</strong> physical recreati<strong>on</strong>equipment in the <str<strong>on</strong>g>Household</str<strong>on</strong>g> <str<strong>on</strong>g>Expenditure</str<strong>on</strong>g> Classificati<strong>on</strong> but are out of scope of the ACLC ProductClassificati<strong>on</strong>.5 There are some products which the ACLC deems in scope of sports <strong>and</strong> physical recreati<strong>on</strong>,but which were included in other leisure categories of the <str<strong>on</strong>g>Household</str<strong>on</strong>g> <str<strong>on</strong>g>Expenditure</str<strong>on</strong>g> Classificati<strong>on</strong> for1998–99. For 2003–04, many of these have been moved to sports <strong>and</strong> physical recreati<strong>on</strong> categoriesof the <str<strong>on</strong>g>Household</str<strong>on</strong>g> <str<strong>on</strong>g>Expenditure</str<strong>on</strong>g> Classificati<strong>on</strong>.• For 2003–04, in additi<strong>on</strong> to the products included for 1998–99, the expenditure categoryOther sports <strong>and</strong> physical recreati<strong>on</strong> equipment includes skipping ropes, roller blades, rollerskates, skateboards <strong>and</strong> toboggans.• For 2003–04, in additi<strong>on</strong> to the products included for 1998–99, the expenditure category<strong>Sports</strong> facility hire charges includes tenpin bowling parties.• For 2003–04, <strong>Physical</strong> recreati<strong>on</strong> charges nec is a new <str<strong>on</strong>g>Household</str<strong>on</strong>g> <str<strong>on</strong>g>Expenditure</str<strong>on</strong>g> Classificati<strong>on</strong>category which the ACLC deems in scope of sports <strong>and</strong> physical recreati<strong>on</strong>. It includescharges for horse riding, ice-skating, snooker <strong>and</strong> related games, swimming pool admissi<strong>on</strong>,parasailing <strong>and</strong> skydiving. Given that this expenditure category did not exist for 1998–99, ithas been excluded from the comparis<strong>on</strong> of sports <strong>and</strong> physical recreati<strong>on</strong> expenditure overtime which is presented in table 2.6 Because of high relative st<strong>and</strong>ard errors being associated with the <str<strong>on</strong>g>Household</str<strong>on</strong>g> <str<strong>on</strong>g>Expenditure</str<strong>on</strong>g>Classificati<strong>on</strong> category Above ground pools, it was necessary to combine it with the category Ingroundswimming pools in order to present useful data. For neatness of presentati<strong>on</strong>, the combinedcategory Swimming pools has been included in the report as part of the product group <strong>Sports</strong>,physical recreati<strong>on</strong> <strong>and</strong> camping equipment. It should be noted that, in the ACLC Product
APPENDIX - SPORTS, PHYSICAL RECREATION AND OTHER LEISURE CATEGORIES IN THEHOUSEHOLD EXPENDITURE CLASSIFICATIONThe following list gives examples of the types of items included in the categories of the <str<strong>on</strong>g>Household</str<strong>on</strong>g><str<strong>on</strong>g>Expenditure</str<strong>on</strong>g> Classificati<strong>on</strong> which appear in this report. The industry <strong>and</strong> product classificati<strong>on</strong>s of theAustralian Culture <strong>and</strong> Leisure Classificati<strong>on</strong>s, 2001 (ABS Cat. no. 4902.0) were the guides used indetermining which <str<strong>on</strong>g>Household</str<strong>on</strong>g> <str<strong>on</strong>g>Expenditure</str<strong>on</strong>g> Classificati<strong>on</strong> categories c<strong>on</strong>sisted wholly or predominantlyof sports <strong>and</strong> physical recreati<strong>on</strong> products.SPORTS AND PHYSICAL RECREATIONSPORTS AND RECREATION VEHICLESBicyclesBoats, their parts <strong>and</strong> accessoriesAnchorAnchor ropeBoatBoat accessoriesBoat engineBoat licenceBoat partsBoat ramp launching feeCanoeDepth sounderKayakLife jacketLife raftMarine radioOarPaddleRadar (marine)Rowing boatSail for boatSailing boatS<strong>on</strong>arYachtSPORTS, PHYSICAL RECREATION AND CAMPING EQUIPMENTCamping equipmentCamp bedCamp stretcherCamping equipmentFly sheetGround sheetSleeping bagSpace blanketTentTent pegsTent polesFishing equipmentFishing baitFishing equipmentFishing reelFishing rodFishing tackle
Tackle box (fishing)Wire traceGolf equipmentGolf bagGolf ballsGolf buggyGolf clubsGolf tees<strong>Sports</strong> or physical recreati<strong>on</strong> footwearFootball bootsGolf shoesGym bootsJogging shoesRunning shoesRunning spikesS<strong>and</strong> shoesSneakersSpecialist sports shoes<strong>Sports</strong> <strong>and</strong> leisure footwearSwimming poolsAbove-ground swimming poolIn-ground swimming poolWading pool (children's)Other sports <strong>and</strong> physical recreati<strong>on</strong> equipmentAir rifleArchery setBag (sports)BaseballBaseball baseBaseball batBaseball gloveBasketballBasketball hoopBat (cricket)Bathing capBilliard ballsBilliard tableBow (archery)Bowling ballBoxing glovesBulletsCricket ballCricket bat gripCue (for billiards <strong>and</strong> similar games)Dart boardDart setDiving gogglesExercising equipmentFootballGo-cartGunGun cleaning kitGun oilHeadb<strong>and</strong> (sport)
Hockey ballHockey stickIce skatesMouth guardPowder scales (gun)Racquet pressRifleRoller bladesRoller skatesShin padsShot gun cartridgesShoulder padsSkateboardSki equipmentSkindiving equipmentSkipping ropeSnooker ballsSnooker tableSnow skisSoccer ballSoftballSoftball baseSoftball batSoftball glove<strong>Sports</strong> equipment necSquash ballsSquash racquetSurfboardSurfboard waxSwimming gogglesTable tennis ballTable tennis batTable tennis netTable tennis tableTennis ballsTennis racquetTobogganVolleyballVolleyball netWaterskisWetsuitWindsurferSPORTS AND PHYSICAL RECREATION SERVICESHire of sports equipmentBicycle hireGolf ball hireGolf club hireSki equipment hire<strong>Sports</strong> racquet hireTowel hireHealth <strong>and</strong> fitness studio chargesAerobic classCallisthenicsExercise classFitness assessment
Fitness classFitness membershipGym work-outHealth parlourSaunaSlimming <strong>and</strong> health parlourTurkish bathSporting club subscripti<strong>on</strong>sBowling club feesClub <strong>and</strong> associati<strong>on</strong> subs (sports clubs)Cricket club feesCroquet club feesFootball club subscripti<strong>on</strong>Golf club membership feesHockey club feesLodge subscripti<strong>on</strong> (sporting)Police boys club feesSport club feeSwimming club feesYacht club membershipSpectator admissi<strong>on</strong> fees to sportCar races admissi<strong>on</strong> feeFootball admissi<strong>on</strong> feeGolf admissi<strong>on</strong> feeHockey admissi<strong>on</strong> feeHorse races admissi<strong>on</strong> feeSoccer admissi<strong>on</strong> feeSport fixture admissi<strong>on</strong> feeTennis admissi<strong>on</strong> feeWrestling admissi<strong>on</strong> fee<strong>Sports</strong> facility hire chargesAdmissi<strong>on</strong> charge to participate in sportsBadmint<strong>on</strong> gamesBaseball feesBasketball feesBowls game (participati<strong>on</strong> fee)Bowls green feeCompetiti<strong>on</strong> fee to participate in sportCompetiti<strong>on</strong> payment (sport)Croquet game (participati<strong>on</strong> fee)Driving range feesGo kart racingGolf caddy feesGolf cart feesGolf game (participati<strong>on</strong> fee)Golf green feesGreen fees (miscellaneous)Indoor bowls (fee)Indoor cricket game (fee)Indoor soccer game (fee)Indoor tennis (fee)Injury fund (football team)Licence (sports)Mini-golf gameNetball game (fee)
Shoe hire (ten pin bowling)Ski guide feesSki lift feesSkiing fees/fares<strong>Sports</strong> fees <strong>and</strong> charges nec<strong>Sports</strong> participati<strong>on</strong> feeSquash court hireTennis club ball feeTennis court hireTennis gameTenpin bowling game (participati<strong>on</strong> fee)Ten pin bowling partyTrophy fund (e.g. for bowls)<strong>Sports</strong> Less<strong>on</strong>sBasketball holiday programCoaching (sport)Cricket holiday programFootball holiday programGym less<strong>on</strong>sHockey holiday programKarate less<strong>on</strong>sNetball holiday programOther sports holiday programsSoccer holiday program<strong>Sports</strong> less<strong>on</strong>sSquash less<strong>on</strong>sSwimming less<strong>on</strong>sTennis less<strong>on</strong>s<strong>Physical</strong> recreati<strong>on</strong> charges necBilliards gameEight ball gameEntrance fee to swimming poolHorse ridingIce skatingKelly pool gamePool game feePool table feeSkating rink feesSnooker playing feeParasailing rideSky diving