Landslide hazard zonation in high risk areas of Rethymno ... - Springer
Landslide hazard zonation in high risk areas of Rethymno ... - Springer
Landslide hazard zonation in high risk areas of Rethymno ... - Springer

You also want an ePaper? Increase the reach of your titles
YUMPU automatically turns print PDFs into web optimized ePapers that Google loves.
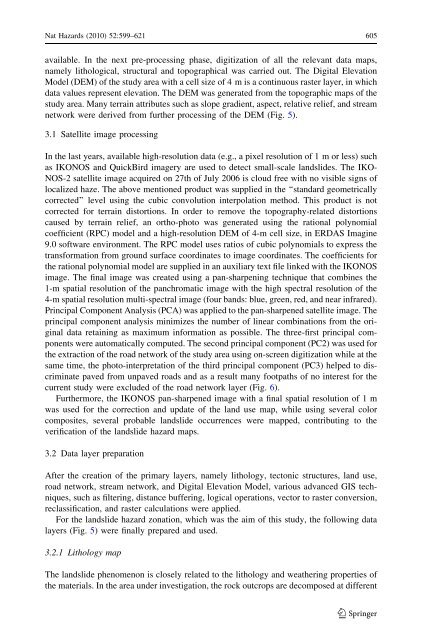
Nat Hazards (2010) 52:599–621 605available. In the next pre-process<strong>in</strong>g phase, digitization <strong>of</strong> all the relevant data maps,namely lithological, structural and topographical was carried out. The Digital ElevationModel (DEM) <strong>of</strong> the study area with a cell size <strong>of</strong> 4 m is a cont<strong>in</strong>uous raster layer, <strong>in</strong> whichdata values represent elevation. The DEM was generated from the topographic maps <strong>of</strong> thestudy area. Many terra<strong>in</strong> attributes such as slope gradient, aspect, relative relief, and streamnetwork were derived from further process<strong>in</strong>g <strong>of</strong> the DEM (Fig. 5).3.1 Satellite image process<strong>in</strong>gIn the last years, available <strong>high</strong>-resolution data (e.g., a pixel resolution <strong>of</strong> 1 m or less) suchas IKONOS and QuickBird imagery are used to detect small-scale landslides. The IKO-NOS-2 satellite image acquired on 27th <strong>of</strong> July 2006 is cloud free with no visible signs <strong>of</strong>localized haze. The above mentioned product was supplied <strong>in</strong> the ‘‘standard geometricallycorrected’’ level us<strong>in</strong>g the cubic convolution <strong>in</strong>terpolation method. This product is notcorrected for terra<strong>in</strong> distortions. In order to remove the topography-related distortionscaused by terra<strong>in</strong> relief, an ortho-photo was generated us<strong>in</strong>g the rational polynomialcoefficient (RPC) model and a <strong>high</strong>-resolution DEM <strong>of</strong> 4-m cell size, <strong>in</strong> ERDAS Imag<strong>in</strong>e9.0 s<strong>of</strong>tware environment. The RPC model uses ratios <strong>of</strong> cubic polynomials to express thetransformation from ground surface coord<strong>in</strong>ates to image coord<strong>in</strong>ates. The coefficients forthe rational polynomial model are supplied <strong>in</strong> an auxiliary text file l<strong>in</strong>ked with the IKONOSimage. The f<strong>in</strong>al image was created us<strong>in</strong>g a pan-sharpen<strong>in</strong>g technique that comb<strong>in</strong>es the1-m spatial resolution <strong>of</strong> the panchromatic image with the <strong>high</strong> spectral resolution <strong>of</strong> the4-m spatial resolution multi-spectral image (four bands: blue, green, red, and near <strong>in</strong>frared).Pr<strong>in</strong>cipal Component Analysis (PCA) was applied to the pan-sharpened satellite image. Thepr<strong>in</strong>cipal component analysis m<strong>in</strong>imizes the number <strong>of</strong> l<strong>in</strong>ear comb<strong>in</strong>ations from the orig<strong>in</strong>aldata reta<strong>in</strong><strong>in</strong>g as maximum <strong>in</strong>formation as possible. The three-first pr<strong>in</strong>cipal componentswere automatically computed. The second pr<strong>in</strong>cipal component (PC2) was used forthe extraction <strong>of</strong> the road network <strong>of</strong> the study area us<strong>in</strong>g on-screen digitization while at thesame time, the photo-<strong>in</strong>terpretation <strong>of</strong> the third pr<strong>in</strong>cipal component (PC3) helped to discrim<strong>in</strong>atepaved from unpaved roads and as a result many footpaths <strong>of</strong> no <strong>in</strong>terest for thecurrent study were excluded <strong>of</strong> the road network layer (Fig. 6).Furthermore, the IKONOS pan-sharpened image with a f<strong>in</strong>al spatial resolution <strong>of</strong> 1 mwas used for the correction and update <strong>of</strong> the land use map, while us<strong>in</strong>g several colorcomposites, several probable landslide occurrences were mapped, contribut<strong>in</strong>g to theverification <strong>of</strong> the landslide <strong>hazard</strong> maps.3.2 Data layer preparationAfter the creation <strong>of</strong> the primary layers, namely lithology, tectonic structures, land use,road network, stream network, and Digital Elevation Model, various advanced GIS techniques,such as filter<strong>in</strong>g, distance buffer<strong>in</strong>g, logical operations, vector to raster conversion,reclassification, and raster calculations were applied.For the landslide <strong>hazard</strong> <strong>zonation</strong>, which was the aim <strong>of</strong> this study, the follow<strong>in</strong>g datalayers (Fig. 5) were f<strong>in</strong>ally prepared and used.3.2.1 Lithology mapThe landslide phenomenon is closely related to the lithology and weather<strong>in</strong>g properties <strong>of</strong>the materials. In the area under <strong>in</strong>vestigation, the rock outcrops are decomposed at different123