Download PDF - OmniTrader
Download PDF - OmniTrader
Download PDF - OmniTrader

You also want an ePaper? Increase the reach of your titles
YUMPU automatically turns print PDFs into web optimized ePapers that Google loves.
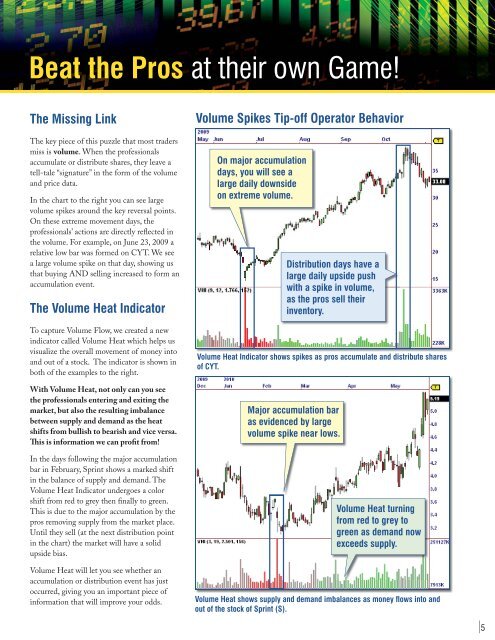
Beat the Pros at their own Game!The Missing LinkThe key piece of this puzzle that most tradersmiss is volume. When the professionalsaccumulate or distribute shares, they leave atell-tale “signature” in the form of the volumeand price data.In the chart to the right you can see largevolume spikes around the key reversal points.On these extreme movement days, theprofessionals’ actions are directly reflected inthe volume. For example, on June 23, 2009 arelative low bar was formed on CYT. We seea large volume spike on that day, showing usthat buying AND selling increased to form anaccumulation event.The Volume Heat IndicatorTo capture Volume Flow, we created a newindicator called Volume Heat which helps usvisualize the overall movement of money intoand out of a stock. The indicator is shown inboth of the examples to the right.With Volume Heat, not only can you seethe professionals entering and exiting themarket, but also the resulting imbalancebetween supply and demand as the heatshifts from bullish to bearish and vice versa.This is information we can profit from!In the days following the major accumulationbar in February, Sprint shows a marked shiftin the balance of supply and demand. TheVolume Heat Indicator undergoes a colorshift from red to grey then finally to green.This is due to the major accumulation by thepros removing supply from the market place.Until they sell (at the next distribution pointin the chart) the market will have a solidupside bias.Volume Heat will let you see whether anaccumulation or distribution event has justoccurred, giving you an important piece ofinformation that will improve your odds.Volume Spikes Tip-off Operator BehaviorOn major accumulationdays, you will see alarge daily downsideon extreme volume.Distribution days have alarge daily upside pushwith a spike in volume,as the pros sell theirinventory.Volume Heat Indicator shows spikes as pros accumulate and distribute sharesof CYT.Major accumulation baras evidenced by largevolume spike near lows.Volume Heat turningfrom red to grey togreen as demand nowexceeds supply.Volume Heat shows supply and demand imbalances as money fl ows into andout of the stock of Sprint (S).5