Download PDF - OmniTrader
Download PDF - OmniTrader
Download PDF - OmniTrader

You also want an ePaper? Increase the reach of your titles
YUMPU automatically turns print PDFs into web optimized ePapers that Google loves.
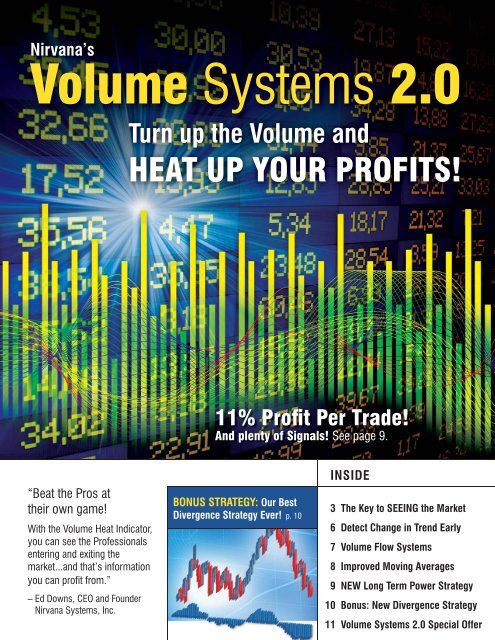
Nirvana’sVolume Systems 2.0Turn up the Volume andHEAT UP YOUR PROFITS!11% Profit Per Trade!And plenty of Signals! See page 9.“Beat the Pros attheir own game!With the Volume Heat Indicator,you can see the Professionalsentering and exiting themarket...and that’s informationyou can profi t from.”– Ed Downs, CEO and FounderNirvana Systems, Inc.BONUS STRATEGY: Our BestDivergence Strategy Ever! p. 10INSIDE3 The Key to SEEING the Market6 Detect Change in Trend Early7 Volume Flow Systems8 Improved Moving Averages9 NEW Long Term Power Strategy10 Bonus: New Divergence Strategy11 Volume Systems 2.0 Special Offer
Volume Flow AnalysisThe Key to SEEING the MarketVolume is the lifeblood of any market. Weknow that it is the imbalance in supply anddemand that makes a market move. Andclosely related to this is the concept ofliquidity—how rapidly a market will absorbour shares when we decide to sell them.A quick look at any chart will tell you thattrading volume is not uniform, but rathercomes in waves or spikes. We know that onlarge volume days, sudden buying or sellinghas entered the market for a reason, anddepending on supply and demand for theshares, price will either continue a priortrend or form a reversal.Volume Flow analysis is the study of pricemovement in the context of these unusualvolume events. In Volume Systems 2.0, webuilt several indicators designed to show ushow much movement potential exists in achart at the point one of these events occurs.Volume Heat, shown on this page anddiscussed in the article on page 5, is afabulous visual tool for quickly SEEINGthe events, because you can’t miss thechange from red to green. Using VolumeHeat as our base technology, we developedour Volume Flow Oscillator, described onpage 6, and additional Volume WeightedIndicators, Systems, and Strategies thatare showing phenomenal performance.The study of Volume Flow can show thetell-tale “signature” of professional traders.On the next page, Jeremy Williams’ articleexplains this phenomenon and expands onthe Volume Heat concept. I am extremelyproud of this research—Volume Systems 2.0is going to give our customers a decidedadvantage in their trading.Bearish VolumeHeat PredictsDecline.Volume Heat in action. By examining past price and volume behavior, theindicator can predict changes in trend, as shown here.Bullish VolumeHeat PredictsRally!Volume Heat makes it easy to see changes in trend. The other Indicators andSystems in Volume Systems 2.0 are based on this.3
An Introduction toVolume Flow Analysisby Jeremy WilliamsTrading Systems Researcher,Nirvana Systems, Inc.The Importance ofSupply and DemandABThe analysis of volume to predict futuremarket prices has been used for more than100 years, starting with the innovativemethods of Richard Wyckoff in theearly 1900’s. In recent years, advances inthese techniques have been made usingVolume Spread Analysis to decode marketmovements using certain principles regardingsupply and demand.DCDThe concept is simple and intuitive. Whendemand exceeds supply, markets will rise.When supply surpasses demand, prices fall.If supply and demand are equal, price willremain the same. By analyzing volume datain addition to the price chart, it becomespossible to not only understand the historicalroles of supply and demand, but also topredict supply and demand conditions forthe near future.The ProfessionalsThe key to predicting future supplyand demand is the behavior of the largeprofessional stock traders, sometimesreferred to as “professional operators”or the “smart money.”These major market players have a hugeeffect on the movement of stocks as theyconsistently “fleece” the less savvy smallertraders. The chart and discussion to the rightexplains the mechanics of how this happens.This “shell game” has been going on sincethe early 1900’s, yet to most small tradersthe process has remained entirely invisible—until now.The phases of market movement.A. Accumulation During a down trend professional traders wait forthe herd to panic (usually on a large bad news day) before buying. Whilethe stocks are at the low “wholesale” pricing, the professionals start coveringshorts and buying to accumulate shares to sell at a later time. The panicof the herd ensures there is an ample supply for the operators to purchasewithout moving price upward.B. Markup When the panic subsides, the professionals now hold asignificant percentage of the actively traded shares in the market. Thiscauses prices to steadily rise, not because the professionals are buying, theyalready did that. The price moves up because the professionals own thestock and they are not selling.C. Distribution The next phase occurs when the operators havedetermined that the price has risen as far as it can. Here they look to sellinto an emotional buying frenzy, usually coming on the back of bullishnews. At this point, the smart money distributes their shares to the herd,who are buying the stock at hyper-inflated (retail) prices.D. Markdown Once the herd is again holding a large portion of theactively traded shares, the prices fall. Without the buying power of the prosit is very hard to sustain demand in excess of supply.4
Beat the Pros at their own Game!The Missing LinkThe key piece of this puzzle that most tradersmiss is volume. When the professionalsaccumulate or distribute shares, they leave atell-tale “signature” in the form of the volumeand price data.In the chart to the right you can see largevolume spikes around the key reversal points.On these extreme movement days, theprofessionals’ actions are directly reflected inthe volume. For example, on June 23, 2009 arelative low bar was formed on CYT. We seea large volume spike on that day, showing usthat buying AND selling increased to form anaccumulation event.The Volume Heat IndicatorTo capture Volume Flow, we created a newindicator called Volume Heat which helps usvisualize the overall movement of money intoand out of a stock. The indicator is shown inboth of the examples to the right.With Volume Heat, not only can you seethe professionals entering and exiting themarket, but also the resulting imbalancebetween supply and demand as the heatshifts from bullish to bearish and vice versa.This is information we can profit from!In the days following the major accumulationbar in February, Sprint shows a marked shiftin the balance of supply and demand. TheVolume Heat Indicator undergoes a colorshift from red to grey then finally to green.This is due to the major accumulation by thepros removing supply from the market place.Until they sell (at the next distribution pointin the chart) the market will have a solidupside bias.Volume Heat will let you see whether anaccumulation or distribution event has justoccurred, giving you an important piece ofinformation that will improve your odds.Volume Spikes Tip-off Operator BehaviorOn major accumulationdays, you will see alarge daily downsideon extreme volume.Distribution days have alarge daily upside pushwith a spike in volume,as the pros sell theirinventory.Volume Heat Indicator shows spikes as pros accumulate and distribute sharesof CYT.Major accumulation baras evidenced by largevolume spike near lows.Volume Heat turningfrom red to grey togreen as demand nowexceeds supply.Volume Heat shows supply and demand imbalances as money fl ows into andout of the stock of Sprint (S).5
Detect Change in Trend EarlyThe NEW VolumeFlow OscillatorThe Volume Flow Oscillator, orVFO, is an advanced indicatorbased on the Volume Heat concept.It is formed by averaging bar-tobarprice differences and weightingthose differences by volume. Theresulting indicator is sensitiveto changes in volume, giving usan early indication of a potentialchange in trend.The charts to the right illustratehow VFO can be used to give us atrading advantage. In the markedzones, you can see the raw VFO(the blue line) is moving rapidlyaway from the smoothed VFO (thegreen line). When this occurs, anew trend is typically beginning.Small changeBig changeThe Volume Flow Oscillator indicates a potential change in trend when it suddenlymoves a large distance away from its moving average, compared to movement inthe price chart.A good example of this occurredon JPM in April. Note the largemove in VFO, as well as the relativeposition of VFO at the end of themove, compared to price. Theprice chart ended slightly abovethe values from early April (about$45.50), whereas the VFO chartwas easily 3 times lower than whereit was in early April. The marketproceeded to drop over 20%.If you closely examine the chartsin these examples, you can see theincrease in volume, but it would bevery easy to miss if you were notwatching VFO! That’s the value ofthe indicator. VFO was also used tocreate the Dual Volume Flow andVolume Flow Divergence Systemsdescribed on the next page.Another Volume Flow example showing sudden movement away from the movingaverage, indicating a large amount of volume in the direction of the move, at eachof the shaded zones. These events often occur ahead of strong rallies or declines.6
Systems Using Volume FlowDual VolumeFlow SystemOnce we had completed and testedthe Volume Flow Oscillator, wenaturally turned our attention togenerating Trading Systems basedon the same concept. The first iscalled Dual Volume Flow Crossover(DVF-C).This System is generated by firstcalculating a raw VFO over a certainnumber of periods (20 was used onthe chart for MSFT to the right).Then, we generate dual movingaverages of the raw VFO line (in theexample, 10 and 20 periods were usedfor the averages). As you can see, thisSystem does an excellent job of firingon trend reversals.DVF-C fi red several good reversal Signals on Microsoft.Volume FlowDivergence SystemThe second System is called VolumeFlow Divergence. This is the one weare the most excited about! On page10, you will read about the Strategywe built around VFO that is showinghigh performance on the S&P 100.But the raw VFO-D System is equallyimpressive.The Divergence concept is basedon finding “divergence” betweenan indicator and price. When theSystem detects this, it fires Longor Short. Talk about razor sharpreversals! VFO-D tends to firereversal Signals at the beginningof longer term moves. We used theVFO-D System to build the VolumeDivergence Strategy described onpage 10.The Volume Flow Divergence System (VFO-D) tends to fi re at long term reversal points,as we see here for IBM.7
Improved Moving AveragesVolume Weighted IndicatorsBy applying volume weighting to classical movingaverages, we are able to develop a much better—and faster—moving average that helps us enter themarket at better chart points AND helps protectus from a premature exit. It’s called the VolumeWeighted Moving Average, or VWMA, and it’sincluded in Volume Systems 2.0.The chart to the right for Royal Caribbeandemonstrates the concept. You can see that inMarch 2009, price crossed the 100 period VolumeWeighted Moving Average a full 5 days beforeit crossed the Exponential Moving Average—ata price difference of 20%. If we were using the100 bar Exponential Moving Average we wouldhave entered our Long position at a significantdisadvantage. Plus, if you follow the blue line, youwill see that the price chart maintains separationabove the line, keeping us in the trade longer.Volume Weighted MACDVWMA – a faster, cleanermoving average.$10.25$8.75We used VWMA to create a similar Systemto MAC-M, which is based on the differencebetween the 12 and 26 period Exponential MovingAverages. If you look at the chart to the right forGoldman Sachs, you will see that the new Systemvirtually eliminated whipsaw Signals!Why does this work? If you look carefully at theindicator, you can see that the volume weightingadjusts the curve towards the peaks and valleys.This pulls it away from the “trigger line” so itdoes not fire on the little “wiggles” or whipsawsthat hinder the MAC-M System.whipsawsOur System testing shows a significantimprovement in results for VWMACD overMACD by itself. If you are using the MAC-MSystem, you will want to consider replacing itwith this System.VWMACD-C (lower) is compared to the MAC-M system. Notice that while theSignals are similar, several whipsaws were avoided.8
Powerful NewLong Term StrategyBased on Volume Weighted IndicatorsNew Volume Systems 2.0Power Strategy generateshigh returns in recent market.Building a robust long term Strategy usingTechnical Analysis is difficult, because mosttechnical methods are more or less fixatedon the very near price action. But volumeweighting has ushered in a new era ofanalysis that has the potential to generatesuperb long term Signals.The Volume Systems 2.0 Power Strategyuses both the DVF-C and VWMACD-CSystems discussed on pages 7 and 8. Itcombines them to look for tell-tale signsthat the professionals are beginning toaccumulate a stock. And we must admit,the concept is simply amazing.In a recent test on the Russell 1000,we generated the following statisticson the 100% Mechanical Strategy:11% Profi t per Trade!The long term Strategy fi red several great trades on AVY.Period ..................... 1/09 – 6/10Trades .................... 455Hit Rate .................. 72%Average Bars ........... 38Average PPT ......... 11.8%This is an incredible average profitper trade for a Mechanical Strategy.And it’s showing 72% accuracy.When you think about the fact thatthis test was run over a large index(the Russell 1000), it’s very impressive.We are very pleased to include thisfabulous long term Strategy with ournew Volume Systems 2.0 release.Some of the long term trades in our test earned far greater than 11%. One ofthe CTAS trades shown here made nearly 40%!9
SPECIAL BONUS!Swing Trade Divergencesfor Quick Profi ts!The Divergence concept is perhapsone of the most powerful Reversaltechniques discovered by technicalanalysts. Essentially, we comparetrend slope in the price chart againstan indicator plot.When slope in the pricechart is down and theindicator is sloping upward,a sudden rally is oftenpredicted. The oppositeis true for short Signals.As soon as we got our Volume FlowOscillator we set about the task ofcreating a Divergence system basedon this concept. The results are prettyphenomenal, as shown in the twoexamples on this page. The best thingabout these Signals is they are oftenexplosive, occurring within a few barsof the actual turn in price.To test the new VFO-D System, weran it against the S&P 100 over therecent year of data. Using mechanicalexits, we are seeing accuracy acrossLongs and Shorts of over 77% and aprofit per trade of nearly 2%. Withaverage trade length just over oneweek, this kind of performance reallygets your attention.Performance on the S&P 100Jan 2009 – June 2010Longs Shorts BothNum Trades 73 79 152Hit Rate 75.3% 79.75% 77.6%Profi t/Trade 3.33% 1.23% 1.76%10
7000 N. MoPac, Suite 425Austin, Texas 78731 USAToll Free 1. 800. 880. 0338PRESORTEDFIRST CLASS MAILU.S. POSTAGEPAIDAUSTIN, TXPERMIT #1546Nirvana’sVolume Systems 2.0HEAT UP YOUR PROFITSwith the NEW Volume Heat Indicator!