Watershed Management Plan - Huron River Watershed Council
Watershed Management Plan - Huron River Watershed Council
Watershed Management Plan - Huron River Watershed Council

Create successful ePaper yourself
Turn your PDF publications into a flip-book with our unique Google optimized e-Paper software.
WATERSHED MANAGEMENTPLAN FOR THE HURON RIVER INTHE ANN ARBOR – YPSILANTIMETROPOLITAN AREAPrepared on behalf of and with funding support fromJanis A. BobrinWashtenaw County Drain CommissionerTechnical assistance fromthe <strong>Huron</strong> <strong>River</strong> <strong>Watershed</strong> <strong>Council</strong>Revised October 2011
<strong>Watershed</strong> <strong>Management</strong> <strong>Plan</strong> for the <strong>Huron</strong> <strong>River</strong> in theAnn Arbor – Ypsilanti Metropolitan AreaTABLE OF CONTENTSChapter 1Introduction1.1 The Middle <strong>Huron</strong> <strong>Watershed</strong> 1-11.2 Purpose of the <strong>Watershed</strong> <strong>Management</strong> <strong>Plan</strong> 1-31.2.1 Total Maximum Daily Load Program 1-61.2.2 Other Subwatershed <strong>Management</strong> <strong>Plan</strong>s 1-71.3 <strong>Watershed</strong> <strong>Management</strong> <strong>Plan</strong> Community Input 1-81.3.1 Technical Advisory Committees 1-81.3.2 Input from Local Subwatershed and Creek Groups 1-9Chapter 2Current Conditions2.1 Landscape and Natural Features 2-12.1.1 Climate and Topography 2-12.1.2 Geology and Soils 2-22.1.3 Significant Natural Features and Biota 2-22.1.4 Hydrology 2-62.2 Communities and Current Land Use 2-212.2.1 Political Structure 2-212.2.2 Growth Trends 2-222.2.3 Land Use and Development 2-252.2.4 Existing Point Sources 2-262.2.5 Sanitary Sewer Service Areas andPrivately Owned Septic Systems 2-272.3 Water Quality Indicators 2-352.3.1 Chemical and Physical Indicators 2-352.3.2 Aquatic Biological Communities 2-422.3.3 Lake Behavior (Limnology) 2-442.4 Creekshed Reviews 2-462.4.1 <strong>Huron</strong> <strong>River</strong> Direct Drainage 2-462.4.2 Allens Creek 2-512.4.3 Boyden Creek 2-522.4.4 Fleming Creek 2-532.4.5 Honey Creek 2-562.4.6 Malletts Creek 2-582.4.7 Millers Creek 2-632.4.8 Swift Run 2-652.4.9 Traver Creek 2-672.4.10 Ford Lake 2-692.4.11 Belleville Lake 2-692.5 Critical Areas 2-702.5.1 Loading of Pollutants to Impaired Waters 2-79
Chapter 3<strong>Watershed</strong> Action <strong>Plan</strong>3.1 Designated and Desired Uses 3-13.2 Impairments and their Sources and Causes 3-23.2.1 Excess Phosphorus 3-33.2.2 Altered Hydrology 3-43.2.3 Sediment 3-53.2.4 Pathogens 3-63.2.5 Salts, Organic Compounds and Heavy Metals 3-73.2.6 Elevated Water Temperature 3-83.2.7 Litter/Debris 3-83.2.8 Pharmaceuticals and Endocrine Disruptors 3-83.2.9 Overarching Challenges 3-123.3 Goals and Objectives for the Middle <strong>Huron</strong> <strong>Watershed</strong> 3-143.4 <strong>Watershed</strong> <strong>Management</strong> Alternatives 3-173.4.1 Selection of <strong>Management</strong> Alternatives(Menu of Best <strong>Management</strong> Practices) 3-173.5 Middle <strong>Huron</strong> <strong>Watershed</strong> Action <strong>Plan</strong> 3-223.5.1 Recommended Actions to Achieve <strong>Watershed</strong>Goals and Objectives 3-23- Managerial Actions: Ordinances and Policies 3-23- Managerial Actions: Practices 3-26- Managerial Actions: Studies and Inventories 3-27- Managerial Actions: Public Information & Education 3-29- Managerial Actions: Illicit Discharge Elimination 3-32- Managerial Actions: Coordination and Funding 3-32- Managerial Actions: Vegetative 3-34- Managerial Actions: Structural 3-353.5.2 Understanding the Action <strong>Plan</strong> Table 3-38- Action <strong>Plan</strong> Schedule 3-393.5.3 Action <strong>Plan</strong> Strategies 3-45- Phosphorus Reduction Strategy 3-45- Pathogen Reduction Strategy 3-46- Biota Improvement Strategy 3-46- Information and Education <strong>Plan</strong> 3-50Chapter 4Implementation and Evaluation4.1 Integrated <strong>Watershed</strong> <strong>Management</strong> 4-14.2 <strong>Watershed</strong> <strong>Plan</strong> Implementation 4-24.2.1 Advisory Committee Structure 4-34.2.2 Community Involvement 4-54.2.3 <strong>Watershed</strong> <strong>Plan</strong> Revisions 4-94.3 Evaluation Methods for Measuring Success 4-104.3.1 Qualitative Evaluation Techniques 4-134.3.2 Quantitative Evaluation Techniques 4-16- Establishing Targets 4-174.3.3 Evaluation Monitoring for the Middle <strong>Huron</strong> <strong>Watershed</strong> 4-204.4 Evaluation of Previous <strong>Plan</strong>s 4-254.4.1 <strong>Watershed</strong> <strong>Management</strong> Activities 1994-2000 4-25
4.5 Parting Words 4-32References(Included at chapter ends)
APPENDICES (available digitally on the accompanying CD)A Total Maximum Daily Load documents for Phosphorus in Ford and Belleville Lakes,E. coli in Geddes Pond, Biota in Malletts Creek, and Biota in Swift RunB Middle <strong>Huron</strong> Partnership Cooperative Agreement and 1996 PhosphorusReduction StrategyC Phosphorus Reduction <strong>Plan</strong> for the Middle <strong>Huron</strong> <strong>River</strong> <strong>Watershed</strong>D E. coli TMDL Implementation <strong>Plan</strong> for Geddes Pond, <strong>Huron</strong> <strong>River</strong> (Revised 2011)E Millers Creek <strong>Plan</strong>F Malletts Creek <strong>Plan</strong>G Fleming Creek <strong>Plan</strong> (Draft)H Ford Lake StudyI Allens Creek <strong>Plan</strong>J Advisory Committee AgendasK Critical Area MethodologyL Low Impact Development: An Integrated Environmental Design ApproachM Low Impact Development Fact Sheets, Washtenaw County Drain CommissionerN “Consuming Land, Losing Character” documentO Stormwater Ordinances for Ann Arbor Township, .P Manufactured Fertilizer Ordinance for City of Ann Arbor and Pittsfield Township, MIQ Middle <strong>Huron</strong> <strong>Watershed</strong> Initiative, 2004 Annual ReportR Private Road Ordinance, Ann Arbor Township, MIS Open Space Ordinances for Hamburg Township, MI (appropriate for septic communities)and Ann Arbor Township (appropriate for sewered communities)T Natural Features Setback Ordinance, Ann Arbor Township, MIU Model Wetland Protection OrdinanceV Regulation for Septic System Inspections at Time of Property Transfer,Washtenaw County, MIW Model Buffer OrdinanceX TSS Reduction Implementation <strong>Plan</strong> for Malletts CreekY TSS Reduction Implementation <strong>Plan</strong> for Swift Run
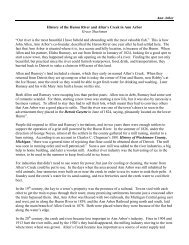
CHAPTER 1:INTRODUCTION1.1 THE MIDDLE HURON WATERSHEDFor the purposes of this plan, the watershed within the Ann Arbor-Ypsilanti MetropolitanArea (see Figure 1.1) will be referred to as the Middle <strong>Huron</strong> <strong>Watershed</strong>. The Middle<strong>Huron</strong> <strong>Watershed</strong> is part of the <strong>Huron</strong> <strong>River</strong> <strong>Watershed</strong> (see Figure 1.1), one ofMichigan’s natural treasures. The <strong>Huron</strong> <strong>River</strong> supplies drinking water to approximately150,000 people, supports one of Michigan’s finest smallmouth bass fisheries, and is theState’s only designated Scenic <strong>River</strong> in southeast Michigan. The <strong>Huron</strong> <strong>River</strong> <strong>Watershed</strong>is a unique and valuable resource in southeast Michigan that contains ten Metroparks,two-thirds of all southeast Michigan’s public recreational lands, and abundant county andcity parks. In recognition of its value, the State Department of Natural Resources hasofficially designated 27 miles of the <strong>Huron</strong> <strong>River</strong> and three of its tributaries as “Country-Scenic” <strong>River</strong> under the State’s Natural <strong>River</strong>s Act (Act 231, PA 1970). The <strong>Huron</strong> ishome to one-half million people, numerous threatened and endangered species andhabitats, abundant bogs, wet meadows, and remnant prairies of statewide significance.The <strong>Huron</strong> <strong>River</strong> basin encompasses approximately 900 square miles (576,000 acres)of Ingham, Jackson, Livingston, Monroe, Oakland, Washtenaw, and Wayne counties(Figure 1.1). The main stem of the <strong>Huron</strong> <strong>River</strong> is approximately 136 miles long,originating at Big Lake and the <strong>Huron</strong> Swamp in Springfield Township, Oakland County.The main stem of the river meanders from the headwaters through a complex series ofwetlands and lakes in a southwesterly direction to the area of Portage Lake. Here, theriver begins to flow south until reaching the Village of Dexter in Washtenaw County,where it turns southeasterly and flows to its final destination of Lake Erie. The <strong>Huron</strong> isnot a free-flowing river. At least 98 dams segment the river system, of which 17 arelocated on the main stem.The immediate drainage area to the Middle <strong>Huron</strong> <strong>Watershed</strong> is 217 square miles(138,593 acres), representing approximately 24% of the <strong>Huron</strong> <strong>River</strong> <strong>Watershed</strong>. TheMiddle <strong>Huron</strong> <strong>Watershed</strong> is defined as the land area that drains to the <strong>Huron</strong> <strong>River</strong>downstream of the confluence with Mill Creek and through Ford and Belleville Lakes. Allor portions of 13 local communities are situated in the Middle <strong>Huron</strong> <strong>Watershed</strong>, of whichthe largest portions are within the Cities of Ann Arbor and Ypsilanti, and the townships ofScio, Ann Arbor, Superior, Pittsfield, Ypsilanti and Van Buren. Other communities withsmaller areas in the watershed include the townships of Webster, Northfield, Salem,Lodi, as well as the Village of Dexter and the City of Belleville. The entire watershed liesin Washtenaw County, with the exception of the majority of the drainage to BellevilleLake, which is in Van Buren Township and the City of Belleville in Wayne County.Ann Arbor-Ypsilanti Metropolitan Area 1-1<strong>Watershed</strong> <strong>Management</strong> <strong>Plan</strong>
Figure 1.1 The Middle <strong>Huron</strong> <strong>Watershed</strong> boundary within the Ann Arbor-Ypsilanti MetropolitanArea, showing municipal and creekshed boundaries.The segment of the <strong>Huron</strong> <strong>River</strong> in the Middle <strong>Huron</strong> <strong>Watershed</strong> begins at the outfall ofMill Creek in Dexter and ends at the French Landing Dam, which creates the BellevilleLake impoundment. From the Mill Creek outlet, the river flows unrestricted toward thesoutheast until it reaches a series of impoundments beginning with Barton Pond andending in Belleville Lake. Nine major tributaries and the two lake drainages run directlyinto the <strong>Huron</strong> <strong>River</strong> system. These eleven distinct sub-basins are also known as“creeksheds.” The mainstem of the <strong>Huron</strong> <strong>River</strong> in the Middle <strong>Huron</strong> <strong>Watershed</strong> isapproximately 40 miles long with additional 593 miles of contributing streams. Arelatively significant elevation drop from watershed inlet to outlet coupled with intensiveurban development means that fewer lakes and wetlands remain in the Middle <strong>Huron</strong>than in the Upper <strong>Huron</strong> watersheds or other watersheds in Michigan. The elevationdrops 199.5 feet over 40 river miles for an average gradient of 5.0 ft/mi. This gradientcompares to an average of 3.3 ft/mi for the entire <strong>Huron</strong> <strong>River</strong>. Approximately 5,393acres (8.4 sq. miles) of wetlands remain in the <strong>Watershed</strong> as of 2000, comprising about6% of the total watershed area. The Middle <strong>Huron</strong> area contains 378 lakes andimpoundments, of which 43 are greater than 5 acres and 10 of which are greater than 20acres. All the waters greater than 20 acres in size are impoundments.The watershed contains a few small protected natural areas including Dexter-<strong>Huron</strong>Metropark, Delhi Metropark, Barton Park, Bird Hills Park, Nichols Arboretum, MatthaeiBotanical Gardens, and Belleville Park, as well as numerous other public and privatelocal parks. The watershed’s land cover is dominated by urban and sub-urbanresidential, commercial and industrial uses, with low-density residential areas,Ann Arbor-Ypsilanti Metropolitan Area 1-2<strong>Watershed</strong> <strong>Management</strong> <strong>Plan</strong>
grasslands/old agricultural fields, forested lands, and wetlands scattered primarily in thenorthern and western fringes of the watershed.In recent decades, the <strong>Huron</strong> <strong>River</strong> <strong>Watershed</strong> has experienced amplified developmentpressures from a growing economy and urban sprawl. According to the U.S. Censusdata and the Southeast Michigan <strong>Council</strong> of Governments (SEMCOG) 1 , the totalpopulation of the seven communities * that comprise over 90% of the Middle <strong>Huron</strong><strong>Watershed</strong>’s population increased 5.5% from 1990 to 2007. The forecast to 2030 showsa 13.5% increase in population from 2007 levels. This growth rate falls in between that ofother subwatersheds of the <strong>Huron</strong> <strong>River</strong>: Wayne and Oakland Counties’ populations arehovering at a constant rate or declining, while rapid growth is occurring in LivingstonCounty.Washtenaw County continues to be one of the fastest growing counties in the state,reflecting a trend in growth out from Detroit to the more outlying areas spurred byhighway improvements, the establishment of infrastructure, and a desire for open space,among other factors. According to SEMCOG, Washtenaw County’s populationincreased by almost 9% from 2000 to August 2007, compared with 2.2% in OaklandCounty, -0.9% in Wayne County (excluding Detroit) and 23% in Livingston County.SEMCOG predicts that most of Washtenaw County’s growth in the next 23 years willtake place in Scio, Superior and Ypsilanti Townships, with projected growth rates all over30%. The more developed municipalities are projected to experience more modestgrowth below 10%.If current development practices are employed to accommodate the projected increasein population and associated infrastructure, then SEMCOG estimates 40% of theremaining open spaces will be developed within the <strong>Huron</strong> <strong>River</strong> <strong>Watershed</strong> by 2020.Much of this projected conversion of undeveloped land will occur in the Middle <strong>Huron</strong>area where it will hasten degradation of the hydrology and water quality of surfacewaters. Common practices that impact hydrology and water quality include drainingwetlands, straightening and dredging streams (“drains”), removing riparian vegetation,installing impervious surfaces and storm sewers, inadequately controlling soil erosion,and poorly designing stream crossings. Such practices result in altered hydrology(“flashy” flows and flooding), soil erosion and sedimentation, elevated nutrients,nuisance algal blooms, dangerous levels of pathogens, and degraded fisheries.1.2 PURPOSE OF THE WATERSHED MANAGEMENT PLANThe <strong>Watershed</strong> <strong>Management</strong> <strong>Plan</strong> (WMP) for the <strong>Huron</strong> <strong>River</strong> in the Ann Arbor-YpsilantiMetropolitan Area is part of an effort led by communities in the Middle <strong>Huron</strong> <strong>Watershed</strong>seeking to plan activities to address water quality issues highlighted in the State ofMichigan’s Clean Water Act §303(d) report on impaired waters. The original WMP wascompleted in 1994 and then updated in 2000. This version is the second update of theWMP, and was carried out as a major redraft. Much data and other information on theMiddle <strong>Huron</strong> has been compiled over this time, and the authors have sought to includeas much as possible. This version was also reformatted to be consistent with thestructure and content of other WMPs in the <strong>Huron</strong> <strong>River</strong> <strong>Watershed</strong>.* Includes Scio Township, City of Ann Arbor, Ann Arbor Township, Superior Township, City of Ypsilanti,Ypsilanti Township, and Van Buren Township.Ann Arbor-Ypsilanti Metropolitan Area 1-3<strong>Watershed</strong> <strong>Management</strong> <strong>Plan</strong>
Portions of the Middle <strong>Huron</strong> <strong>Watershed</strong> fail to meet minimum water quality standards orprovide designated uses protected under Michigan law. In 1996, based on water qualitymonitoring studies, the Michigan Department of Environmental Quality (MDEQ) listed theMiddle <strong>Huron</strong> <strong>River</strong> <strong>Watershed</strong> as significantly contributing phosphorus to the impairedwaterbodies of Ford and Belleville lakes. The MDEQ placed the lakes on the State’s303(d) list of impaired waters, which means that their quality is poor enough to requirethe establishment of a Total Maximum Daily Load (TMDL). A TMDL is the maximumamount of a particular pollutant a waterbody can assimilate without violating numericaland/or narrative water quality standards. The reason for the impaired status was cited asexcess phosphorus loading from point and nonpoint sources in the Middle <strong>Huron</strong> <strong>River</strong><strong>Watershed</strong>.Both point and nonpoint source contributions need to be reduced if the goal is to be met.The communities of the Middle <strong>Huron</strong> are under mandate from the State of Michigan toreduce phosphorus loading to the river by 50% in order to meet the TMDL. As a resultof field studies, MDEQ established a TMDL target concentration of 50 micrograms perliter (μg/L) of phosphorus for Ford Lake, and 30 micrograms per liter (μg/L) ofphosphorus for Belleville Lake to significantly reduce or eliminate the presence ofnuisance algal blooms (Kosek, 1996). Scientists estimate that the areas covered underthis WMP contribute about 75% of total phosphorus to the Middle <strong>Huron</strong>, with Mill Creekcontributing the remainder.The primary purpose of this plan is to address this impairment as well as others listed forthe Middle <strong>Huron</strong> <strong>Watershed</strong> (see section 1.2.1). The Ann Arbor-Ypsilanti <strong>Watershed</strong><strong>Management</strong> <strong>Plan</strong> represents a broad effort to restore and protect the integrity of waterquality and quantity of the Middle <strong>Huron</strong> system. This plan presents a state-approvedmethodology to diminish the adverse effects of nonpoint source pollution to meet theestablished TMDLs and proactively address others that will be developed within thewatershed. This plan outlines both quantitative and qualitative steps considerednecessary to meet water quality goals for the Middle <strong>Huron</strong> <strong>River</strong> and its <strong>Watershed</strong>.In order for the State of Michigan to approve a watershed plan, the plan must meet thefollowing criteria as established in State Rule 324.8810:A watershed management plan submitted to the MDEQ for approval under thissection shall contain current information, be detailed, and identify all of thefollowing:(a) The geographic scope of the watershed.(b) The designated uses and desired uses of the watershed.(c) The water quality threats or impairments in the watershed.(d) The causes of the impairments or threats, including pollutants.(e) A clear statement of the water quality improvement or protection goalsof the watershed management plan.(f) The sources of the pollutants causing the impairments or threats andthe sources that are critical to control in order to meet water qualitystandards or other water quality goals.(g) The tasks that need to be completed to prevent or control the criticalsources of pollution or address causes of impairment, including, asappropriate, all of the following:(i) The best management practices needed.Ann Arbor-Ypsilanti Metropolitan Area 1-4<strong>Watershed</strong> <strong>Management</strong> <strong>Plan</strong>
(ii) Revisions needed or proposed to local zoning ordinances andother land use management tools.(iii) Informational and educational activities.(iv) Activities needed to institutionalize watershed protection.(h) The estimated cost of implementing the best management practicesneeded.(i) A summary of the public participation process, including theopportunity for public comment, during watershed management plandevelopment and the partners that were involved in the development ofthe watershed management plan.(j) The estimated periods of time needed to complete each task and theproposed sequence of task completion.The above criteria are necessary for approval under the Clean Michigan Initiativeguidelines. To be approved for funding under federal Clean Water Act section 319, aplan must meet the “9 Minimum Elements:”a. An identification of the causes and sources or groups of similar sources thatwill need to be controlled to achieve the load reductions estimated in thiswatershed-based plan (and to achieve any other watershed goals identified inthe watershed-based plan). Sources that need to be controlled should beidentified at the significant subcategory level with estimates of the extent towhich they are present in the watershed.b. An estimate of the load reductions expected for the management measuresdescribed under paragraph (c) below. Estimates should be provided at thesame level as in item (a) above.c. A description of the NPS management measures that will need to beimplemented to achieve the load reductions estimated under paragraph (b)above (as well as to achieve other watershed goals identified in thiswatershed-based plan), and an identification (using a map or a description) ofthe critical areas in which those measures will be needed to implement thisplan.d. An estimate of the amounts of technical and financial assistance needed,associated costs, and/or the sources and authorities that will be relied upon,to implement this plan.e. An information/education component that will be used to enhance publicunderstanding of the project and encourage their early and continuedparticipation in selecting, designing, and implementing the NPS managementmeasures that will be implemented.f. A schedule for implementing the NPS management measures identified inthis plan that is reasonably expeditious.g. A description of interim, measurable milestones for determining whether NPSmanagement measures or other control actions are being implemented.h. A set of criteria that can be used to determine whether loading reductions arebeing achieved over time and substantial progress is being made towardsattaining water quality standards and, if not, the criteria for determiningwhether this watershed-based plan needs to be revised or, if a NPS TMDLhas been established, whether the NPS TMDL needs to be revised.i. A monitoring component to evaluate the effectiveness of the implementationefforts over time, measured against the criteria established under item (h)immediately above.Ann Arbor-Ypsilanti Metropolitan Area 1-5<strong>Watershed</strong> <strong>Management</strong> <strong>Plan</strong>
The communities involved in the development of this plan are committed to protectingthe sensitive natural areas of the Middle <strong>Huron</strong> <strong>Watershed</strong>, mitigating impacts of existingpoint and nonpoint source pollution, and restoring degraded areas.1.2.1 Total Maximum Daily Load ProgramA Total Maximum Daily Load (TMDL) is the maximum amount of a particular pollutant awaterbody can assimilate without violating state water quality standards. Water qualitystandards identify the applicable “designated uses” for each waterbody, such asswimming, agricultural or industrial use, public drinking water, fishing, and aquatic life.MDEQ establishes scientific criteria for protecting these uses in the form of a number ora description of conditions necessary to ensure that a waterbody is safe for all of itsapplicable designated uses.The state also monitors water quality to determine the adequacy of pollution controlsfrom point source discharges. If a waterbody cannot meet the state’s water qualitycriteria with point-source controls alone, the Clean Water Act requires that a TMDL mustbe established. TMDLs provide a basis for determining the pollutant reductionsnecessary from both point and nonpoint sources to restore and maintain the waterquality standards. Point sources is the term used to describe direct discharges to awaterway, such as industrial facilities or waste water treatment plants. Nonpoint sourcesare those that enter the waterways in a variety of semi- or non-traceable ways such asstormwater runoff.In Michigan, the responsibility to establish TMDLs rests with the MDEQ. Once a TMDLhas been established by the MDEQ, affected stakeholders must develop and implementa plan to meet the TMDL, which will bring the waterbody into compliance with statewater quality standardsAs of the 2006 303(d) List of Nonattaining Waterbodies from the DEQ, ten waterbodiesin the Middle <strong>Huron</strong> are listed for water quality problems. To date, four TMDLs havebeen established for Ford and Belleville Lakes (phosphorus), Geddes Pond (pathogens),Malletts Creek (poor fish and macroinvertebrates), and Swift Run (poormacroinvertebrates). Six TMDLs for other pollutants are scheduled for futureestablishment in the watershed, as described in Table 1.1.Table 1.1: Waterbodies requiring TMDLs in the Middle <strong>Huron</strong> <strong>Watershed</strong>(Source: MDEQ 2006 303(d) list of nonattaining waterbodies)WaterbodyPollutant or ProblemTMDLStatusLocation/AreaFord Lake/Belleville LakeNutrient enrichment(phosphorus)Approved in2000Impoundments of the <strong>Huron</strong> <strong>River</strong>located between the cities of Ypsilantiand Romulus.<strong>Huron</strong> <strong>River</strong>(Geddes Pondand AllenCreek)Pathogens (rule 100)Approved in2001Geddes Pond Dam upstream to ArgoDam, Ann ArborAnn Arbor-Ypsilanti Metropolitan Area 1-6<strong>Watershed</strong> <strong>Management</strong> <strong>Plan</strong>
TMDLWaterbody Pollutant or Problem Location/AreaStatusMalletts CreekPoor fish andmacroinvertebratecommunitiesApproved in2004<strong>Huron</strong> <strong>River</strong> confluence u/s toPackard Rd.Swift RunPoor macroinvertebratecommunityApproved in2004SE Ann Arbor: <strong>Huron</strong> <strong>River</strong>confluence upstream to Ellsworth RdHoney Creek Pathogens (rule 100) Approved in2009Confluence of <strong>Huron</strong> <strong>River</strong> upstreamto Wagner Rd..Barton PondFish Consumption Advisoryfor PolychlorinatedBiphenyls (PCBs)Scheduled for2010Impoundment of <strong>Huron</strong> <strong>River</strong> invicinity of Barton Hills (suburb of AnnArbor). From dam u/s to Conrail RRbridge crossing.Ford Lake/Belleville LakeFish Consumption Advisoryfor PolychlorinatedBiphenyls (PCBs)Scheduled for2010Impoundments of the <strong>Huron</strong> <strong>River</strong>located between the cities of Ypsilantiand Romulus.<strong>Huron</strong> <strong>River</strong>Water Quality StandardExceedance forPolychlorinated Biphenyls(PCBs)Scheduled for2010Lake Erie confluence upstream toinclude all tributaries.Second SisterLakeFish Tissue-MercuryScheduled for2011W of Ann Arbor.UnnamedLakeFish Consumption Advisoryfor PCBs, and Fish Tissue-MercuryScheduled for2010 (PCBs)and 2011(Mercury)S. of Ford Lake in the NE corner ofSec. 26, T3S, R7E (Textile Road andBurton Road).These individual TMDLs are discussed in greater detail in Chapter 2. Concerns relatedto established TMDLs in the watershed, and primarily nonpoint source-related actions toaddress those TMDLs, are included in this plan. However, because the problemsassociated with Mercury and PCB TMDLs are likely to be linked to broadly diffuse airdepositionor specific point sources yet to be defined, actions designed to address suchTMDLs are not emphasized in this plan. The TMDLs to be developed for thosewaterbodies will identify source reductions to be implemented. This plan should beupdated following development of those TMDLs, if necessary, to incorporateimplementation activities.1.2.2 Other Subwatershed <strong>Management</strong> <strong>Plan</strong>sThis <strong>Plan</strong> was developed with the intention of fulfilling the watershed managementplanning criteria for the U.S. EPA’s Clean Water Act §319 Program and MDEQ’s CleanMichigan Initiative Program. In addition, many of the communities have developed plansto comply with the NPDES Phase II Stormwater Program, and these plans arereferenced within. It should also be noted that several other “subwatershed” plans havebeen developed previously through a combination of community, public and privatecollaborative efforts. These include the Millers Creek <strong>Plan</strong> (see Appendix E), theAnn Arbor-Ypsilanti Metropolitan Area 1-7<strong>Watershed</strong> <strong>Management</strong> <strong>Plan</strong>
Malletts Creek <strong>Plan</strong>s (Appendices F and X), the Fleming Creek <strong>Plan</strong> (Appendix G), theFord Lake <strong>Plan</strong> (Appendix H), Allens Creek <strong>Plan</strong> (Appendix I), and the Swift Run <strong>Plan</strong>(Appendix Y). These plans and efforts are described in further detail in other chapters ofthe plan.It is intended that this WMP will serve as an “umbrella” plan to incorporate and referencethose other plans and consolidate their recommendations. Due to the broader scope ofthis plan, the evaluation, analysis and recommended actions will also be broader andless specific than those in subwatershed plans. For example, this plan recommendsimplementation of a number of individual best management practices (BMPs) in targetedareas. The subwatershed plans will often recommend specific locations forimplementation of these BMPs. In many sections of this plan, references are made toelements within subwatershed plans. Users are encouraged to refer to those plans formore specific analysis and recommendations.1.3 THE WATERSHED MANAGEMENT PLAN COMMUNITY INPUTThe first task involved in developing the original 1994 <strong>Watershed</strong> <strong>Management</strong> <strong>Plan</strong> wasthe formation of a Policy Advisory Committee, with members representing each of thecommunities in the project area. In January 1993, an initial meeting of this group wasconvened to discuss issues related to nonpoint source pollution in the planning area andindividual community concerns. Following this introductory meeting, goals andobjectives for controlling water quality were developed and submitted to committeemembers for review and approval. Since that time the Committee has continued tomeet on a regular basis to assist in watershed planning activities throughout the Middle<strong>Huron</strong> basin. Currently, the Middle <strong>Huron</strong> Partnership Initiative coordinates the meetingof these communities with the expressed intent to plan and implement activities toaddress the Ford and Belleville Lakes TMDL for phosphorus.Efforts to update the Ann Arbor-Ypsilanti WMP are being coordinated under theleadership of the Washtenaw County Drain Commissioner (WCDC) in conjunction withthe <strong>Huron</strong> <strong>River</strong> <strong>Watershed</strong> <strong>Council</strong>. For this 2007 update, an Advisory Committee wasestablished, with representation from each of the communities in the Middle <strong>Huron</strong><strong>Watershed</strong>, with the exception of Van Buren Township and the City of Belleville, asBelleville Lake was added to the geographic scope late in the update process. Projectstaff held bi-monthly meetings with the Advisory Committee to get feedback on differentsections of the WMP. Materials were also distributed to Committee members and otherinterested parties for review, comment and input. All communities were given draftcopies of the WMP for review prior to finalizing. The recommendations contained in this<strong>Watershed</strong> <strong>Plan</strong> update were the result of formal and informal meetings with communityofficials and staff since adoption of the initial plan in 1994 and its 2000 update. Thisupdate will again be presented to these communities to integrate with their commitmentsunder other plans.1.3.1. Technical Advisory CommitteesSeveral Technical Advisory Committees were established to provide input to individualcomponents of this plan. A Committee was established to assist in revising the DrainCommissioner's standards governing the design of stormwater management systems innew developments. Members included staff from local planning, engineering, buildingAnn Arbor-Ypsilanti Metropolitan Area 1-8<strong>Watershed</strong> <strong>Management</strong> <strong>Plan</strong>
inspection and utilities departments. Private engineering and planning consultants werealso represented, as well as the <strong>Huron</strong> <strong>River</strong> <strong>Watershed</strong> <strong>Council</strong>, the County SoilConservation District and the MDNR. Committee members were provided with workingdrafts of the Drain Commissioner's standards (including explanations about howrevisions work to improve water quality and quantity control) and asked to providefeedback on their practicality for implementation within Washtenaw County. Revisedstandards were adopted in 1994. Public involvement and review also guided the 2000update and this 2007 update. That group was developed specifically to recommendstormwater permit standards. Those standards are not scheduled for revision prior toadoption of the WMP.Additionally, the Middle <strong>Huron</strong> Partnership Initiative was formed to address the Ford andBelleville Lakes TMDL. The Partnership originally formed in 1999 following developmentof the TMDL, and an updated Cooperative Agreement was signed in 2005 (seeAppendix B). This voluntary agreement commits the DEQ and community partners tospecific steps to address the phosphorus reduction targets described in the TMDL. ThePartnership meets twice a year to report on progress and also serves as a de factoadvisory body for this WMP.1.3.2 Input from Local Subwatershed and Creek GroupsCreek groups have contributed a unique community involvement component to thedevelopment of the original WMP and updates. Several creek groups have formed sincethe development of the original WMP, and several of these have developedsubwatershed plans or other sets of recommendations. These include plans for Allens,Millers, Malletts, and Fleming Creeks, and Ford Lake. This plan incorporates thesecomponents not simply as feedback for the update, but as a basic framework forupdating the plan. Recommendations made in this document represent a collaborativeeffort between the <strong>Huron</strong> <strong>River</strong> <strong>Watershed</strong> <strong>Council</strong>, the Office of the Washtenaw CountyDrain Commissioner, the individual creek groups and the greater creekshedcommunities.Staff from the <strong>Huron</strong> <strong>River</strong> <strong>Watershed</strong> <strong>Council</strong> and the Washtenaw County Drain Officehave met, and will continue to meet with creek groups, throughout the process ofdeveloping and implementing watershed plans. Involving these groups will continue tofoster community support for WMP implementation and creek restoration activities.Representatives of the <strong>Huron</strong> <strong>River</strong> <strong>Watershed</strong> <strong>Council</strong> and the Drain Office will remaininvolved in these groups to assist in their development, management planning, grantproposals, policy and technical assistance, and special event coordination. In addition,creek group representatives will continue to advise the Drain Office and the <strong>Huron</strong> <strong>River</strong><strong>Watershed</strong> <strong>Council</strong> in program development as they have for current and pastrestoration projects, the <strong>Huron</strong> <strong>River</strong> <strong>Watershed</strong> <strong>Council</strong>’s Adopt-A-Stream program andothers.1 Southeaset Michigan <strong>Council</strong> of Governments. Community Profiles.http://www.semcog.org/data/communityprofiles. Accessed August 2007.Ann Arbor-Ypsilanti Metropolitan Area 1-9<strong>Watershed</strong> <strong>Management</strong> <strong>Plan</strong>
CHAPTER 2:CURRENT CONDITIONSAn effort has been made to collect all readily available information to establish a baseline ofcurrent conditions of the <strong>Watershed</strong>. Primarily, this effort focused on the review of relevantinformation from other subwatershed plans and related efforts. The information collection effortincluded requests to Advisory Committee members and researchers in the area. Numerousstudies and datasets of relevance were obtained in this process. In addition, spatial data wasgathered and analyzed in a Geographic Information System. This chapter presents a summaryof all this information, with references to original sources. These original sources contain muchmore detail than is presented here.2.1 LANDSCAPE AND NATURAL FEATURES2.1.1 Climate and TopographySeasonal variation is the most important feature of Michigan’s, and therefore the watershed’s,climate. The <strong>Huron</strong> <strong>River</strong> <strong>Watershed</strong> receives an average of 30 inches of precipitation annuallyas Southeast Michigan tends to be drier than other portions of Michigan. Seasonal precipitationpatterns are fairly stable due to warmer winter temperatures that hold more moisture in the air,thereby moderating temperature fluctuation. Since southern Michigan climes produce regularthaws and refreezes throughout most of the winter, the <strong>Huron</strong> <strong>River</strong> flows do not vary as muchas northern Michigan rivers.Evaporation in the watershed is higher than most of the state, due to higher temperatures andslightly drier air found in southeast Michigan. As a result, the <strong>Watershed</strong> has one of the lowestamounts of total annual runoff in Michigan. For a 30-year period, the average high temperaturesranged from 32 o F in January to 84 o F in July in the <strong>Watershed</strong>, while the average lowtemperatures ranged from 15 o F in January to 59 o F in July.The Middle <strong>Huron</strong> <strong>Watershed</strong> falls into three distinct regional landscape ecosystems accordingto the USGS classification: the Jackson Interlobate, the Ann Arbor Moraines, and the MaumeeLake Plain 1 . The Nature Conservancy identifies the <strong>Huron</strong> <strong>River</strong> <strong>Watershed</strong> as located withinthe North Central Till Plain and the Great Lakes ecoregions. Ecoregions are areas that exhibitbroad ecological unity, based on such characteristics as climate, landforms, soils, vegetation,hydrology and wildlife. The Middle <strong>Huron</strong> <strong>Watershed</strong> lies in the North Central Till Plain andGreat Lakes ecoregions.Ann Arbor-Ypsilanti Metropolitan Area 2-1<strong>Watershed</strong> <strong>Management</strong> <strong>Plan</strong>
2.1.2 Geology and SoilsGlacial Outwash Plains and coarse to medium textured end moraines characterize much of the<strong>Watershed</strong> (Figure 2.2). Glacial outwash plains were created by melting glaciers whose runoffsorted soils into layers of similarly sized particles. These well-sorted soils include sand andgravel that allow rapid infiltration of surface water to groundwater aquifers and stream systems.End moraines are areas where glacial processes deposited huge quantities of rock and soilmaterial of various sizes in one place. The mixture of varying sized soil particles increases thesoils’ ability to hold moisture and nutrients, which is conducive to agriculture. Coarse texturedend moraines, which are found mainly in the northern and western portions of the <strong>Watershed</strong>,have low to moderate permeability, while the medium textured end moraines in patches aroundthe <strong>Watershed</strong>’s periphery have lower permeability.The soils in the Middle <strong>Huron</strong> <strong>River</strong> <strong>Watershed</strong> are largely end moraines of medium-textured tillor lacustrine sand and gravel glacial outwash. Sand and gravel line the riparian zone of the riverand its major tributaries. Figure 2.3 shows hydric soil groups and Figure 2.9 shows the soilsaccording to their hydrological classification, ranging from rapid to slow infiltration. The generaltrend of soil infiltration in the Middle <strong>Huron</strong> <strong>River</strong> <strong>Watershed</strong> is moderately slow infiltration in theWest, slow infiltration in the central areas, and moderately rapid infiltration in the East.2.1.3 Significant Natural Features and BiotaSince the Middle <strong>Huron</strong> <strong>Watershed</strong> frames the cities of Ann Arbor and Ypsilanti, significantbuilding pressure has caused the land to become altered and degraded. Still, pockets of highquality habitat and diverse species persist due to conscientious planning and policy-makingefforts that seek to preserve wildlife habitat. The expansiveness and ecological quality of theremaining open spaces and native habitats directly impact the quality of life and quality of waterin the <strong>Watershed</strong>. Researchers have recognized plant and animal species and plant communitytypes as integral parts of the <strong>Watershed</strong> that deserve protecting. Among those conservationtargets are the threatened and endangered species that have been observed in the watershed(Table 2.1). Many of the 90 plant and animal occurrences in the table are partially or entirelydependent on aquatic ecosystems for survival.Ann Arbor-Ypsilanti Metropolitan Area 2-2<strong>Watershed</strong> <strong>Management</strong> <strong>Plan</strong>
Table 2.1. Threatened, Endangered, and Special Concern Occurrences in the Ann Arbor-YpsilantiMetroarea <strong>Watershed</strong> from 1968-Present, some of which may have since been extirpated 2SC = Special Concern T = Threatened C= being considered for federal statusPE = Proposed Endangered E = Endangered X= Extirpated from stateCommon name Scientific NAME StatestatusFederalstatusANIMALSBlanchard’s Cricket Frog Acris crepitans blanchardi SCElktoe Alasmidonta marginata SCSmallmouth Salamander Ambystoma texanum EGrasshopper Sparrow Ammodramus savannarum SCSwamp Metalmark Calephelis mutica SCMarsh Wren Cistothorus palustris SCRedside Dace Clinostomus elongatus EKirtland’s Snake Clonophis kirtlandii ELeast Shrew Cryptotis parva TPurple Wartyback Cyclonaias tuberculata SCBlanding’s Turtle Emydoidea blandingii SCSnuffbox Epioblasma triquetra EWild Indigo Duskywing Erynnis baptisiae SCDukes’ Skipper Euphyes dukesi TBald Eagle Haliaeetus leucocephalus TWavy-rayed Lampmussel Lampsilis fasciola TWoodland Vole Microtus pinetorum SCIndiana Bat or Indiana Myotis Myotis sodalis E PEAmerican Burying Beetle Nicrophorus americanus E PESilver Shiner Notropis photogenis EBrindled Madtom Noturus miurus SCNorthern Madtom Noturus stigmosus ESouthern Redbelly Dace Phoxinus erythrogaster EGravel Pyrg Pyrgulopsis letsoni SCKing Rail Rallus elegans EEastern Massasauga Sistrurus catenatus catenatus SC CRegal Fritillary Speyeria idalia ELaura’s Snaketail Stylurus laurae SCEastern Box Turtle Terrapene carolina carolina SCRainbow Villosa iris SCHooded Warbler Wilsonia citrina SCPLANTSHairy Angelica Angelica venenosa SCVirginia Snakeroot Aristolochia serpentaria TPurple Milkweed Asclepias purpurascens SCSullivant’s Milkweed Asclepias sullivanti TWillow Aster Aster praealtus SCCooper’s Milk-vetch Astragalus neglectus SCMurray Birch Betula murrayana SCSide-oats Grama Grass Bouteloua curtipendula TFrank’s Sedge Carex frankii SCFalse Hop Sedge Carex lupuliformis TSedge Carex squarrosa SCHairy-fruit Sedge Carex trichocarpa SCPurple Turtlehead Chelone obliqua EYellow Nut-grass Cyperus flavescens SCWhite Lady-slipper Cypripedium candidum TPurple Coneflower Echinacea purpurea XLove Grass Eragrostis capillaris SCAnn Arbor-Ypsilanti Metropolitan Area 2-3<strong>Watershed</strong> <strong>Management</strong> <strong>Plan</strong>
Common name Scientific NAME StatestatusSmall Love Grass Eragrostis pilosa SCWahoo Euonymus atropurpurea SCUpland Boneset Eupatorium sessilifolium TShowy Orchis Galearis spectabilis TWhite Gentian Gentiana flavida EDowny Gentian Gentiana puberulenta EStiff Gentian Gentianella quinquefolia TPale Avens Geum virginianum SCKentucky Coffee-tree Gymnocladus dioicus SCWhiskered Sunflower Helianthus hirsutus SCGreen Violet Hybanthus concolor SCGoldenseal Hydrastis canadensis TTwinleaf Jeffersonia diphylla SCWater-willow Justicia americana TLeast Pinweed Lechea minor SCVirginia Flax Linum virginianum TPurple Twayblade Liparis liliifolia SCBroad-leaved Puccoon Lithospermum latifolium SCRed Mulberry Morus rubra TMat Muhly Muhlenbergia richardsonis TGinseng Panax quinquefolius TLeiberg’s Panic-grass Panicum leibergii TLow-forked Chickweed Paronychia fastigiata SCPale Beard Tongue Penstemon pallidus SCOrange and Yellow Fringed Orchid Platanthera ciliarus TBog Bluegrass Poa paludigena TJacob’s Ladder or Greek-valerian Polemonium reptans TSwamp or Black Cottonwood Populus heterophylla TPrairie Buttercup Ranunculus rhomboideus THairy Ruellia Ruellia humilis TCanadian Burnet Sanguisorba canadensis TClinton’s Bulrush Scirpus clintonii SCTall Nut-rush Scleria triglomerata SCCompass-plant Silphium laciniatum TCup-plant Silphium perfoliatum TLesser Ladies’-tresses Spiranthes ovalis TTrailing Wild Bean Stophostyles helvula SCVirginia Spiderwort Tradescantia virginiana SCToadshade Trillium sessile TEdible Valerian Valeriana edulis var. ciliate TWild-rice Zizania aquatica var. aquatica TNATURAL COMMUNITIES AND GEOGRAPHIC FEATURESPrairie fen Alkaline Shrub/herb Fen, Midwest n/a n/aOak barrens Barrens, Central Midwest Type n/a n/aMesic Sand Prairie Moist Sand Prairie, Midwest Type n/a n/aWet Prairie Wet Prairie, Midwest Type n/a n/aWoodland Prairie High Prairie, Midwest Type n/a n/aFederalstatusRecovering these species requires protecting the ecosystems on which they depend. Keyconservation areas of the Middle <strong>Huron</strong> <strong>Watershed</strong> system include critical habitat for plant andanimal communities (including habitat for rare, threatened or endangered species), such aswetlands; large forest tracts; springs; spawning areas; the aquatic corridor, including floodplains,stream channels, springs and seeps; steep slopes; and riparian forests (Figure 2.4). Priorityareas are those with intact, native ecosystems due to floral and faunal integrity.Ann Arbor-Ypsilanti Metropolitan Area 2-4<strong>Watershed</strong> <strong>Management</strong> <strong>Plan</strong>
In addition to their importance as wildlife habitat, undeveloped areas, such as forest, meadow,prairie, wetlands, ponds and lakes, and groundwater recharge areas, provide a host of servicesto the <strong>Watershed</strong> otherwise unobtainable by human invention, including the following:• Groundwater. Natural systems allow rainwater and snowmelt to infiltrate intogroundwater aquifers. About 50% of Michigan residents rely on groundwater for drinkingwater. Groundwater also provides irrigation water for agriculture and cooling water forindustry.• Surface water. By intercepting runoff and keeping surface waters supplied with aconstant flow of clean, cool groundwater, natural systems keep streams, rivers and lakesclean. New York City has recognized the benefits natural systems provide to theirdrinking water system. The City has budgeted $660 million towards protecting the upperHudson <strong>River</strong> <strong>Watershed</strong>, which drains into their drinking water supply. The Citycalculated that if the watershed undergoes development without watershed protection,the water source would degrade, making a $4 billion water treatment plant necessary.• Pollutant removal. As water infiltrates into the ground or passes through wetlands, soilfilters out many pollutants. Vegetation also takes up nutrients and other pollutants,including phosphorus, nitrogen, bacteria, and even some toxic metals.• Erosion control. Vegetation intercepts water and soil absorbs it, keeping it from erodingstreambanks and hillsides. <strong>River</strong>- and lakeside wetlands are especially important forerosion control along riverbanks and lakeshores.• Air purification. Vegetation purifies the air we breathe.• Flood and drought control. Vegetation and soil intercept runoff water, moderating floodsand droughts. In the 1970s, the U.S. Army Corps of Engineers purchased about 8,500acres of wetlands along the Charles <strong>River</strong> in Massachusetts after concluding thatpreserving natural systems was a more cost effective way to control flooding thanbuilding more dams on the river.• Wildlife habitat and biodiversity. Natural systems are vital to the survival of aquatic andterrestrial wildlife. In addition to its aesthetic value, maintaining the biodiversity ofspecies is vital to our economy and health. For instance, 118 of the top 150 prescriptiondrugs are based on natural sources.• Recreation. Natural areas provide recreation such as hiking, bird-watching, canoeing,hunting, and fishing that generate revenues for the local community.• Cooling. Tracts of land soak up solar heat and prevent heat islands from forming. Heatislands warm water runoff, which leads warm water to flow into streams and disrupts theaquatic climate.• Property values. Natural areas enhance the value of neighboring properties.The remaining undeveloped, natural areas in the <strong>Huron</strong> <strong>Watershed</strong> were mapped and prioritizedin 2002, and updated in 2007 through the Bioreserve project of the <strong>Huron</strong> <strong>River</strong> <strong>Watershed</strong><strong>Council</strong>. [1] In order to help prioritize protection and conservation efforts, the mapped sites wereranked based on the following ecological and hydrological factors: size; core size, presence ofwater; presence of wetlands; groundwater recharge potential; potential for rare remnant plantcommunity; topographical diversity; glacial diversity, how connected they were or could be toother natural areas, vegetation quality, potential for restoration, and biodiversity. 152 sitesAnn Arbor-Ypsilanti Metropolitan Area 2-5<strong>Watershed</strong> <strong>Management</strong> <strong>Plan</strong>
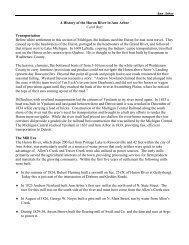
(17,654 acres) in the Middle <strong>Huron</strong> <strong>Watershed</strong> were identified as priority natural areas, with 12sites (3426 acres) ranked as highest priority for protection, 89 sites (11,502 acres) ranked asmedium priority for protection, and 51 sites 2727 acres) ranked as lower priority for protection. 3,4 The results of the project are shown in Figure 2.5.2.1.4 HydrologyThe <strong>Huron</strong> <strong>River</strong> begins at an elevation of 1016 feet in the headwaters and descends 444 feetto an elevation of 572 feet at its confluence with Lake Erie, for an average gradient of 3.3 feetper mile. By comparison, the Middle <strong>Huron</strong> <strong>River</strong> portion of the <strong>Huron</strong> <strong>River</strong> is steeper than theaverage for the whole river, dropping 199.5 feet between the Hudson Mills Metropark andBelleville Lake, averaging a change of 5.0 feet per mile. In its natural state, the river reflectedthis gradient, with numerous sections of rapids identified prior to the construction of dams. It isthis gradient that, in fact, creates the desirable conditions for dam construction. The many millsand other control structures that have been constructed have since muted the impacts that thefast flowing water had on the topography and river habitat. The river channel gradient is acontrolling influence on river habitat such as flow rates, depth, width, channel meandering, andsediment transport.Stream flow data for the <strong>Huron</strong> <strong>River</strong> in the Middle <strong>Huron</strong> <strong>Watershed</strong> has been collected at theU.S. Geological Survey (USGS) gage stations at the <strong>Huron</strong> <strong>River</strong> (#04174500) between Argoand Geddes dams since 1904 (near Wall Street, its current location since 1947) and on MalletsCreek (#04174518) at Chalmers Road since 1999. Mean annual flow at the Wall Street stationis 451.3 cubic feet per second (cfs), representing a drainage area of 729 square miles, or .62cfs per square mile. 5 Mean annual flow at the Chalmers Road station is 9.20 cubic feet persecond (cfs), representing a drainage area of 10.9 square miles, or .84 cfs per square mile. 6See section 2.4.6 for more details on the Mallets station. A comparison of the mean monthlystreamflows for four typical rainfall years and the mean monthly streamflow based on the 59years of record in the <strong>Huron</strong> <strong>River</strong> at Wall St. is presented in Figure 2.1. Seasonally high flowsgenerally occur in early spring during winter snowmelt and spring rains, with baseflow conditionsmost apparent between July and October. While monthly streamflow naturally varies from yearto year, Figure 2.1 shows that conditions in the watershed vary most in the spring and earlywinter and remain relatively constant over the summer months. One possible reason for thelack of variation is the presence and operation of control structures above the gage station.Ann Arbor-Ypsilanti Metropolitan Area 2-6<strong>Watershed</strong> <strong>Management</strong> <strong>Plan</strong>
Figure 2.1. Monthly mean discharge of the <strong>Huron</strong> <strong>River</strong> at the Wall St. flow gage (USGS station #041744500). Arange of dry to wet years are shown with a 59‐year average. 7Increasing development and resulting changes to the hydrology and hydraulics are still asignificant threat to the watershed. Human impacts and development have generally increaseddaily fluctuations in the <strong>Huron</strong>’s streamflow. Land drainage for urban or agricultural use hasdegraded the original, fairly stable flow regime. Draining wetlands, channelizing streams, andcreating new drainage channels have decreased flow stability by increasing peak flows anddiminishing recharge in groundwater tables. All tributaries to the <strong>Huron</strong> <strong>River</strong> suffer fromcomprehensive channelization, lack of cover, and large flow fluctuations as a result of efforts toaccelerate drainage through these streams. Summer water temperatures have become warmerand more variable due to lower base flows, channel widening and clearing of shading streamsidevegetation. Landscape alterations and increased peak flows have accelerated erosionwithin the basin and increased the sediment load to the river. 8Additional factors important in reviewing and understanding the hydrology of the watershed aredirect drainage, depth to groundwater, soil permeability, and groundwater recharge that indicatethe infiltration potential of groundwater.Direct drainage areas (Figure 2.6) are areas that have significant spatial and temporal influenceon the quantity and quality of water entering the river system via groundwater or surface waterflows. Much of this flow may come from direct flow from impervious surfaces. Excluded fromdirect drainage are portions of the landscape that form depressions where the dominant flow ofwater reaches the groundwater directly through infiltration. The map presented in Figure 2.6 isderived from a model that calculates flow accumulation based, in part, on the amount ofimperviousness in each area.Ann Arbor-Ypsilanti Metropolitan Area 2-7<strong>Watershed</strong> <strong>Management</strong> <strong>Plan</strong>
The groundwater recharge potential map utilizes Darcy’s Law to predict the probability ofgroundwater recharge areas in the watershed. As shown in Figure 2.7, Darcy’s Law predictsthat areas adjacent to the river and tributary systems generally hold the greatest probability ofhaving groundwater recharge. Figures 2.8 and 2.9 illustrate the depth to groundwater and soilpermeability characteristics for the watershed. Such information is useful when considering theapplicability of certain stormwater control structures (i.e., best management practices),especially infiltration-based, and the appropriateness of certain development proposals that mayrequire added water quality precautions within the watershed (i.e., gas stations, chemicalstorage facilities, etc.). Some of this data yield conflicting results. A more detailed analysis ofgroundwater recharge should be undertaken to resolve or clarify these areas of conflict.Another attribute contributing to the hydrology of the Middle <strong>Huron</strong> <strong>Watershed</strong> is the presence ofdams and impoundments. According to the National Inventory of Dams, 23 dams are located inthe watershed (Figure 2.10 and Table 2.2). Dams may be constructed for uses such ashydropower, recreation, or stormwater and flood control. Most of the dams in the Middle <strong>Huron</strong>were developed for recreational purposes, though several significant dams continue to be usedfor active hydropower or flood control. Dams that were previously useful can outlive theirintended purposes and become hazards and ecological detriments to the river. Dams cancreate hazards by collecting debris or simply by requiring recreationalists to circumnavigatethem. They act as ecological detriments by holding back silt and nutrients, altering river flows,decreasing oxygen levels in impounded waters, blocking fish migration and eliminatingspawning habitat, increasing nuisance plant growth in impoundments, altering watertemperatures, and injuring or killing fish.Table 2.2 Inventoried Dams in the Middle <strong>Huron</strong> <strong>Watershed</strong> 9Dam Name Waterway Community DownstreamHazardPotentialPurposeDateBuiltDamHeight(Feet)PondArea(acres)Barton <strong>Huron</strong> <strong>River</strong> Ann Arbor High Hydropower 1915 24 302Argo Dam <strong>Huron</strong> <strong>River</strong> Ann Arbor HighRetiredHydropower, 1920 18 92RecreationFrench Landing <strong>Huron</strong> <strong>River</strong> Belleville High Hydropower 1925 38 1270Geddes <strong>Huron</strong> <strong>River</strong> Ann Arbor HighRetiredHydropower, 1919 25 261RecreationPeninsula Paper <strong>Huron</strong> <strong>River</strong> Ypsilanti High Other 1914 16 177Rawsonville(Ford)<strong>Huron</strong> <strong>River</strong> Ypsilanti High Hydropower 1932 45 1050Superior <strong>Huron</strong> <strong>River</strong> Ann Arbor High Hydropower 1920 27.5 93FishbeckFlemingCreekLow Recreation 1973 15 6Geddes Ridge Foster DrainFlood &LowStorm Ret. Trib.Storm10 7L. Geddes Lk <strong>Huron</strong> <strong>River</strong>SubTrib.Low Recreation 1914 9 4ParkerFlemingCreekLow Other 19 30Pittsfield-Ann Pittsfield-Ann Pittsfield &Arbor #1 Arbor? Ann ArborLow Recreation 1978 10 3Pittsfield-Ann Pittsfield-Ann Pittsfield &Arbor #2 Arbor? Ann ArborLow Recreation 1978 10 4Ann Arbor-Ypsilanti Metropolitan Area 2-8<strong>Watershed</strong> <strong>Management</strong> <strong>Plan</strong>
Dam Name Waterway Community DownstreamHazardPotentialTraver Creek #1 Traver Creek Ann Arbor LowTraver Creek #2 Traver Creek Ann Arbor LowTraver Creek #3 Traver Creek Ann Arbor LowTraver Creek #4Traver Creek #5Traver Creek #6Traver CreekRetentionTraver Lake #5Whittaker andGoodingWaterwayTrucking Ser.S. BranchTraver CreekS. BranchTraver CreekS. BranchTraver CreekAnn ArborAnn ArborAnn ArborLowLowLowPurposeDateBuiltpre-1901pre-1901pre-1901pre-1901pre-1901pre-1901DamHeight(Feet)PondArea(acres)0 20 20 20 20 26 5Traver Creek Ann Arbor Low Other 1981 13 2M. BranchTraver CreekFlemingCreekFlemingCreekAnn Arbor Low Recreation 1971 34 2LowLowPre-1901Pre-19016 100 2Ann Arbor-Ypsilanti Metropolitan Area 2-9<strong>Watershed</strong> <strong>Management</strong> <strong>Plan</strong>
Figure 2.2
Figure 2.3
Figure 2.4
Figure 2.5
Figure 2.6
Figure 2.7
Figure 2.8
Figure 2.9
Figure 2.10
Ann Arbor-Ypsilanti Metropolitan Area 2-10<strong>Watershed</strong> <strong>Management</strong> <strong>Plan</strong>[Page intentionally left blank]
[PAGE INTENTIONALLY LEFT BLANK]Ann Arbor-Ypsilanti Metropolitan Area 2-20<strong>Watershed</strong> <strong>Management</strong> <strong>Plan</strong>
2.2 COMMUNITIES AND CURRENT LAND USE2.2.1 Political StructureWith an area of 217 square miles, the Middle <strong>Huron</strong> <strong>Watershed</strong> encompasses portions of 15communities in two counties. The majority (89%) of the watershed is located in all or part of 13communities in Washtenaw County, with the remaining 11% in Van Buren Township and theCity of Belleville in southwestern Wayne County.Each local government in the watershed has a zoning code and holds regularly scheduledmeetings where rulings are made on policy additions and changes, budgets, land use issues,and other important local business. Working with the guidance of statewide procedures,townships and other local governments have power to formulate land use and developmentpolicy, among other important activities. The cities of Ann Arbor, Ypsilanti and Belleville alsohave jurisdiction over and management responsibility for sewers and stormwater infrastructure,such as gutters, catch basins, pipes and outlets. Drains, including roadside ditches, pipes,bridges, and culverts under state highways and county roads that are not designated countydrains are maintained by the county Road Commissions.Political jurisdictions regarding the <strong>Huron</strong> <strong>River</strong> and its tributaries, riparian zones, and land arecontrolled by federal and state laws, county and local ordinances, and town by-laws. Regulatoryand enforcement responsibility for water quantity and quality regulation often lies with the UnitedStates Environmental Protection Agency (U.S. EPA) and MDEQ. Major activities regulated bythe state, through the MDEQ, are the alteration/loss of wetlands, pollutant discharges (NPDESpermits), control of stormwater, and dredging/filling of surface waters. The State of Michiganmaintains that:“’Surface waters of the state’ means all of the following, but does not include drainageways and ponds used solely for wastewater conveyance, treatment, or control:(i) The Great Lakes and their connecting waters.(ii) All inland lakes.(iii) <strong>River</strong>s.(iv) Streams.(v) Impoundments.(vi) Open drains.(vii) Wetlands.(viii) Other surface bodies of water within the confines of the state.” 10The <strong>Huron</strong> <strong>River</strong> and its tributaries are public and subject to public trust protection. TheMichigan Natural <strong>River</strong>s Act (PA 231, 1970) designated a 27.5-mile stretch of the <strong>Huron</strong> <strong>River</strong>from Kent Lake Dam in Oakland County to Barton Pond in Washtenaw County as a “countryscenicriver.” The most western portion of the <strong>Huron</strong> <strong>River</strong> within the Middle <strong>Huron</strong> <strong>Watershed</strong> ispart of this stretch. The Natural <strong>River</strong>s District includes 400 feet on either side of the ordinarywatermark where development is severely limited. On private lands, zoning requires 125 feetbuilding setbacks on the mainstem and 50 feet setbacks on tributaries. Minimum lot width fornew construction is 150 feet, with a 125 foot septic setback, and 50 feet of natural vegetationalong the river. All restrictions apply to public lands as well, and the natural vegetationAnn Arbor-Ypsilanti Metropolitan Area 2-21<strong>Watershed</strong> <strong>Management</strong> <strong>Plan</strong>
equirement increases to 100 feet for public lands. Within the District, no new commercial,industrial or extractive development is permitted within 300 feet of the river or tributaries.County government assumes responsibility for carrying out certain state policies. In most cases,county governments enforce the state erosion control policy, under the Michigan Soil Erosionand Sedimentation Control Act 347 of 1972 and Part 91 of Act 504 of 2000, although localgovernments may also administer this program, and county road commissions typically selfregulatetheir erosion control. At the time of this publication the City of Ann Arbor was the onlylocal government in the Middle <strong>Huron</strong> <strong>Watershed</strong> known to administer its own soil erosion andsediment control program.Designated county drains in the watershed may be open ditches, streams or undergroundpipes, retention ponds or swales that convey stormwater. The Drain Commissioner Offices ofWashtenaw and Wayne Counties are responsible for operation and maintenance of these stormwater management systems ("county drains"). These systems are designed to provide stormwater management, drainage, flood prevention, and stream protection for urban and agriculturallands. The Drain Code gives the Drain Commissioners authority for construction or maintenanceof drains, creeks, rivers and watercourses and their branches for flood control and watermanagement.In addition to oversight of these drains, the County Drain Commissioners are required tomaintain established lake levels throughout the watershed. Through the Inland Lake Level Act(Act 146, P.A. of 1961), a board of commissioners may file a petition in circuit court to establisha special assessment district to pay the costs of establishing and maintaining a lake level. TheDrain Commissioner must determine the apportionment of costs incurred and assess formaintenance of the lake level. Section 24 of the Inland Lake Level Act requires inspection of alllake level control structures on all inland lakes that have normal levels established under thisAct to be completed once every three years by a licensed professional engineer.While state and county governments take an active role in many relevant watershed or waterquality regulations and policies, local governments assume much leadership in land and watermanagement by passing and enforcing safeguards. These local ordinances can be moreprotective than state laws, though state regulations set minimum protections that cannot beviolated. Working under numerous established procedures, local governments may enactordinances to control stormwater runoff and soil erosion and sedimentation; protect sensitivehabitats such as woodlands, wetlands and riparian zones; and establish watershed-friendlydevelopment standards and lawn care and landscaping practices, among other options. Localgovernments oversee enforcement of their policies.2.2.2 Growth TrendsPrior to European settlement, the region around the watershed was occupied by Chippewa andPotawatomi Native American tribes who had long used the land for farming. Despite anunfavorable report by the U.S. Surveyor-General in 1815 that characterized the soils in the areaas being unsuitable for farming, European settlers soon began to recognize the area’sagricultural potential, which subsequently became an important area for livestock and grain inthe 19 th century. This agricultural trend thrived until, in the wake of World War II, growth insoutheast Michigan was catalyzed by the baby boom, increased automobile ownership, andestablishment of better road systems. As a result, the influence of agriculture began to diminishas land was transferred to suburban uses in a trend that continues today.Ann Arbor-Ypsilanti Metropolitan Area 2-22<strong>Watershed</strong> <strong>Management</strong> <strong>Plan</strong>
The watershed area has experienced tremendous economic growth and development pressuresdue to it’s proximity to suburban Detroit. Downstream (eastern) portions of the watershed inBelleville, Ypsilanti and Ann Arbor and portions of the surrounding townships have beenurbanized and assimilated into the metro Detroit area. Growth around these urbanized areascontinues at high rates. These growth pressures continue to radiate westward through thewatershed, reflecting a trend in growth from Detroit to more outlying areas spurred by road andhighway improvements, infrastructure, and a desire for open space.A discussion of growth trends in the watershed is challenged by the fact that readily availabledemographic data is based on political, rather than hydrologic boundaries. Furthermore, forseveral of the watershed’s 15 communities, only small portions of their areas are located in thewatershed. As such, growth trends in these peripheral communities are not necessarilyindicative of growth trends in the watershed as a whole. Therefore, this section focuses on tencommunities in Washtenaw County, as well Van Buren Township in Wayne County, whichcumulatively represent 96% of the watershed area. Growth and development trends in thesecore communities are generally indicative of the watershed as a whole.In examining growth and land use trends in the Middle <strong>Huron</strong> <strong>Watershed</strong>, it is helpful to place itin the larger context of trends in the five-county area of southeast Michigan. SEMCOG hascombined U.S. Census data and land use data to determine changes in growth and land usethat have occurred in the region between 1990 and 2000. Among the key findings are thefollowing 11 :• Developed land in the region increased by 17.7% (163,634 acres), which equates to an8.1% decrease in undeveloped land. Residential development accounted for 76% of alldeveloped land.• The region’s population grew by 5% (243,000 people), a major factor in land usechange.• Residential housing development saw a dramatic decrease in density. In 1990, housingdensity averaged 2.85 units per acre. Residential units built between 1990 and 2000averaged 1.23 units per acre• Average household size has decreased and average home size has increased• The average number of persons per household decreased from 2.66 in 1990 to 2.58 in2000.In summary, much of the undeveloped land in southeast Michigan is being developed toaccommodate new housing demands from an increasing population. The average home insoutheast Michigan is increasing in size and consuming more land while housing fewer people.These trends, which have serious implications for environmental impacts in the region and canbe expected to continue, are also evident in the communities comprising the Middle <strong>Huron</strong><strong>Watershed</strong>.According to U.S. Census data, Washtenaw County’s population increased between 1990 and2000 by approximately 14%. From 2000 to October 2007, SEMCOG estimates that theCounty’s population increased by 8.9%, from just over 322,700 to just over 351,500. Bycomparison, the population in southeast Michigan increased during this same period by 1.1%,while Livingston County saw an increase of 23.8% and Oakland County increased by 2.2% 12 .From 2007 to 2030, SEMCOG projects that Washtenaw County’s population will increase over27.5% to 448,020, an increase of over 96,000 13 . Population changes for communities that areAnn Arbor-Ypsilanti Metropolitan Area 2-23<strong>Watershed</strong> <strong>Management</strong> <strong>Plan</strong>
located primarily in the Middle <strong>Huron</strong> <strong>Watershed</strong> are listed below in Table 2.3. Note that thesedata are for the entire communities, not just their areas within the Middle <strong>Huron</strong> <strong>Watershed</strong>.Table 2.3. 1990-2030 Population Changes for Core Communities in the Middle <strong>Huron</strong><strong>Watershed</strong> 14 1990Census2000CensusChange1990-2000Change2000-20072007SEMCOGestimate2030SEMCOGforecastChange2007-2030Pittsfield Twp. 17,650 30,167 70.9% 35,029 16.1% 63,764 82.0%Ypsilanti Twp. 45,307 49,182 8.6% 53,616 9.0% 70,141 30.8%Ypsilanti City 24,846 22,237 -10.5% 21,038 -5.4% 22,110 5.1%Dexter Village 1,497 2,338 56.2% 3,559 52.2% 5,472 53.8%Ann Arbor City 109,608 114,024 4.0% 114,510 0.4% 116,270 1.5%Ann Arbor Twp. 3,463 4,385 26.6% 4,478 2.1% 5,112 14.2%Scio Township 9,578 13,421 40.1% 16,408 22.3% 23,164 41.2%Superior Twp. 8,720 10,740 23.2% 13,058 21.6% 18,174 39.2%Van Buren Twp. 21,010 23,559 12.1% 27,811 18.0% 29,556 6.3%Salem Twp. 3,734 5,562 49.0% 6,724 20.9% 11,388 69.4%Webster Twp. 3,235 5,198 60.7% 6,350 22.2% 13,222 108.2%TOTAL 248,648 280,813 12.9% 302,581 7.8% 378,373 25.0%Not surprisingly, the urbanized areas represented by the City of Ann Arbor and Ypsilanti show asmall projected population gain and projected population loss, respectively, through 2030because they have less land available for new development and more people moving intosuburban areas. Pittsfield and Webster Townships show by far the largest projectedpopulations gains, doubling their 2005 population. These communities currently lie on the fringeof the urbanized areas. The combined population of these core communities is projected to beover 378,000 people by 2030, an increase of 25.0%.Table 2.4 illustrates the relation of the number and density of housing units in the watershed’score communities between 1990 and 2000. The change in number of housing units rangewidely from community to community during this time period. Ypsilanti City shows a decreaseof 2% in housing units, while Webster Twp., Salem Twp., Dexter Village and Pittsfield Twp.experienced around 60% increases. All of the building permits issued during this period forthese communities were for single family detached homes, a trend which continues through themost current data available in 2005 15 .The change in average density of these housing units is less dramatic. The communities ofDexter Village, Scio Twp., Van Buren Twp., Salem Twp., and Webster Twp. all exhibit anincrease in density. The Village of Dexter increased dramatically in density due to a lack ofavailable land, whereas the other communities’ increases in density can be better attributed tostrategic planning. Additionally, Ann Arbor Twp., City of Ann Arbor, and Superior Twp. showonly a slight decrease in density.Table 2.4. Housing Units and Densities for Communities in the <strong>Huron</strong> Chain of Lakes <strong>Watershed</strong> 16Ann Arbor-Ypsilanti Metropolitan Area 2-24<strong>Watershed</strong> <strong>Management</strong> <strong>Plan</strong>
HousingUnits in 2000Increase inHousing Units,1990-2000Average Density ofAll Housing Units in2000 (units per acre)Density of HousingUnits Built 1990-2000(units per acre)Pittsfield Twp. 12,337 58.4% 2.56 1.95Ypsilanti Twp. 21,196 13.6% 3.79 2.92Washtenaw Co. 130,974 17.7% 1.85 1.22Ypsilanti City 9,120 -2.2% 7.27 n/aDexter Village 1,106 63.6% 2.97 4.23Ann Arbor Twp. 1,893 29.3% 1.05 1.04Ann Arbor City 47,218 9.6% 5.64 5.10Scio Township 5,234 45.8% 0.94 1.24Superior Twp. 4,097 29.8% 1.13 1.05Van Buren Twp. 10,417 23.5% 2.38 4.95Salem Twp. 2,031 61.4% 0.57 0.96Webster Twp. 1,857 58.3% 0.51 0.552.2.3 Land Use and DevelopmentAs the Middle <strong>Huron</strong> communities develop, the potential increases for negative environmentalimpacts, including water quality impacts from erosion, sedimentation, and increased inputs ofstormwater pollutants. Potential impacts on water quantity also increase as wetlands,woodlands, floodplains and other natural features that regulate water quantity are altered orreplaced with impervious surfaces.Prior to permanent European settlement, grasslands of oak barrens and forests of severalspecies of oak and hickory dominated the landscape of the Middle <strong>Huron</strong> <strong>Watershed</strong>. Thisdominant landscape was interspersed with patches of wetlands, such as lowland hardwood andlakeplain prairie, which were also found throughout the low-lying areas (Figure 2.11).Upon permanent settlement, the land began to be used for human benefit. Initial activities onthe land centered on the clearing of grasslands for agricultural production and the use offorested areas for wood and wood by-products. By 2000, SEMCOG aerial photographic dataindicates the significant changes to the landscape (2.12). Permanent mixed density residentialland use is the single largest use of the watershed (29.5%), followed closely by forest (27.1%),and rural (20.9%). Prairie and grasslands, forested lands, and to a lesser extent, wetlands,experienced moderate to significant reductions in coverage as the area was developed from themid-1800s to late-1900s. The remainder of the land is either commercial/industrial (12.8%),water (4.2%), active construction (3.0%) or roadways (2.7%).The watershed also contains a scattering of small public lands for conservation and recreation(Figure 2.14). Most of the public lands are owned by local government, with a few held by thelocal universities, public schools, non-profit organizations, and State Government. The <strong>Huron</strong>-Clinton Metropolitan Authority owns the Dexter-<strong>Huron</strong> and Delhi Metroparks, which are locatedin the watershed. The cities of Ann Arbor and Ypsilanti also own several small parks along theriver.Ann Arbor-Ypsilanti Metropolitan Area 2-25<strong>Watershed</strong> <strong>Management</strong> <strong>Plan</strong>
Table 2.5 shows the percentage increases for selected land uses in the watershed between1990 and 2000. With the exception of the City of Ypsilanti, the land use categories of singlefamily and multi-family, commercial, and industrial show moderate to significant percentageincreases. With the exception of a low to moderate increase in grassland and shrubs in anumber of communities and a low increase in woodlands and wetlands in Ypsilanti Twp.,Ypsilanti and Van Buren Twp., the land use categories of active agriculture, grassland andshrub, and woodland and wetland all showed moderate to substantial decreases in all corecommunities.Table 2.5. Land Use Change, 1990-2000 for Core Communities in the Middle <strong>Huron</strong><strong>Watershed</strong> 17SingleFamilyMulti-Family CommercialIndustrialActiveAgricultureGrasslandand ShrubWoodlandand WetlandPittsfieldTwp.98.4% 69.3% 45.1% 86.0% -38.1% 22.8% -14.8%YpsilantiTwp.18.4% 15.8% 13.2% 4.6% -27.4% 0.8% 1.3%Ypsilanti City -0.3% 0.3% 4.4% 12.1% n/a -21.9% 3.8%Dexter Village 24.2% 381.6% 52.4% 86.4% -78.9% -7.7% -19.5%Ann ArborTwp.20.1% 53.9% 14.0% 82.5% -13.1% 2.0% -0.9Ann ArborCity6.5% 15.9% 1.3% 13.5% -56.8% -40.1% -9.4%ScioTownship29.4% 293.6% 53.0% 15.6% -20.0% -0.2% -3.2%Superior Twp. 33.8% 8.9% -5.7% 16.7% -17.9% 5.5% -0.4%Van BurenTwp.9.0% 28.0% 26.6% 64.3% -29.3% -5.2% 3.8%Salem Twp. 29.3% n/a 438.7% 79.1% -24.9% 25.5% -4.4%Webster Twp. 51.5% n/a 193.8& 60.6% -13.0 28.2% -1.4%Future land use trends in the Middle <strong>Huron</strong> <strong>Watershed</strong> can be predicted by studying eachcommunity’s master plan. A master plan is a community’s comprehensive guide for all aspectsof future development. This future development is also known as a “build-out” scenario, as itdisplays what a community’s land use would look like if it were fully developed according to itsmaster plan. Build-out scenarios can also be constructed using a community’s zoningordinances. The Middle <strong>Huron</strong> <strong>Watershed</strong>’s build-out scenario according to community masterplans is shown in Figure 2.13.All land use types expand in the future build-out scenario at the expense of open land andagriculture. The most notable change is the expansion of residential areas into areas thatcurrently are actively farmed or are open; residential use is projected to more than double from29% to 67% of the total land area of the watershed. Commercial/industrial land use is projectedto increase from 15% to 22%. The combined current land uses of agriculture (21%) forest (8%),open space (23%) and public/recreation (4%) account for 56% of the watershed area. In thebuild-out scenario, these land uses will account for only 11% of the watershed area.2.2.4 Existing Point SourcesThere are several point source facilities in the watershed that hold NPDES permits issued bythe State of Michigan (Figure 2.16). The number of permitted point sources is not static due toAnn Arbor-Ypsilanti Metropolitan Area 2-26<strong>Watershed</strong> <strong>Management</strong> <strong>Plan</strong>
expiring old permits and activation of new permits. At the writing of this document, fifty permitswere in issuance 18 . Two point sources in the Middle <strong>Huron</strong> <strong>Watershed</strong> are considered majorcontributors for the amount of discharge they emit. These facilities are the Loch Alpine SanitaryAuthority, serving the small community of Loch Alpine in Webster and Scio Townships, and theAnn Arbor Waste Water Treatment <strong>Plan</strong>t, serving the city of Ann Arbor and parts of Ann ArborTownship.The remaining permitees are considered minor point source dischargers and are privatelyowned. Receiving waters for the discharges include direct drainage to the <strong>Huron</strong> <strong>River</strong>, allmajor tributaries (except Traver Creek), numerous secondary streams or drains, andimpoundments along these water bodies. Forty-eight of the permits are issued for the purposeof conveying stormwater to local waterways, 27 are for discharge of various types of industrialwastewater, one for discharge from a municipal separate storm sewer, one is for a constructionproject and two are for discharge from the municipal wastewater treatment plants mentionedabove. The remaining 17 are standard discharge permits.Due to the nutrient TMDL in Ford and Belleville Lakes, waste load allocations for phosphoruscontributions from permitted point sources have been established in all upstream contributingportions of the <strong>Huron</strong> <strong>River</strong> <strong>Watershed</strong>. These waste load allocations place restrictions on thetotal amount of phosphorus that can be discharged into waters flowing to these TMDL areas.Such restrictions have implications for determining the amount of phosphorus that may bedischarged by existing NPDES permitees. Waste load allocations also factor into determiningwhether additional phosphorus-discharging facilities may be permitted to locate in a TMDL area.For additional information on phosphorus load allocations in the phosphorus TMDL, refer toSection 2.5.1 and Appendix A.2.2.5 Sanitary Sewer Service Areas and Privately Owned SepticSystemsThe Middle <strong>Huron</strong> <strong>Watershed</strong> hasa mix of households whose wastedischarges are treated by publiclyowned wastewater treatmentplants (WWTP) or on-sitedecentralized wastewater systems(privately-owned septic systems).Sanitary sewers rely on theconnection of pipes fromresidential, commercial, andindustrial sites that ultimately arereceived at a wastewatertreatment plant where treatmentsare applied before discharge.Privately owned on-site septicsystems, or septic tanks, allowwastewater from a single (sometimes multiple) entity to be treated via biological and infiltrationprocesses. Both technologies are effective methods of wastewater treatment if maintained andoperated properly; however, impairments do occur. Households currently served by sanitarysewers are located in the urbanized areas of the watershed, while remaining areas are servedby on-site septic systems (Figure 2.16).Ann Arbor-Ypsilanti Metropolitan Area 2-27<strong>Watershed</strong> <strong>Management</strong> <strong>Plan</strong>
Improperly functioning sewer systems and privately owned septic systems can have a profoundimpact on the water quality. By carrying nutrients (phosphorus and nitrogen), bacteria,pharmaceutical agents, and other pollutants to waterbodies with little or no treatment, impairedsystems can result in unhealthful conditions to humans (i.e., bacterial contamination) and toaquatic organisms (i.e., low dissolved oxygen from plant growth).If either system is designed, constructed, or maintained improperly, it can be a significantsource of water pollution and a threat to public health. The health departments of Livingston,Oakland, and Washtenaw Counties regulate the design, installation, and repair of privatelyowned septic systems. However, only Washtenaw County currently requires regularmaintenance and inspection to assure proper functioning of these systems, which occurs at thetime the property is sold. Through implementation of the time-of-sale program, WashtenawCounty has determined that 20% of privately owned septic systems in the county are failing andrequire repair.Sanitary sewer systems can suffer from improper installation and maintenance. For instance, inmany older developments sanitary sewer pipes can be inadvertently connected to stormwaterdrainage systems, causing what is termed an “illicit discharge.” These discharges can have aneven greater impact on water quality than impaired septic systems, depending on the type,volume, and frequency of the activity. Both county and local units of government covered byPhase II stormwater permits are required to identify and eliminate illicit discharges in theircommunities through an Illicit Discharge Elimination Program (IDEP).Recent legislation has facilitated the ability of new development projects to utilize communitywastewater systems, also known as decentralized wastewater systems, which provide on-sitewastewater treatment for multiple homes much like a giant septic system. Communitywastewater systems are increasingly being used to build high density developments in unseweredareas where soils are not suitable for individual septic systems.A drawback of these large septic systems is the potential discharge of large quantities of septicwaste into a localized groundwater area. Conversely, community wastewater systems can alsobe a tool for mitigating the impacts of individual septic systems over a larger area; rather thanlocating several individual septic systems in close proximity to a lake or waterway where theycould pose a greater risk to surface waters or groundwater, a community wastewater systemcould allow the homes to be built near the waterbody, while the community septic system wouldbe located at a greater distance from the waterbody. Due to the potential impacts of communitywastewater systems, communities should be aware of their complexities and plan accordinglyfor their location, construction, and operation.Ann Arbor-Ypsilanti Metropolitan Area 2-28<strong>Watershed</strong> <strong>Management</strong> <strong>Plan</strong>
Figure 2.11
Figure 2.12
Figure 2.13
Figure 2.14
Figure 2.15
Figure 2.16
2.3 WATER QUALITY INDICATORSThis section provides a synopsis of common indicators for gauging water quality. These waterquality parameters include phosphorus, nitrogen, sediment, turbidity and dissolved/suspendedsolids, conductivity, dissolved oxygen, bacteria, temperature, pH and benthic macroinvertebrateassessments (aquatic insects and mussels). A general discussion of basic limnology (lakebehavior) is also presented. While these indicators are important and useful in evaluatingoverall water quality, data for all of these parameters were not readily available for allcreeksheds in the watershed.2.3.1 Chemical and Physical IndicatorsPhosphorusPhosphorus and nitrogen are nutrients essential for the growth of aquatic plants. Phosphorus isneeded for plant growth and is required for many metabolic reactions in plants and animals.Generally, phosphorus is the limiting nutrient in freshwater aquatic systems. That is, if allphosphorus is used up, then plant growth will cease no matter how much nitrogen is available.Phosphorus is the main parameter of concern that causes excessive plant and algae growth(eutrophication) in lakes and impoundments. The extent to which this process has occurred isreflected in a lake's trophic classification: oligotrophic (nutrient-poor or low plant productivity),mesotrophic (moderate nutrient levels and moderate plant productivity), eutrophic (nutrient-rich,high plant productivity) and hypereutrophic (excessive plant productivity and excessivenutrients). Eutrophic and hypereutrophic conditions are characterized by depletion of dissolvedoxygen in the water. Low levels of dissolved oxygen adversely affect aquatic animal populationsand can cause fish kills. High nutrient concentrations interfere with recreation and aestheticenjoyment of waterbodies by causing reduced water clarity, unpleasant swimming conditions,foul odors, blooms of toxic and nontoxic organisms, and interference with boating.Phosphorus enters surface waters from point and nonpoint sources, with nonpoint sourcesaccounting for the vast majority of phosphorus loading in the <strong>Watershed</strong>. Wastewater treatmentplants are the primary point sources of the nutrient. Additional phosphorus originates from theuse of industrial products, such as toothpaste, detergents, pharmaceuticals and food-treatingcompounds. Tertiary treatment of wastewater, through biological removal or chemicalprecipitation, is necessary to remove more than 30% of phosphorus.Nonpoint sources of phosphorus include human, natural, and animal sources. Becausephosphorus has a strong affinity for soil, stormwater runoff from activities that dislodge soil orintroduce excess phosphorus (such as conversion of land to urban uses and over-fertilization oflawns) is frequently considered the major nonpoint source of phosphorus contribution towaterbodies. Eroded sediments from agricultural areas carry phosphorus-containing soil tosurface waters. Septic system failures and illicit connections also are routes for phosphorusintroduction. Domesticated animal and pet wastes that enter surface waters comprise anothernonpoint source of phosphorus. Natural sources include phosphate deposits and phosphaterichrocks that release phosphorus during weathering, erosion and leaching; and sediments inlakes and reservoirs that release phosphorus during seasonal overturns. MDEQ considers totalphosphorus concentrations higher than 0.03 mg/L (parts per million) to have the potential tocause eutrophic conditions.Ann Arbor-Ypsilanti Metropolitan Area 2-35<strong>Watershed</strong> <strong>Management</strong> <strong>Plan</strong>
NitrogenNitrogen is also considered essential in determining algae growth in lakes and is found in anumber of forms, including molecular nitrogen, ammonia, nitrates, and nitrites. Nitrogen is oftenfound in waterbodies at higher concentrations than phosphorus. Consequently, nitrogen is oftennot considered the limiting nutrient to detrimental growth. Additionally, unlike phosphorusloading, nitrogen loading is often difficult to reduce due to the high water solubility of nitrogen.Therefore, concerns regarding nitrogen and its role in eutrophication often are consideredsecondary to phosphorus in southeast Michigan. However, studies have shown that high nitrateconcentrations, even without Phosphorus limitations, can promote eutrophication. Typicalsources of nitrogen in surface waters include human and animal wastes, decomposing organicmatter, and runoff from fertilizers. Improperly operated wastewater treatment plants and septicsystems, as well as sewer pipeline leaks also can act as additional sources of nitrogen towaterbodies. MDEQ considers total nitrogen levels greater than 1 to 2 mg/L to have thepotential to cause eutrophic conditions 19 . Nitrate levels above 10 mg/L are considered unsafefor drinking water 20 .SedimentStream bottoms or substrate, can be composed by a number of different materials, dependingon the geology of the stream bed and surrounding drainage area. This substrate can vary froma predominance of large particles such as gravel, cobble or even bedrock to moderately sizedsands to fine organic particles in silt and clay. Silt, which is the fine-grained particulate matterthat results from eroded soil, can be deposited in streams over substrate naturally naturallycomposed of larger particles. Silt in riffles can limit the number of creatures living in a creekbecause it fills the spaces between surfaces and reduces oxygen in the substrate. Eroded siltalso degrades water quality because soil binds pollutants, like phosphorus, which helps tocreate nuisance algae blooms. Many streambeds in the <strong>Huron</strong> <strong>River</strong> system are sandy orgravelly naturally. When fine sediments build up too fast thenatural aquatic ecology cannot adapt quickly enough and thebiotic diversity may be degraed. Erosion is a natural process,but dramatic increases in fine sediment suggest unnaturallyhigh erosion rates.Turbidity and Suspended Sediments or SolidsTurbidity is the measure of the relative clarity of water and isan approximation of suspended solids in the water thatreduce the transmission of light. This relationship dependson several factors including the size and shape of thesuspended particles along with their density in the water, aswell as the degree of turbulence at the sample site. Turbidityshould not be confused with color since darkly colored watercan still have low turbidity or high relative clarity. Totalsuspended solids (TSS) include all particles suspended inwater that will not pass through a filter of a specified size.Suspended solids are any particles/substances that areneither dissolved nor settled in the water. Total DissolvedStormwater carries sedimentdirectly into the nearest waterway.Photo: HRWC filesSolids (TDS) include anything present in water other than water other simple molecules suchas minerals, salts, metals, cations or anions dissolved in water. A third measure, suspendedAnn Arbor-Ypsilanti Metropolitan Area 2-36<strong>Watershed</strong> <strong>Management</strong> <strong>Plan</strong>
sediment concentration (SSC) is now being promoted by MDEQ, USGS and EPA as a moreaccurate measure for open channel monitoring. SSC differs from TSS in the methods ofcalculation. Both express the amount of sediments suspended in a sample of water.High turbidity and TSS/SSC result from soil erosion, stormwater runoff, algal blooms and bottomsediment disturbances. Turbid water absorbs heat from the sun. Warmer water holds lessoxygen than cooler water, resulting in less oxygenated water. Water with high turbidity loses itsability to support diverse aquatic biology. Suspended solids can be diverse in composition,including clay, silt and plankton as well as industrial wastes and sewage or other components.High amounts of suspended solids can clog fish gills, reduce growth rates and diseaseresistance in aquatic organisms, decrease photosynthesis efficiency, reduce dissolved oxygen(discussed in a later section) levels, and prevent egg and larval development. Settled particlescan accumulate on the stream bottom and smother fish and amphibian eggs and aquatic insectsincluding larvae of benthic macroinvertebrates.Michigan Water Quality Standards set a narrative standard that waters of the state shall nothave any of the following unnatural physical properties in quantities which are or may becomeinjurious to any designated use: turbidity, color, oil films, floating solids, foam, settleable solids,suspended solids, and deposits. Most observers consider water with a TSS concentration lessthan 20 mg/l to be relatively clear. Water with TSS levels between 40 and 80 mg/l tends toappear cloudy, while water with concentrations over 150 mg/l usually appears dirty. The natureof the particles that comprise the suspended solids may cause these numbers to vary. 21Standards have not been established for turbidity and TDS, but levels for these indicators havebeen set for stream segments that have been listed for impairment of biota.A simple, though somewhat subjective, method of measuring water clarity in lakes uses aSecchi disk, which is an 8-inch diameter plate with alternating quadrants painted black andwhite. The observer lowers the disk into water until it disappears from view and then raises ituntil it becomes just visible. An average of the two depths, taken from the shaded side of theboat, is recorded as the Secchi disc reading. Nearly all Secchi disc measurements on Michiganinland lakes will be between one and forty feet, and this score is also an indicator of nutrientlevels in the lake. MDEQ classifies Secchi disk readings greater than 16 feet as indicative ofoligotrophic (low nutrient) conditions. Secchi disk readings between 6.5 and 16 feet indicatemesotrophic conditions, and Secchi disk readings less than 6.5 feet indicate eutrophic (highnutrient) or hypereutrophic conditions. 22 Most lakes in southeast Michigan are classified aseither mesotrophic or eutrophic.ConductivityConductivity, a broad indicator of general water quality, increases with the amount of dissolvedions, such as salts or metals. There is some evidence that average conductivity measured at asite over 800 microSiemens (µS) can be correlated with lower stream biodiversity. 23Conductivity over 800 µS may indicate the presence of toxic substances, but it can also be highdue to naturally occurring ions. Many toxins are also not detected by conductivity measures. Ahigh conductivity measurement signals a need for further investigation to better determine thecause and potential sources.Conductivity has been recorded at ten sites in the Middle <strong>Huron</strong> <strong>Watershed</strong> by the Middle <strong>Huron</strong>Stream Nutrient Monitoring program. Monitoring data is collected once monthly from Maythrough September from 2002 through 2006. Figure 2.17 depicts the mean levels and range foreach site. The data are discussed further in section 2.4.Ann Arbor-Ypsilanti Metropolitan Area 2-37<strong>Watershed</strong> <strong>Management</strong> <strong>Plan</strong>
Figure 2.17. Conductivity measurement statistics for ten sites in the Middle <strong>Huron</strong> <strong>Watershed</strong>. Errorbars indicate standard deviation and the 800 µS standard is highlighted.SaltsSalts are compounds composed of positively charged ions paired with negatively charged ions.A common example is table salt: sodium (Na) and chloride (Cl). Salts typically enter waterwaysfrom road salting (de-icing) operations or from water softener backwash discharged into theenvironment. The most common de-icing product, sodium chloride, is used locally by MDOT,county road commissions, homeowners, and business/commercial establishments. Mosthighway and road commissions have specific policies and procedures regarding salt application,salt/sand mixtures, and storage.There are several environmental concerns regarding the use of de-icing salts and watersoftener backwash discharge. Salts are highly soluble in water and easily wash off pavementinto surface waters and leach into soil and groundwater. High concentrations of salt candamage and kill vegetation, disrupt fish spawning in streams, reduce oxygen solubility in surfacewater, interfere with the chemical and physical characteristics of a lake, and pollute groundwatermaking well water undrinkable.However, Michigan has no water quality standards for salt concentrations and little is knownabout “how much salt is too much.” Furthermore, the ecological impacts of salt in freshwatersystems vary considerably according to localized site conditions, making it difficult to establishgeneral limits for acceptable quantities of salt application or environmental concentrations.Best management practices to reduce salt inputs may include the use of alternative road deicerssuch as calcium carbonate or calcium acetate that are not as detrimental to water quality.Ann Arbor-Ypsilanti Metropolitan Area 2-38<strong>Watershed</strong> <strong>Management</strong> <strong>Plan</strong>
In addition to salt alternatives, proper calibration of salt dispensing equipment and optimizingthe timing of de-icing applications can reduce over-use of salt and alternative de-icers.Dissolved OxygenDissolved oxygen (DO) refers to the volume of oxygen that is contained in water.DO is essential for fish and is an important component in the respiration of aerobic plants andanimals, photosynthesis, oxidation-reduction processes, solubility of minerals, anddecomposition of organic matter. Aquatic plants, algae and phytoplankton produce oxygen as aby-product of photosynthesis. Oxygen also dissolves rapidly into water from the atmosphereuntil the water is saturated. Dissolved oxygen diffuses very slowly and depends on themovement of aerated water. DO levels fluctuate on a diurnal basis. They rise from morningthrough late afternoon as a result of photosynthesis, reach a peak in late afternoon, then dropthrough the night as a result of photosynthesis stopping while plants and animals continue torespire and consume oxygen. DO levels fall to a low point just before dawn.The amount of oxygen an organism requires varies according to species and stage of life. DOlevels below 1-2 mg/L do not support fish. DO levels below 3 mg/L are stressful to most aquaticorganisms. Minimal DO levels of 5-6 mg/L usually are required for growth and activity. Low DOlevels encourage the growth of anaerobic organisms and nuisance algae. The accumulation oforganic wastes and accompanying aerobic respiration by microorganisms as they consume thewaste depletes DO in freshwater systems. High levels of bacteria from sewage pollution andhigh levels of organic matter can lead to low DO levels. Michigan Water Quality Standardsstates that surface waters protected for warmwater fish and aquatic life must meet a minimumdissolved oxygen standard of 5 mg/l. 24Dissolved oxygen levels have been recorded at ten sites in the Middle <strong>Huron</strong> <strong>Watershed</strong> by theMiddle <strong>Huron</strong> Stream Nutrient Monitoring program. Monitoring data is collected once monthlyfrom May through September from 2002 to 2006. Figure 2.18 depicts the mean levels andrange for each site. All sites in the watershed averaged well above standard criteria, and onlyMill Creek and Swift Run had single measurements below the standard. The data are discussedfurther in section 2.4.Ann Arbor-Ypsilanti Metropolitan Area 2-39<strong>Watershed</strong> <strong>Management</strong> <strong>Plan</strong>
Figure 2.18. Dissolved oxygen levels for ten sites in the Middle <strong>Huron</strong> <strong>Watershed</strong> for May‐September 2002 to2006. Error bars indicate one standard deviation, and the water quality standard of 5 mg/L is highlighted in red.BacteriaBacteria are microorganisms that are found everywhere. Coliform is a group of bacteria thatincludes a smaller group known as fecal coliforms, which are found in the digestive tract ofwarm-blooded animals. Their presence in freshwater ecosystems indicates that pollution bysewage or wastewater may have occurred and that other harmful microorganisms may bepresent. A species of fecal coliform known as Escherichia coli or E. coli is analyzed to test forcontamination. E. coli counts are used as a measure of possible drinking water contamination,as high concentrations can result in serious illness. The potential sources of E. coli in surfacewaters are varied and difficult to pinpoint. They include human sources such as failed septicfields, but also wildlife sources such as geese and raccoons and pet or feral sources as well.Rule 62 of the Michigan Water Quality Standards (Part 4 of Act 451) limits the concentration ofmicroorganisms in surface waters of the state and surface water discharges. Waters of the statethat are protected for total body contact recreation must meet limits of 130 Escherichia coli (E.coli) per 100 milliliters (ml) water as a monthly geometric mean of five sampling events (3samples per event) and 300 E. coli per 100 ml water for any single sampling event during theMay 1 through October 31 period. The limit for waters of the state that are protected for partialbody contact recreation is a geometric mean of 1000 E. coli per 100 ml water for any singlesampling event at any time of the year. 25In 2006, the stream monitoring program under the Middle <strong>Huron</strong> Partnership Initiative began tocollect grab samples for E. coli counts along with other standard measurements from Maythrough September. All sites except the <strong>Huron</strong> <strong>River</strong> site exceeded the single event standard,Ann Arbor-Ypsilanti Metropolitan Area 2-40<strong>Watershed</strong> <strong>Management</strong> <strong>Plan</strong>
which indicates that E. coli bacteria pollution is a significant concern in the watershed. Individualsite results are shown in figure 2.19 and discussed in section 2.4.Monitoring of public bathing beaches in the watershed is performed by the County HealthDepartments. However, there are no public bathing beaches in the Middle <strong>Huron</strong> <strong>Watershed</strong>.<strong>Huron</strong> Mill Honey Allens Traver Fleming Malletts Swift SuperiorFigure 2.19. E. coli counts measured for nine sites during the growing season in 2006.TemperatureWater temperature directly affects many physical, biological, and chemical characteristics of ariver. Temperature affects the amount of oxygen that can be dissolved in the water, the rate ofphotosynthesis by algae and larger aquatic plants, the metabolic rates of aquatic organisms,and the sensitivity of organisms to toxic wastes, parasites, and diseases. These factors limit thetype of macroinvertebrate and fish communities that can live in a stream.An average summer temperature of about 72º F is the warmest water that will support coldwaterfish, such as sculpin and trout. Fish that can survive in warmer waters up to 77º F includesmallmouth bass, rockbass, sunfish, carp, catfish, suckers, and mudminnows. Averagesummer temperatures above 77º F exclude many fish and cool water insects 26 . Fluctuations intemperature also affect biodiversity. Extreme fluctuation in summer temperature, as defined bya difference of more than 18º F between the average maximum and average minimum streamtemperature, have been found to decrease fish diversity at warm sites. 27Thermal pollution—the discharge of heated water from industrial operations, dams, orstormwater runoff from hot pavement and other impervious surfaces—often causes an increasein stream temperature. The Michigan Water Quality Standards specify that the Great Lakes andconnecting waters and inland lakes shall not receive a heat load that increases the temperatureof the receiving water more than 3º F above the existing natural water temperature (after mixingwith the receiving water). <strong>River</strong>s, streams and impoundments shall not receive a heat load thatincreases the temperature of the receiving water more than 5º F for warmwater fisheries. Thesewaters shall not receive a heat load that increases the temperature of the receiving water abovemonthly maximum temperatures (after mixing). 28Ann Arbor-Ypsilanti Metropolitan Area 2-41<strong>Watershed</strong> <strong>Management</strong> <strong>Plan</strong>
Acidity (pH)Measuring pH provides information about the H+ concentration in the water. pH is measured ona logarithmic scale that ranges from 0-14, so river water with a pH value of 6 is 10 times moreacidic than water with a pH value of 7. Organisms that live in rivers and streams can surviveonly in a limited range of pH values. In Michigan surface waters, most pH values rangebetween 7.6 and 8.0. Michigan Water Quality Standards require pH values to be within therange of 6.5 to 9.0 for all waters of the state. The pH of rivers and streams may fluctuate due tonatural events, but humans also can cause unnatural fluctuations in pH. For example, chemicalcontamination from spills can cause short-term pH changes.pH levels have been recorded at ten sites in the Middle <strong>Huron</strong> <strong>Watershed</strong> by the Middle <strong>Huron</strong>Stream Nutrient Monitoring program. Monitoring data is collected once monthly from Maythrough September from 2002 to 2006. Figure 2.20 depicts the mean levels and range for eachsite. All monitoring sites averaged within the acceptable range. Only one measurement inHoney Creek was below the acidity standard. The data are discussed further in section 2.4.98.587.5pH76.565.55MeanMaximumMinimumFigure 2.20. pH statistics for ten sites in the Middle <strong>Huron</strong> <strong>Watershed</strong>. Data was collected May‐September, 2002through 2006. Error bars depict standard deviation.2.3.2 Aquatic Biological CommunitiesAquatic insectsInsects living in the creek compose the benthic macroinvertebrate (no backbone) population,along with clams and other mollusks, crayfish, among other taxa. Typically, monitoring focusesAnn Arbor-Ypsilanti Metropolitan Area 2-42<strong>Watershed</strong> <strong>Management</strong> <strong>Plan</strong>
on insects (in aquatic stages of development) as they are representative of a variety of trophiclevels, are sensitive to local environmental conditions and are easy to collect. Since the benthicpopulation depends on the physical conditions of the stream as well as water quality, itscomposition indicates the overall stream quality. Insect diversity indicates good stream quality,and is measured by the number of different insect families. 87 benthic insect families are foundin the <strong>Huron</strong> <strong>River</strong> <strong>Watershed</strong>. 29Much of the benthic macroinvertebrate data in thisdocument is from <strong>Huron</strong> <strong>River</strong> <strong>Watershed</strong> <strong>Council</strong>’sAdopt-A-Stream Program, which relies on trainedvolunteers to monitor more than 70 sites in thewatershed, including 30 in the Middle <strong>Huron</strong><strong>Watershed</strong>. Monitoring data has been gatheredsince as early as 1994 at some sites through annualspring and fall collection days, and a winter stoneflysearch each January. Not all sites have beenmonitored at each collection event, but all sites havebeen monitored at least once per year sincemonitoring began at the site.Brush-legged Mayfly (Ephemeropteraisonychiidae) drawing: Matt WimsattInsect families belonging to the orders ofEphemeroptera (mayflies), Plecoptera (stoneflies), and Trichoptera (caddisflies) are known asthe EPT families, which are indicators of alterations in stream flow, temperature, oxygen andother changes that raise metabolic rates.Sensitive insect families, such as Perlidae (Perlid stonefly) and Brachycentridae (log-cabincaddisfly), are highly sensitive to organic pollution; 19 of the 87 benthic insect families living inthe <strong>Huron</strong> <strong>River</strong> <strong>Watershed</strong> are sensitive. 30The presence of winter stoneflies, which are active in January and require high levels of oxygen,are indicators of good stream quality. Absence of winter stoneflies suggests that toxic pollutantsmay be present. This is because organic pollutants, such as fertilizer and human or animalwaste, are associated with stormwater runoff in warmer months. Because there is usually littleor no stormwater runoff in January, there is a greater likelihood that any pollutants in the streamare persistent (long-lasting) inorganic toxic substances are present in the bottom of thestreambed. Conversely, at a site where insect diversity is lower than expected but winterstoneflies are present, organic pollutants are more likely to be the problem.The Adopt-A-Stream Program also rates the “ecological conditions” at each site, which isdetermined by both the biological and physical conditions of the site. Biological conditionsinclude the diversity of insect families, EPT families, and sensitive families. Physical conditionsare determined by conductivity results and “measuring and mapping” assessments of habitat.These assessments involve examining characteristics such as the stream banks, stream widthsand depths, and bed material (such as sand, gravel, or muck). When interpreting the biologicaland physical conditions, more diversity is generally expected at larger sites or sites with coolersummer stream temperatures.Ann Arbor-Ypsilanti Metropolitan Area 2-43<strong>Watershed</strong> <strong>Management</strong> <strong>Plan</strong>
FishFish depend upon aquatic insects for food, and they also need good quality stream habitats andfree-flowing reaches for all life cycle phases. More than 90 species of fish are native to the<strong>Huron</strong> <strong>River</strong> <strong>Watershed</strong>, however at least 99 species now live in its waters due to humaninducedchanges to the river’s fish communities. Many native species still are present andabundant, yet many have declined to the point of rarity and are considered threatened orendangered. Increased peak flows, reduced summer base flows, increased and more variedtemperatures, and increased turbidity and sediment loads have negatively affected critical fishhabitat requirements, particularly as they relate to spawning and survival of young fishes. Damshave also affected fish populations by altering temperature and flow patterns, as well asinundating more high-gradient reaches and blocking migrations among critical seasonal habitatswithin the river. 31No information is available on the pre-European settlement fish community in the Middle <strong>Huron</strong>system. The headwaters and most tributaries of the <strong>Huron</strong> <strong>River</strong> had fairly stable flows.Summer water temperatures remained cool due to substantial water volumes, shaded banks,and local inflow of additional groundwater. Diverse habitats existed, including extensive graveland cobble riffles, deep pools with cover, channel-side marshes, and flood plain wetlands. A1938 survey of the headwaters and tributaries upstream of Ann Arbor found about 25 species. 32Higher-gradient stretches with extensive gravel riffles and pools held mudminnow, hornyheadchub, silver shiner, rosyface shiner, common shiner, lake chubsucker, northern hog sucker,golden redhorse, black redhorse, yellow bullhead, stonecat, tadpole madtom, brindled madtom,longear sunfish, rock bass, smallmouth bass, rainbow darter, fantail darter, and greensidedarter. Vegetation-dependant mud pickerel, northern pike, blackstripe topminnow, and leastdarter were also present. Most common in the faster flowing, low gradient stretches connectingnatural lakes were white sucker, largemouth bass, bluegill, pumpkinseed, Johnny darter,logperch, and yellow perch. Neither muskellunge nor walleye were found in the 1938 survey.These may have been originally present but extirpated during early settlement.The <strong>Huron</strong> <strong>River</strong> and its tributaries in the Middle <strong>Huron</strong> <strong>Watershed</strong> are considered warmwaterfish habitat, mostly of second quality. Second quality warmwater feeder streams (tributaries ofthe mainstem of the <strong>Huron</strong> <strong>River</strong>) are those that contain significant populations of warmwaterfish, but game fish populations are appreciably limited by such factors as pollution, competition,or inadequate natural reproduction. Small streams are often difficult to fish because of theirsmall size; typically less than 15 feet wide. 332.3.3 Lake Behavior (Limnology)Limnology is the physical, chemical, and biological science of study of freshwater systems,including lakes. The Middle <strong>Huron</strong> includes several significant impoundments. A general reviewof lake behavior in response to nutrients is useful for understanding how lake and river systemdynamics differ.While numerous water quality parameters are studied to determine the trophic status and waterquality status of lakes, in-lake phosphorus concentrations are often the determining factor.Trophic status is a useful means of describing the water quality of a lake since it defines theexpected productivity and biotic composition of the system. While many factors influence theoverall trophic status of a lake, the interaction of climate, watershed characteristics (e.g., soils),and human influences are the most dominant (Figure 2.21).Ann Arbor-Ypsilanti Metropolitan Area 2-44<strong>Watershed</strong> <strong>Management</strong> <strong>Plan</strong>
Figure 2.21: Illustrative Schematic of Phosphorus Load Determinants and Lake Response. 34Climate<strong>Watershed</strong> Characteristics Phosphorus Lake Structure &(e.g., soils, geology) Load HydrologyHuman Influence(e.g., land use, fertilizer use)Algae & Aquatic <strong>Plan</strong>tsWater ClarityIn-lake Phosphorus ConcentrationDissolved OxygenFish PopulationGenerally, a lake with concentrations of phosphorus less then .01 mg/L will be consideredoligotrophic. A lake will be considered mesotrophic at concentrations of .01 mg/L to .02 mg/Land eutrophic to hypereutrophic at or greater than .02 mg/L or .03 mg/L. 35 Oligotrophic andmesotrophic lakes normally support coldwater fisheries (e.g., trout, some species of bass) andnumerous recreational activities. The water in these lakes is also often suitable for drinkingwater supply. Eutrophic lakes often support warm water fisheries (e.g. bass, bluegill, catfish,carp, etc.) and have a more limited recreational value compared to oligotrophic or mestrophiclakes because of periodic nuisance algal blooms and aquatic macrophyte growth.Hypereutrophic lakes, which experience frequent and intense nuisance algal blooms, do notordinarily support cold or warm water fisheries and offer little or no recreational value. Inaddition, these lakes often exhibit decrease in open water surface areas because of layers ofalgal and aquatic plant masses.Temperate zone lakes, like those in the watershed, experience changes in water chemistry andbiology throughout the year. As winter ice thaws in the spring, winds and temperature changesin surface waters cause mixing within the water column. The result is water with temperature,dissolved oxygen, and other variables that are essentially equal at all depths This event is oftenreferred to as a spring turnover. In the summer months, warm air temperatures interact withsurface waters causing stratification or layering of lake water due to water temperature anddensity relationships. During this time of thermal stratification, little mixing of lake water occurs.Lakes that receive increased pollutant loading can exhibit quantifiable reductions in waterquality at this time because of the lack of oxygen in the bottom water. As fall approaches, coolerair temperatures increase surface water density and mixing establishes uniformity within thewater column in what is termed as fall turnover. During the winter months, the lake may stratifyagain.Ann Arbor-Ypsilanti Metropolitan Area 2-45<strong>Watershed</strong> <strong>Management</strong> <strong>Plan</strong>
2.4 CREEKSHED REVIEWSIn order to gain a perspective on the past and present general water quality conditions in thewatershed, efforts were made to compile and summarize relevant and readily available existingwater quality data. This effort included, but was not limited to acquisition of studies conductedby state researchers, as well as requests to Advisory Committee members and researchers inthe area.Numerous studies and datasets of relevance were obtained in this process; however, spatialand temporal data may be somewhat limited in certain areas, especially for areas of thewatershed drained by minor tributaries. Due to these limitations, the following narrative shouldbe considered a snapshot of water quality in the watershed rather than a comprehensive review.This <strong>Watershed</strong> <strong>Management</strong> <strong>Plan</strong> focuses on the sources and distribution patterns of nonpointsource pollution throughout the watershed. Therefore, rather than attempting to present data onthe many lakes throughout the watershed, emphasis was placed on water quality conditions inthe <strong>Huron</strong> <strong>River</strong>, its major tributaries, and directly connected major lakes and impoundments.Because the large size of the watershed, an effort was made to categorize the analysis basedon drainage areas in the watershed. Eleven hydrologically distinct drainage areas, orcreeksheds, were delineated and their water quality summaries are reviewed below.2.4.1 <strong>Huron</strong> <strong>River</strong> Direct DrainageWater Quality ConditionsThe MDEQ has collected annual water quality dataat monthly intervals for two sites on the <strong>Huron</strong> <strong>River</strong>upstream of Ford and Bellville Lakes to determinethe progress toward meeting the phosphorus goalestablished for the lakes’ TMDL. Total phosphorusconcentrations cannot exceed 50 µg/L in the <strong>Huron</strong><strong>River</strong>, just upstream of Ford Lake, in order to meetthe goal of 30 µg/L for total phosphorus in BellevilleLake. Data was collected from April to Septemberduring the years 1994-1999, 2001-2003, and 2004-2006 at a site located at Bandemer Park,just downstream from Barton Pond and another site located ten miles downstream at MichiganAvenue where the <strong>Huron</strong> empties into Ford Lake.Total phosphorus concentrations at the Bandemer Park station remained at or below 40 µg/Lover the years of monitoring, with a few exceptions when spikes were observed in August 1996and July 1998. The Michigan Avenue station exhibited higher total phosphorus concentrationscompared to the Bandemer Park station over the years of monitoring. The target phosphorusTMDL goal of 50 µg/L was exceeded on most sampling dates each year of monitoring.However, at both stations, no clear trends in phosphorus concentration can be identified when36, 37, 38, 39, 40, 41compared to historical data.The Middle <strong>Huron</strong> Stream Monitoring Program has collected water quality data on the <strong>Huron</strong><strong>River</strong> as it passes into the Hudson Mills Metropark at North Territorial Road annually from Mayto September since 2003. Measurements include total phosphorus, total suspended solids,Ann Arbor-Ypsilanti Metropolitan Area 2-46<strong>Watershed</strong> <strong>Management</strong> <strong>Plan</strong>
conductivity, pH, and dissolved oxygen. 42 Results from this program for conductivity, pH anddissolved oxygen are described in section 2.3.1. Phosphorus loading curves have beendeveloped for all ten sites in the program. Figure 2.22 shows the curve for the <strong>Huron</strong> <strong>River</strong> siteat North Territorial Road. The slope of the loading curve is an indication of the storm flow effecton the overall loading to the measurement site. In the case of the <strong>Huron</strong> <strong>River</strong> site, the lowrelative slope (when compared to other sites) indicates that the phosphorus load does notchange much as the discharge (flow) increases,. The constancy of the water’s phosphorusconcentration indicates that less of the overall load may originate from stormwater runoff, incomparison to tributary sites. Total suspended solids curves have also been developed foreach of the ten sites. These curves and their calculations can be found in Appendix K. Foursites were monitored in 2007 during storm events. This data along with a comparison betweenTP and TSS is being analyzed at the current time as part of the 2007 Middle <strong>Huron</strong> PartnersAnnual Report.<strong>Huron</strong> <strong>River</strong>Total P Load (lbs/day)35030025020015010050y = 0.1398xR 2 = 0.9093samplesLinear (samples)01 10 100 1000 10000Discharge (cfs)Figure 2.22. Instantaneous total phosphorus loading calculations by measured discharge for monthly measuresMay-September 2003-2006 at the <strong>Huron</strong> <strong>River</strong> site at the North Territorial Road crossing.Dr. John Lehman with the University of Michigan is conducting a study on the nutrient dynamicsand algae growth in Ford and Belleville Lakes and the <strong>Huron</strong> <strong>River</strong> upstream. As part of thisstudy, Dr. Lehman and his team sampled twelve sites along the <strong>Huron</strong> <strong>River</strong> and sites in BartonPond and the two lakes. Sampling of these sites occurred between June 2003 and October2005 once or twice weekly in the summer months, weekly in spring and fall, and biweekly inwinter months. Parameters measured at the river sites included several forms of phosphorusand nitrogen, dissolved organic matter, specific conductance and pH. Section 2.5.1 discussessome of Dr. Lehman’s findings regarding phosphorus loading in the system. 43The MDEQ also conducted biological surveys of the <strong>Huron</strong> <strong>River</strong> and its tributaries from July toSeptember of 1997 and 2002. Water quality parameters such as conductivity, Kjeldahl nitrogen,total phosphorus, and total suspended solids were measured in 2002 for the <strong>Huron</strong> <strong>River</strong> atAnn Arbor-Ypsilanti Metropolitan Area 2-47<strong>Watershed</strong> <strong>Management</strong> <strong>Plan</strong>
Forest Street in Ypsilanti. These measurements fell within the range of reference sites for the44, 45region.The <strong>Huron</strong> is monitored at Zeeb Road near Dexter, Island Park in Ann Arbor, and Cross Streetin Ypsilanti by the Adopt-A-Stream program at the <strong>Huron</strong> <strong>River</strong> <strong>Watershed</strong> <strong>Council</strong>. The Adopt-A-Stream Program uses stream water conductivity as an indicator of possible water pollution. Athreshold of 800 µS is used as a guideline, above which water quality degradation may beoccurring. For the three Adopt-a-Stream sites in the Middle <strong>Huron</strong>, the Zeeb Rd. site has anaverage conductivity level of 738 µS, including a reading of 707 µS in April 2007. Lastly, theIsland Park site indicated an average conductivity level of 768 µS with an April 2007 reading of735 µS.The MDEQ collected E. coli data in 2001 and 2002 for Geddes Pond and its tributaries insupport of the development of the Geddes Pond E. coli TMDL. The E. coli water qualitystandard of 130 E. coli per 100 mL as a 30-day geometric mean for Geddes Pond wasexceeded in 2001. The results of routine monitoring conducted from May to October of 2002indicated that Geddes Pond exceeded the water quality standard during the second half of July,all of August, and during one sampling event in September. 46The Washtenaw County Drain Commission (WCDC) coordinated a research project to identifyagents causing high bacterial levels (>10,000 cfu/100 ml) during both wet and dry weather inGeddes Pond. Sampling took place at Sheridan Road and Buckingham Road. Researchersemployed library-based genotypic bacteria source tracking (BST) to match bacterial strands withspecific species. Storm sewer samples validated 2003 data, indicated seasonal differences(Spring had greater levels than Fall), and displayed climatic differences (wet weather hadgreater levels than dry weather). BST analysis indicated that the primary culprits were raccoonsand pets – cats to a greater extent than dogs. Unknown bacterial strands may be attributed torats or deer. The WCDC will be addressing these issues by improving public education on feralcats, promoting best household practices for trash containment, and creating a dog park.Efforts to reach TMDL levels will not be realized despite these measures. 47Freshwater Biological CommunitiesThe <strong>Huron</strong> is monitored at Zeeb Road near Dexter, Island Park in Ann Arbor, and Cross Streetin Ypsilanti by the Adopt-A-Stream program. The ecological condition of these sites over thepast five years (2001-2005), as determined by a combination of biological and physical data,has been rated as excellent, fair, and poor respectively. The biological data include the diversityof insect families, the number of insects of the orders Ephemeroptera (mayflies), Plecoptera(stoneflies), and Trichoptera (caddisflies), and the number of sensitive insect families. Thephysical data include water conductivity and habitat assessment information.The aquatic invertebrate communities at these sites have been stable over the past five years(2001-2005). During the Fall 2005 search, twenty different insect families were found at theZeeb Road site of which eight were mayflies, stoneflies, or caddisflies compared to only nineinsect families found at the Cross Street site, of which four were mayflies, stoneflies, orcaddisflies. Winter stoneflies, which indicate good stream quality, have always been found atthese sites when they were searched in the winters of 2002-2006. The only exception was the2006 search at Cross Street during which no stoneflies were found. 48The 2002 MDEQ <strong>Huron</strong> <strong>River</strong> Survey also found the macroinvertebrate community at ZeebRoad to be of excellent condition. The macroinvertebrate community at Forest Street inYpsilanti was rated as excellent in 1997 but dropped to acceptable in 2002. 49Ann Arbor-Ypsilanti Metropolitan Area 2-48<strong>Watershed</strong> <strong>Management</strong> <strong>Plan</strong>
Limno-Tech, Inc. conducted a survey of aquatic macrophytes on Barton, Argo, Geddes, andSouth Ponds in 2006. Areas of dense vegetation have been noted by residents and staff of theCity of Ann Arbor and have interfered with recreational use of the impoundments, degradedaesthetic value, and disrupted the City of Ann Arbor water intake and treatment operations onBarton Pond. Over 600 sites in total on the four impoundments were surveyed over a two weekperiod in September. Each species was recorded as well as its density, distribution, andrelative height in the water column. These data were used to analyze percent occurrence ofeach species, community biodiversity, and community quality.The data suggest that the total number of species observed in each of the ponds is similar toconditions that would be expected in an impoundment. However, these totals are lower thanwould be expected in a relatively undisturbed lake system in southeast Michigan. Moreover, thebiodiversity scores are indicative of disturbed conditions, meaning that the plant communitiesare in an unstable state. Such a state can allow for the establishment and proliferation ofinvasive species and a variety of nuisance conditions.The most commonly observed density patterns of macrophytes in the impoundments were“common” and “present”. These patterns indicate that most of the plant species are capable ofinhabiting many areas of the pond as opposed to narrowly defined habitats in which rarespecies would be found. Additionally, the mixtures of distribution types observed during thesurvey are representative of systems with fairly good habitat complexity.Overall, the plant communities surveyed are indicative of disturbed conditions with apredominance of opportunistic species such as Eurasian watermilfoil and coontail. Density anddistribution observations indicate moderately good habitat structure complexity in each of thesystems.The results of the aquatic macrophyte survey were used to develop a preliminary review ofaquatic plant management alternatives for each of the impoundments. The main objectives foraquatic plant management are to reduce nuisance plant growth in order to minimize or eliminateinterference with recreational use and improve aesthetics, prevent disruption of City of AnnArbor water intake and treatment operations on Barton Pond, and support economical,ecologically-protective, and sustainable management of the impoundments. The managementalternatives that were considered potentially feasible for each impoundment are as follows:• Barton Pond: harvesting operations, dredging, and water level drawdown;• Argo Pond: harvesting operations, selective control using herbicides, dredging;• Geddes Pond: harvesting operations, selective control using herbicides, dredging; and• South Pond: harvesting operations, selective control using herbicides, dredging. 50As part of the Department of Natural Resources (DNR) Water Survey of the <strong>Huron</strong> <strong>River</strong>, ArgoPond, Geddes Pond, and Barton Pond were each sampled for their fish populations. From May3-5, 2000, DNR researchers trapped fish two consecutive nights on the 86.5 acre impoundmentof Agro Pond. Four trap nets at five locations were used. Eighteen different species of panfish,large gamefish, rough fish and others were caught. Panfish were in the greatest abundance,with blue gills totaling 23.8 fish per net lift. Bluegills yielded a 2.75 Schneider Index rating,which put their population levels as poor to acceptable. The "Schneider Index" uses size scoresof length frequency and growth data and relates them to an adjective ranking system rangingfrom "very poor" to "superior" 51 . Also, rockbass yielded a higher count than in past years. Ofthe large gamefish, channel catfish were the most abundant, with poor showings of largemouthbass and walleye. No northern pike were observed, but no deep water sampling took placeAnn Arbor-Ypsilanti Metropolitan Area 2-49<strong>Watershed</strong> <strong>Management</strong> <strong>Plan</strong>
either. Suckers, white and shorthead redhorse, dominated the rough fish category. The DNRrecommended that channel catfish yearling stockings continue, and that Argo dam be removedto create better habitat for smallmouth bass and restore riverine mussel populations. 52The Geddes Pond study took place on June 20, 1996. Unfortunately, heavy rain conditions andonly one testing day hindered fish trappings for the 261 acre impoundment. Trapping took placeat four different locations using trap nets. Since 1980, Geddes Pond has been stocked withtiger muskellunge, largemouth bass, and, most recently, channel catfish. Channel catfish arerelatively old and large in size, because they were stocked from 1987 to 1991. However, limitedreproduction has led to homogeneity in fish age, with few small catfish. The DNR hasrecommended future stockings of channel catfish. The pond also has a large number of carp,which accounted for 40% of the catch by weight. Anglers use the pond in the Spring, Summerand Fall to catch smallmouth bass, largemouth bass, black crappie, channel catfish, and carp. 53The Barton Pond study was conducted from June 18-19, 1996. The surrounding land remainslargely undeveloped, with meadow and woods as the predominant habitat. Testing of the 302acre impoundment took place at four different locations along the river using trap nets. Carpand white and redhorse suckers accounted for 75% of the catch by weight. Two channel catfishand seven walleye were also caught. Anglers typically fish by boat and target walleye,largemouth and smallmouth bass, crappie and channel catfish. Timing, duration of study andweather hindered the monitoring at this site. 54Table 2.6. Ecological Conditions and Aquatic Insect Families at HRWC Adopt-A-StreamProgram Monitoring Sites in the <strong>Huron</strong> <strong>River</strong> Direct Drainage 55Study SiteEcologicalConditions*PopulationDiversityAvg. InsectFamiliesAvg. EPTFamiliesZeeb Road Excellent Stable 20 8 1Island Park Fair Stable 11 5 1Cross Street Poor Stable 9 4 0* categories: excellent, good, fair, and poorAvg.SensitiveFamiliesWinterStoneflyPresent 4yearsPresent 3yearsPresent 2yearsAdditional DataThe MDEQ collected qualitative habitat data including substrate and instream cover, channelmorphology, and riparian and bank structure for two sites on the <strong>Huron</strong> <strong>River</strong> during the 2002survey. Habitat condition was rated as excellent at Zeeb Rd. due to high epifaunal substrateavailability and cover and little sediment deposition or embeddedness. Habitat condition atForest Street was considered slightly impaired due to low availability of epifaunal substrate,bank instability, and high stream flashiness. 56A feasibility study was conducted in 2002 by Barr Engineering, Co. for the removal of Argo Damon the <strong>Huron</strong> <strong>River</strong> in Ann Arbor 57 . The study sought to identify whether significantcontaminated sediment or soil exists in Argo Pond and to obtain a rough estimate of themagnitude of the volume of sediments at the pond site. Sediment samples were collected fromthree representative sites within the pond and were analyzed for concentrations of nutrients,pesticides, and metals. A series of soundings at 15 sections throughout the pond wasperformed to obtain a rough estimation of volumes and locations of sediments in the pond.Ann Arbor-Ypsilanti Metropolitan Area 2-50<strong>Watershed</strong> <strong>Management</strong> <strong>Plan</strong>
Results indicated that the sediments do not appear to be significantly contaminated and thatthey may be acceptable as vegetated soils at the surface if Argo Pond were to be drained. Thestudy also found that there are approximately 184,000 CY of sediment deposited in the pond.The City of Ann Arbor conducted a series of tests in 2004 to explore the occurrence andremoval of pharmaceuticals, personal care products, and endocrine disrupting compoundsthrough the Ann Arbor Water Treatment <strong>Plan</strong>t. Researchers compared samples of source waterto finished drinking water and wastewater influent to treated wastewater effluent. Samples weredrawn in February, April, June and August 2004 for each of the four sites. Samples were testedfor antibiotics, analgesics, antiepileptics, sterols and hormones and miscellaneous compounds,totaling 22 compounds. Results indicated that the water treatment process reduced the numberof compounds in source water to drinking water from 10 to 4, respectively. Additionally, of the 4remaining compounds, each were reduced a minimum of 23%. 17 compounds in thewastewater influent were reduced to 15 compounds in the treated wastewater effluent, with areduction of 90% for 10 of the 15 remaining compounds. 582.4.2 Allens CreekWater Quality ConditionsThe Middle <strong>Huron</strong> Stream Monitoring Program hascollected water quality data for Allens Creek at itsoutfall to the <strong>Huron</strong> <strong>River</strong> annually from May toSeptember since 2003. Measurements include totalphosphorus load, total suspended solids,conductivity, pH, and dissolved oxygen. 59 Resultsfrom this program for conductivity, pH and dissolvedoxygen are described in section 2.3.1. Phosphorusloading curves have been developed for all ten sitesin the program. Figure 2.23 shows the curve for theAllens Creek site at its outlet to the <strong>Huron</strong> <strong>River</strong>. The slope of the loading curve is an indicationof the storm flow effect on the overall loading to the measurement site. In the case of the AllensCreek site, the low slope seems to indicate that, while the instantaneous TP load increases asthe discharge increases, the phosphorus concentration does not change much. However, as ofthe time of this analysis, no high flow measurements had been calculated. Allens Creek wasmonitored during storm events during July through September 2007. Those results are in theprocess of being analyzed. Total suspended solids curves have also been developed for eachof the ten sites. These curves and their calculations can be found in Appendix K. This dataalong with a comparison between TP and TSS is being analyzed at the current time as part ofthe 2007 Middle <strong>Huron</strong> Partners Annual Report.Ann Arbor-Ypsilanti Metropolitan Area 2-51<strong>Watershed</strong> <strong>Management</strong> <strong>Plan</strong>
Allens CreekTotal P Load (lbs/day)12108642y = 0.2816xR 2 = 0.8375SamplesLinear (Samples)01 10 100Discharge (cfs)Figure 2.23. Instantaneous total phosphorus loading calculations by measured discharge for monthly measuresMay-September 2003-2006 at the Allens Creek site at its outlet to the <strong>Huron</strong> <strong>River</strong>.The MDEQ collected E. coli data in 2001 and 2002 for Geddes Pond and its tributaries insupport of the development of the Geddes Pond E. coli TMDL. Water quality standards of 300E. coli per 100 mL in Allens Creek were exceeded in 2001 and remained elevated in 2002.There was also visual evidence of illicit connections in Allens Creek. Additional E. coli samplingin 2006 for the Middle <strong>Huron</strong> Stream Monitoring Program demonstrated that E. coli againexceeded the water quality standard each month from June through September, ranging from2000 to 7200 E. coli per 100 mL. 60In 2005 and 2006, the Washtenaw County Drain Commissioner’s office made rain gardenassistance grants available to Allens Creek residents through State Non-Point Source Pollutionfunding. Grants provided interested homeowners with rain garden design plans. Over thecourse of the two year program, nineteen homeowners installed rain gardens in their yards. Asa result, an estimated 25,000 gallons of rainfall will flow into and through the created raingardens during each 1 inch rain event. 61Further information about Allens Creek can be found in the Allens Creek <strong>Watershed</strong> <strong>Plan</strong> inAppendix I.2.4.3 Boyden CreekWater Quality ConditionsVery little water quality data has been collected forthe Boyden Creekshed other than data collectedby the Loch Alpine Sanitary Authority from theirAnn Arbor-Ypsilanti Metropolitan Area 2-52<strong>Watershed</strong> <strong>Management</strong> <strong>Plan</strong>
intake and outfall. That data had not been obtained by the date of this publication.The Adopt-A-Stream Program uses a stream water conductivity threshold of 800 µS as aguideline for water pollution, above which water quality degradation may be occurring. InBoyden Creek, there are Delhi and the Golf Course. At Delhi, the average conductivity level is701 µS. Also, an April 2007 measurement indicated a conductivity level of 641 µS. At the GolfCourse site, average conductivity levels are measured at 772 µS with levels of 704 µS in April2007.Freshwater Biological CommunitiesBoyden Creek is monitored at North Delhi Road, Loch Alpine Golf Course, and <strong>Huron</strong> <strong>River</strong>Drive by the Adopt-A-Stream Program. The ecological condition of these sites over the past fiveyears (2001-2005) as determined by a combination of biological and physical data has beenrated as fair at the North Delhi Road and golf course sites and poor at the <strong>Huron</strong> <strong>River</strong> Drivesite. The aquatic invertebrate communities at all three sites have been stable over the past fiveyears (2001-2005). Winter stoneflies have always been found at the North Delhi Road and golfcourse sites when they were searched in the winters of 2002-2006 but have never been foundat the <strong>Huron</strong> <strong>River</strong> Drive site. 62Table 2.7. Ecological Conditions and Aquatic Insect Families at HRWC Adopt-A-StreamProgram Monitoring Sites in the Boyden Creekshed 63Study SiteEcologicalConditions*PopulationDiversityAvg. InsectFamiliesAvg. EPTFamiliesAvg.SensitiveFamiliesWinterStoneflyDelhi Fair Stable 13 4 0Present 3yearsGolf Course Fair Stable 6 3 0Present all 5years<strong>Huron</strong> <strong>River</strong>DrPoor Stable 11 4 1 None* categories: excellent, good, fair, and poor2.4.4 Fleming CreekWater Quality ConditionsThe Middle <strong>Huron</strong> Stream Monitoring Program hascollected water quality data for Fleming Creek atParker Mill County Park annually from May toSeptember since 2003. Measurements includetotal phosphorus load, total suspended solids,conductivity, pH, and dissolved oxygen. 64 Resultsfrom this program for conductivity, pH anddissolved oxygen are described in section 2.3.1.Phosphorus loading curves have been developed for all ten sites in the program. Figure 2.24shows the curve for the Fleming Creek site at Parker Mill. The slope of the loading curve is anindication of the storm flow effect on the overall loading to the measurement site. Compared tothe other sites, the load curve for Fleming Creek has a moderate slope. This indicates thatsome amount of the overall load is originating from stormwater runoff, when compared totributary sites, but it does not have extreme storm loading. The scatter in the Fleming Creekdata also indicate that there may be some other non-runoff sources of phosphorus. FlemingAnn Arbor-Ypsilanti Metropolitan Area 2-53<strong>Watershed</strong> <strong>Management</strong> <strong>Plan</strong>
Creek also has the third highest median phosphorus load of the nine tributary sites. Totalsuspended solids curves have also been developed for each of the ten sites. These curves andtheir calculations can be found in Appendix K. This data along with a comparison between TPand TSS is being analyzed at the current time as part of the 2007 Middle <strong>Huron</strong> Partners AnnualReport.The Adopt-A-Stream Program at the <strong>Huron</strong> <strong>Watershed</strong> <strong>Council</strong> uses stream water conductivityas an indicator of possible water pollution. A threshold of 800 µS is used as a guideline, abovewhich water quality degradation may be occurring. Conductivity at the Warren Road site hasnever exceeded this threshold. Conductivity at Galpin Road and the Botanical Gardens haveoccasionally exceeded the threshold slightly, but it averages less than 800 µS. Radrick Farmsand Geddes Road, which are quite close together, tend to hover around the threshold level.Trend analysis indicates that average conductivity values in Fleming Creek over time are notchanging.Fleming CreekTotal P Load (lbs/day)70605040302010y = 0.3927xR 2 = 0.7209SamplesLinear (Samples)01 10 100 1000Discharge (cfs)Figure 2.24. Instantaneous total phosphorus loading calculations by measured discharge for monthly measuresMay-September 2003-2006 at the Fleming Creek site at Parker Mill.The MDEQ conducted a biological survey of the <strong>Huron</strong> <strong>River</strong> and its tributaries from July toSeptember of 1997 and 2002. Water quality parameters such as conductivity, Kjeldahl nitrogen,total phosphorus, and total suspended solids were measured in 2002 for Fleming Creek at a sitein the Matthei Botanical Gardens. These measurements fell within the range of reference sitesfor the region. 65Freshwater Biological CommunitiesFleming Creek is monitored in the Matthei Botanical Gardens and Radrick Farms Golf Courseand at Geddes Road and Warren Road by the Adopt-A-Stream program. A new site has alsobeen added at Galpin Road but too few samples have been collected to detect any trends inecological condition or aquatic invertebrate communities. See Table 2.8 for results.Ann Arbor-Ypsilanti Metropolitan Area 2-54<strong>Watershed</strong> <strong>Management</strong> <strong>Plan</strong>
The ecological condition of the sites over the past five years (2001-2005) as determined by acombination of biological and physical habitat data has been rated as good at the BotanicalGardens and Warren Road sites and fair at the Geddes Road and Radrick Farms sites. The“good” rating at the Botanical Gardens site is an improvement from a previous rating of “fair”.The improvement is attributed to the establishment of riparian vegetation along the streamwhich stabilizes the channel somewhat and provides additional cover and shade.Although the aquatic invertebrate communities at the Geddes and Warren Roads sites haveremained stable over the past five years (2001-2005), the golf course site has exhibited asignificant decline in both insect and sensitive family diversity. In comparison with the 14 kindsof aquatic insects and two sensitive families found during the Fall 2005 search at the WarrenRoad site, only six kinds of insects and no sensitive families were found at the golf course site.However, winter stoneflies have always been found at all five sites when they were searched inthe winters of 2002-2006. 66Table 2.8. Ecological Conditions and Aquatic Insect Families at HRWC Adopt-A-StreamProgram Monitoring Sites in the Fleming Creekshed 67Ecological Population Avg. Insect Avg. EPT Avg. SensitiveStudy SiteWinter StoneflyConditions* Diversity Families Families FamiliesBotanicalGardensGood NA 13 6 1Galpin Road NA NA 14 4 0GeddesRoadRadrickFarmsFair Stable 10 4 0Fair Declining 6 3 0Warren Road Good Stable 14 8 2* categories: excellent, good, fair, and poorPresentall 3 yearsPresentall 2 yearsPresentall 4 yearsPresentall 1 yearsPresentall 4 yearsThe 1997 and 2002 MDEQ <strong>Huron</strong> <strong>River</strong> Surveys also found the macroinvertebrate community inFleming Creek at the Matthei Botanical Gardens and Geddes Road to be in acceptable68, 69condition.Additional DataThe MDEQ collected qualitative habitat data including substrate and instream cover, channelmorphology, and riparian and bank structure for two sites on Fleming Creek during the 2002survey. Habitat condition was rated as slightly impaired at both the Matthei Botanical Gardensand Geddes Road due to low availability of epifaunal substrate, bank instability, and high streamflashiness. 70The Fleming Creek <strong>Plan</strong> indicates that sediment is a threat to the macroinvertebrate communityin Fleming Creek. Excepting the west branch, which is of high quality, all other branches of thestream have only slightly above average macroinvertebrate populations.HRWC’s Adopt-a_Stream program also conducted a flow study of Fleming Creek through 2007.The results of that study have been compiled and show Fleming Creek to express hydrologyAnn Arbor-Ypsilanti Metropolitan Area 2-55<strong>Watershed</strong> <strong>Management</strong> <strong>Plan</strong>
that is consistent with an undeveloped watershed. Peak flows are slow to emerge and thereturn to base flow is slow. Base flow levels are also reasonable for a creekshed of its size.Figure 2.25 illustrates the Fleming Creek (at the Galpin monitoring station) response to a stormevent in comparison to the response of neighboring Millers Creek (a highly developed anddegraded creek). Millers Creek shows the flashy response typical of degraded streams withhigh amounts of imperviousness in the creekshed. Fleming, on the other hand, shows a morenatural flow response, with longer response times and larger baseflow, more typical of a streamwith more input from groundwater.July 27-29 2004 Rain EventDischarge (cfs)25208070601550401030520100012:00 0:00 12:00 0:00 12:00Time of DayMillers Creek - PlymouthFleming Creek - GalpinFigure 2.25 Graph showing the flow response of Fleming and Millers Creeks to a single rain event. Millers Creekscale is on the left and Fleming Creek on the right.2.4.5 Honey CreekWater Quality ConditionsThe Middle <strong>Huron</strong> Stream Monitoring Program hascollected water quality data for Honey Creek atWagner Road annually from May to Septembersince 2003. Measurements include totalphosphorus load, total suspended solids,conductivity, pH, and dissolved oxygen. 71 Resultsfrom this program for conductivity, pH and dissolvedoxygen are described in section 2.3.1. Figure 2.26shows the phosphorus loading curve for the HoneyCreek site at Wagner Road. The slope of the loading curve is an indication of the storm floweffect on the overall loading to the measurement site. In the case of the Honey Creek site, thehigher than average slope indicates that the TP load increases significantly as the dischargeincreases. This indicates that a significant portion of the overall load from Honey Creek isoriginating from stormwater runoff, when compared to tributary sites. Total suspended solidsAnn Arbor-Ypsilanti Metropolitan Area 2-56<strong>Watershed</strong> <strong>Management</strong> <strong>Plan</strong>
curves have also been developed for each of the ten sites. These curves and their calculationscan be found in Appendix K. This data along with a comparison between TP and TSS is beinganalyzed at the current time as part of the 2007 Middle <strong>Huron</strong> Partners Annual Report.Honey CreekTotal P Load (lbs/day)70605040302010y = 0.7997xR 2 = 0.7272SamplesLinear (Samples)01 10 100Discharge (cfs)Figure 2.26. Instantaneous total phosphorus loading calculations by measured discharge for monthly measuresMay-September 2003-2006 at the Honey Creek site at Wagner Road.The Adopt-A-Stream Program at the <strong>Huron</strong> <strong>Watershed</strong> <strong>Council</strong> uses a stream waterconductivity threshold of 800 µS as an indicator of possible water pollution, above which waterquality degradation may be occurring. Honey Creek is monitored at Jackson Road, Pratt Road,and Wagner Road by the Adopt-A-Stream program. At Jackson Road, the average conductivitylevel is 788 µS. In April 2007, conductivity levels were measured at 772 µS at this site. Theaverage conductivity at Pratt Road is 1085 µS, with April 2007 levels at 987 µS. The WagnerRoad site has a conductivity average of 1135 µS with an April 2007 level of 1032.The MDEQ conducted a biological survey of the <strong>Huron</strong> <strong>River</strong> and its tributaries from July toSeptember of 1997 and 2002. Water quality parameters such as conductivity, Kjeldahl nitrogen,total phosphorus, and total suspended solids were measured in 2002 for Honey Creek at <strong>Huron</strong><strong>River</strong> Drive. These measurements fell within the range of reference sites for the region. 72, 73 In2008, MDEQ will be collecting E. coli data from three to four locations for development of aTMDL in 2009.Freshwater Biological CommunitiesThe ecological condition of all three Adopt-a-Stream sites over the past five years (2001-2005)as determined by a combination of biological and physical data has been rated as poor. Theaquatic invertebrate communities at the Jackson and Pratt Road sites have been stable over thepast five years (2001-2005). Insect diversity has been steadily increasing over several years ofAnn Arbor-Ypsilanti Metropolitan Area 2-57<strong>Watershed</strong> <strong>Management</strong> <strong>Plan</strong>
sampling at the Wagner Road site. Winter stoneflies have not been found consistently at theJackson or Pratt Road sites when they were searched in the winters of 2002-2006. However,winter stoneflies have always been found at the Wagner Road site when it was searched in2002 and 2004-2006. 74Table 2.9. Ecological Conditions and Aquatic Insect Families at HRWC Adopt-A-StreamProgram Monitoring Sites in the Honey Creekshed 75Study SiteEcologicalConditions*PopulationDiversityAvg. InsectFamiliesAvg. EPTFamiliesJackson Rd Poor Stable 11 3 0Pratt Rd Poor Stable 16 3 0Wagner RdPoor**-DecliningIncreasing 11** 2 2Avg.SensitiveFamiliesWinterStoneflyPresent 3yearsPresent 2yearsPresent 4years* categories: excellent, good, fair, and poor; **statistically significant trends over the past 5 years at 10% level.The 2002 MDEQ <strong>Huron</strong> <strong>River</strong> Survey found that the macroinvertebrate community in HoneyCreek at <strong>Huron</strong> <strong>River</strong> Drive improved from fair condition in 1997 to a good condition in 2002. 76Additional DataThe MDEQ collected qualitative habitat data including substrate and instream cover, channelmorphology, and riparian and bank structure for Honey Creek at <strong>Huron</strong> <strong>River</strong> Drive during the2002 survey. Habitat condition was rated as slightly impaired due to low availability of epifaunalsubstrate, bank instability, and high stream flashiness. 77Groundwater in parts of Washtenaw County, including areas in the City of Ann Arbor and AnnArbor and Scio Townships, is contaminated with the industrial solvent 1,4-dioxane. Most of thiscontamination is within the Honey Creekshed. Gelman Sciences, now Pall Life Sciences (PLS),used 1,4-dioxane in their manufacturing process through the mid-1980s, and the chemicalseeped into and contaminated the groundwater. 78 Monitoring and clean-up activities are ongoingthrough coordination between MDEQ, the City of Ann Arbor and PLS.2.4.6 Malletts CreekWater QualityThe Middle <strong>Huron</strong> Stream Monitoring Program hascollected water quality data for Mallets Creekannually from May to September since 2003.Measurements include total phosphorus load,nitrates and nitrites, total suspended solids,conductivity, pH, and dissolved oxygen. 79 Resultsfrom this program for conductivity, pH anddissolved oxygen are described in section 2.3.1.Phosphorus loading curves have been developed for all ten sites in the program. Totalsuspended solids curves have also been developed for each of the ten sites. These curves andtheir calculations can be found in Appendix K. This data along with a comparison between TPAnn Arbor-Ypsilanti Metropolitan Area 2-58<strong>Watershed</strong> <strong>Management</strong> <strong>Plan</strong>
and TSS is being analyzed at the current time as part of the 2007 Middle <strong>Huron</strong> Partners AnnualReport.The U.S. Geological Survey also maintains a gage station at Chalmers Drive near the mouth ofMalletts Creek. This gage has been in place since 1999. Figure 2.27 shows four separateyears of monthly mean flows along with the 7-year average. On a monthly basis, there is littleconsistent seasonal pattern. However, flows on average are higher in the late spring months,and much lower in late fall to early winter.Malletts Creek Monthly Mean Discharge at Chalmers Rd. (04174518)353025Discharge (cfs)20151050Jan Feb Mar Apr May Jun Jul Aug Sep Oct Nov Dec2000 2002 2003 2004 7‐Yr MeanFigure 2.27. Malletts Creek monthly mean discharge for four selected years along with the 7-year mean.Combining flow and nutrient data (i.e. phosphorus, nitrate/nitrite, and total suspended solids)can yield estimates of loading of these compounds to the main river system. Malletts Creekwas determined to be one of the highest phosphorus-loading tributaries in the Middle <strong>Huron</strong>system (second only to Mill Creek), when a full analysis was conducted in 1996 for thedevelopment of the Ford and Belleville Lakes phosphorus TMDL (see section 2.5.1). Theannual total phosphorus loading at that time was estimated at 3,945 pounds. Figure 2.28 showshow phosphorus loads increase exponentially as the flow increases. The load curve for MallettsCreek shows the highest slope at more than twice that of the next highest tributary. Thisindicates that much of the phosphorus load is flushing out of the Malletts system during largerrain events. When combined with historical discharge data, a seasonal load duration curve canbe plotted (Figure 2.29). This indicates that Malletts Creek exceeds target phosphorus levelsduring high and low flow periods, but the exceedences are greater during high flow and stormconditions. This further suggests loading from nonpoint source runoff.Ann Arbor-Ypsilanti Metropolitan Area 2-59<strong>Watershed</strong> <strong>Management</strong> <strong>Plan</strong>
Malletts CreekTotal P Load (lbs/day)25020015010050y = 2.1603xR 2 = 0.8547SamplesLinear (Samples)01 10 100Discharge (cfs)Figure 2.28. Instantaneous total phosphorus loading calculations by measured discharge for monthly measuresMay-September 2003-2006, and storm samples July-September, 2007 at the Malletts Creek site at the ChalmersRoad crossing.Figure 2.29. Seasonal (April-September) phosphorus load duration curve for Malletts Creek. Target TMDL curveis shown with field measurements by year. Storm samples are circled in red.Ann Arbor-Ypsilanti Metropolitan Area 2-60<strong>Watershed</strong> <strong>Management</strong> <strong>Plan</strong>
Using the sampling data along with the long-term flow data from the gage station, a new loadingestimate was calculated for Malletts Creek for the April to September growing season. This newphosphorus load estimate is 2,863 pounds over the growing season. This suggests a largerannual load than was originally estimated in 1996, and much greater than that calculated fromfield measurements at that time. This estimate is similar to the one calculated for the TMDLstudy in 2001 (see Appendix F). See Appendix K for the load calculation methodology. Notethat the method used was a rough estimate and should be refined and extended to generate amore accurate annual load estimate.The MDEQ conducted a biological survey of the <strong>Huron</strong> <strong>River</strong> and its tributaries from July toSeptember of 1997 and 2002. Water quality parameters such as conductivity, Kjeldahl nitrogen,total phosphorus, and total suspended solids were measured in 2002 for Mallets Creek atChalmers Road and Scheffler Park. These measurements fell within the range of reference80, 81sites for the region.The Adopt-A-Stream Program at the <strong>Huron</strong> <strong>Watershed</strong> <strong>Council</strong> uses a stream waterconductivity threshold of 800 µS as an indicator of possible water pollution, above which waterquality degradation may be occurring. Mallets Creek is monitored at Chalmers Road, 1-94,Main Street, and Scheffler Road by the Adopt-A-Stream program. However, only the MainStreet site has been measured for conductivity. The Main Street site average conductivity levelis 2170 µS, or almost three times the threshold amount. In April 2007, the conductivity levelwas measured at 1929 µS.The MDEQ collected E. coli data in 2001 and 2002 for Geddes Pond and its tributaries insupport of the development of the Geddes Pond E. coli TMDL. Water quality standards of 130E. coli per 100 mL in Mallets Creek were exceeded in 2001 and remained elevated in 2002.Data collected from July through October of 2002 at the Eisenhower Commerce Park siteshowed high spikes in three of the six samples collected. 82Freshwater Biological CommunitiesThe ecological condition of all four Adopt-a-Stream sites over the past five years (2001-2005) asdetermined by a combination of biological and physical data has been rated as poor. Theaquatic invertebrate communities at all four sites have been stable over the past five years(2001-2005). The Fall 2005 search demonstrated that insect diversity and the number ofmayflies, stoneflies, caddisflies, and sensitive species was very low. Additionally, no winterstoneflies were found at any of the sites when they were searched during the winters of 2002-2006. 83The 2002 MDEQ <strong>Huron</strong> <strong>River</strong> Survey found the macroinvertebrate community in Malletts Creekat Scheffler Park to be in acceptable condition. The survey also indicated that themacroinvertebrate community at the Chalmers Road site improved from good condition in 1997to excellent condition in 2002. 84Ann Arbor-Ypsilanti Metropolitan Area 2-61<strong>Watershed</strong> <strong>Management</strong> <strong>Plan</strong>
Table 2.10. Ecological Conditions and Aquatic Insect Families at HRWC Adopt-A-StreamProgram Monitoring Sites in the Malletts Creekshed 85Study SiteEcologicalConditions*PopulationDiversityAvg. InsectFamiliesAvg. EPTFamiliesAvg.SensitiveFamiliesWinterStoneflyChalmers Rd Poor Stable 5 1 0 NoneI-94 Poor Stable 6 1 0 NoneMain St Poor Stable 5 1 0 NoneScheffler Poor Stable 8 2 0 None* categories: excellent, good, fair, and poorAdditional DataThe MDEQ collected qualitative habitat data including substrate and instream cover, channelmorphology, and riparian and bank structure for Malletts Creek at Chalmers Road and SchefflerPark during the 2002 survey. Habitat condition was rated as slightly impaired due to lowavailability of epifaunal substrate, bank instability, and high stream flashiness. 86As part of the Malletts Creek Restoration project, the Washtenaw County Drain Commissionersoffice will be adding natural features to a stormwater pond in Mary Beth Doyle Park. The projectis an attempt to add wildlife habitat, reduce Phosphorous pollution by 34% (25% reduction ofphosphorus load from Malletts Creekshed), and prevent flooding. Construction began July 2006and ended August 2007. 87The Mallett’s Creek Restoration project includes a variety of projects that are at various stagesof completion. Completed projects include implementing the illicit discharge eliminationprogram, continuing USGS stream gage operations, enforcing existing ordinances, continuingpublic education through HRWC, and designing and beginning construction of Mary Beth DoylePark Pond. On-going projects include sampling benthic macroinvertebrate, conducting routinestream maintenance, studying local detention pond systems, monitoring at the pond, andcleaning watershed catch basins. Some projects will not be implemented or have had no actionto date, including sampling for phosphorous, designing effective flood prevention for OakbrookDrive Crossing, investigating 100-year storm flooding problems, designing structural streamrepairs, and increasing residential street sweeping. 88Ann Arbor-Ypsilanti Metropolitan Area 2-62<strong>Watershed</strong> <strong>Management</strong> <strong>Plan</strong>
2.4.7 Millers CreekWater QualityThe Middle <strong>Huron</strong> Stream Monitoring Program hascollected water quality data for Millers Creekannually from May to September since 2003.Measurements include total phosphorus load, totalsuspended solids, conductivity, pH, and dissolvedoxygen. 89 Results from this program forconductivity, pH and dissolved oxygen are describedin section 2.3.1. Phosphorus loading curves havebeen developed for all ten sites in the program.Figure 2.30 shows the curve for the Millers Creek site at “the Meadows”. Data collection fromthis site was discontinued after 2005, due to private property access restrictions. The slope ofthe loading curve is an indication of the storm flow effect on the overall loading to themeasurement site. In the case of the Millers Creek site, all measurements were taken in lowflow conditions, so no conclusions about storm loading can be drawn. Total suspended solidscurves have also been developed for each of the ten sites. These curves and their calculationscan be found in Appendix K. This data along with a comparison between TP and TSS is beinganalyzed at the current time as part of the 2007 Middle <strong>Huron</strong> Partners Annual Report.Millers CreekTotal P Load (lbs/day)1.210.80.60.40.2y = 0.2701xR 2 = 0.3845SamplesLinear (Samples)0.01 0.1 1 10Discharge (cfs)0Figure 2.30. Instantaneous total phosphorus loading calculations by measured discharge for monthly measuresMay-September 2003-2005 at the Millers Creek site at “the Meadows”.The Adopt-A-Stream Program at the <strong>Huron</strong> <strong>Watershed</strong> <strong>Council</strong> uses a stream waterconductivity threshold of 800 µS as an indicator of possible water pollution, above which waterquality degradation may be occurring. Millers Creek is monitored at nine sites, by the Adopt-A-Stream program. The average conductivity at these sites ranges from 716 µS at Green Road to4081 µS at Baxter Road, or over five times the threshold amount. All but the Green Road siteAnn Arbor-Ypsilanti Metropolitan Area 2-63<strong>Watershed</strong> <strong>Management</strong> <strong>Plan</strong>
averaged over the threshold amount. This suggests that ion (i.e. salt) contamination in MillersCreek is impairing wildlife.The MDEQ collected E. coli data in 2001 and 2002 for Geddes Pond and its tributaries insupport of the development of the Geddes Pond E. coli TMDL. Water quality standards of 130E. coli per 100 mL in Millers Creek were exceeded in 2001 and remained elevated in 2002.Concentrations in 2002 at the east and west branches of Millers Creek at Plymouth Road werehigher than concentrations at other locations. 90Freshwater Biological CommunitiesMillers Creek is monitored at eight sites by the Adopt-A-Stream program: the east branch atBaxter Road, Glazier Way, the Green Road tributary, Hubbard Road, <strong>Huron</strong> Parkway, theLakehaven Court tributary, Meadows Road, and the west branch at Plymouth Road. Theecological condition of all eight sites over the past five years (2001-2005) as determined by acombination of biological and physical data has been rated as poor. The aquatic invertebratecommunities at six of the sites have been stable over the past five years (2001-2005).However, the number of insect families is declining at the Meadows Road site and the numberof mayflies, stoneflies, and caddisflies is declining at the Glazier Way site. Additionally, winterstoneflies were only found at three of the sites when they were searched during the winters of2002-2006: Glazier Way in 2002, the Green Road tributary from 2003-2006, and the LakehavenCourt tributary in 2006. 91Table 2.11. Ecological Conditions and Aquatic Insect Families at HRWC Adopt-A-StreamProgram Monitoring Sites in the Millers Creekshed 92Study SiteEcologicalConditions*PopulationDiversityAvg. InsectFamiliesAvg. EPTFamiliesGlazier Way Poor Declining 9 1** 0Plymouth Rd(W Branch)Baxter Rd(E Branch)Lakehaven Ct(Tributary)Green Rd(Tributary)Avg.SensitiveFamiliesWinterStoneflyPresent1 yearPoor Stable 3 0 0 NonePoor Stable 8 1 1 NonePoor Stable 9 1 0Poor Stable 4 2 1Present1 yearPresentall 4 years<strong>Huron</strong> Pkwy Poor Stable 9 1 0 NoneHubbard Poor Stable 9 2 0 NoneMeadows Poor Declining 4** 1 0 None* categories: excellent, good, fair, and poor; **statistically significant trends over the past 5 years at 10% level.Additional DataMillers Creek Action Team, a unique public and private sector partnership, managed acomprehensive study of the Millers Creek watershed and development of a 10-year MillersCreek <strong>Watershed</strong> Improvement <strong>Plan</strong> (MCWIP), a project that was funded by Pfizer, Inc. TheMCWIP was approved by MDEQ for inclusion in the overall <strong>Huron</strong> <strong>River</strong> watershedimprovement plan.Ann Arbor-Ypsilanti Metropolitan Area 2-64<strong>Watershed</strong> <strong>Management</strong> <strong>Plan</strong>
MCAT began implementation of the MCWIP in 2004 and has made progress on manywatershed improvement activities. Ann Arbor public schools received a grant to implementstormwater improvements at Thurston Pond and the <strong>Huron</strong> <strong>River</strong> <strong>Watershed</strong> <strong>Council</strong> received agrant that will be used in 2007 and 2008 to educate the public on residential storm watermanagement. Other successes include the first annual Millers Creek film festival, meetings withlocal landowners and property managers, tree planting and turf-grass conversion projects,repairs to an exposed sanitary sewer pipe, and public education.Several projects and activities are currently being planned for the watershed. These projectsinclude completion of stormwater improvements to Thurston Pond, construction of stream bankimprovements between Hubbard Road and Glazier Way in Spring 2008 by the City of AnnArbor, and implementation of several public involvement projects including the 2008 FilmFestival, a rain barrel program, and promoting more citizen involvement within MCAT. MCAT isalso working to determine the feasibility of creating a Millers Creek drainage district (a countydrain) to provide a more stable funding source for creek maintenance activities. 93HRWC has also conducted a flow study of Millers Creek at a number of locations. A summaryof these results was presented in section 2.4.4 and figure 2.25. They show that Millers Creek isa highly flashy creek, with rapid spikes in discharge during rain events that quickly dissipate tobaseflow (or no flow). The high peak flows and low base flows likely have lead to the observederosion of the stream channels and low amount of aquatic diversity.2.4.8 Swift RunWater QualityThe Middle <strong>Huron</strong> Stream Monitoring Program hascollected water quality data for Swift Run from Mayto September since 2003. Measurements includetotal phosphorus load, total suspended solids,conductivity, pH, and dissolved oxygen. 94 Resultsfrom this program for conductivity, pH anddissolved oxygen are described in section 2.3.1.Phosphorus loading curves have been developedfor all ten sites in the program. Figure 2.31 showsthe curve for the Swift Run site at Shetland Road. The slope of the loading curve is anindication of the storm flow effect on the overall loading to the measurement site. In the case ofthe Swift Run site, the higher than average slope indicates that, the TP load increasessignificantly as the discharge increases. Swift Run had the second highest slope of the ninetributary sites. This indicates that a significant portion of the overall load from Swift Run isoriginating from stormwater runoff, when compared to tributary sites. Additional storm sampleswere taken July-September 2007. These data are in the process of being analyzed and will beimprove the reliability of the slope calculation. Total suspended solids curves have also beendeveloped for each of the ten sites. These curves and their calculations can be found inAppendix K. This data along with a comparison between TP and TSS is being analyzed at thecurrent time as part of the 2007 Middle <strong>Huron</strong> Partners Annual Report.Ann Arbor-Ypsilanti Metropolitan Area 2-65<strong>Watershed</strong> <strong>Management</strong> <strong>Plan</strong>
Swift RunTotal P Load (lbs/day)16141210864200.01 0.1 1 10 100y = 0.9402xR 2 = 0.9903SamplesLinear (Samples)Discharge (cfs)Figure 2.31. Instantaneous total phosphorus loading calculations by measured discharge for monthly measuresMay-September 2003-2006 at the Swift Run site at the Shetland Road crossing.The MDEQ collected E. coli data in 2001 and 2002 for Geddes Pond and its tributaries insupport of the development of the Geddes Pond E. coli TMDL. Water quality standards of 130E. coli per 100 mL in Swift Run were exceeded in 2001 and remained elevated in 2002.Sampling in the early portion of the 2002 monitoring season indicated elevated concentrationsat various locations while the last four weeks of the season were dry or stagnant. 95The Adopt-A-Stream Program at the <strong>Huron</strong> <strong>Watershed</strong> <strong>Council</strong> uses stream water conductivityas an indicator of possible water pollution. A threshold of 800 µS is used as a guideline, abovewhich water quality degradation may be occurring. At the Swift Run site, the averageconductivity level is 1688 µS, more than double the threshold level. Samples taken in April2007 indicated a conductivity level of 1590 µS.Freshwater Biological CommunitiesSwift Run is monitored at one site on Shetland Drive by the Adopt-A-Stream program. Theecological condition of the site over the past five years (2001-2005) as determined by acombination of biological and physical data has been rated as poor. The aquatic invertebratecommunity at the site has been stable over the past five years (2001-2005). During the Fall2005 search only seven different insect families were found, of which two were mayflies,stoneflies, or caddisflies. Additionally, no winter stoneflies were found at this site when it wassearched during the winters of 2002-2006. 96Table 2.11. Ecological Conditions and Aquatic Insect Families at HRWC Adopt-A-StreamProgram Monitoring Sites in the Swift Run 97Study SiteEcologicalConditions*PopulationDiversityAvg. InsectFamiliesAvg. EPTFamiliesAvg.SensitiveFamiliesWinterStoneflySwift Run Poor Stable 7 2 0 NoneAnn Arbor-Ypsilanti Metropolitan Area 2-66<strong>Watershed</strong> <strong>Management</strong> <strong>Plan</strong>
* categories: excellent, good, fair, and poor2.4.9 Traver CreekWater QualityThe Middle <strong>Huron</strong> Stream Monitoring Program hascollected water quality data for Traver Creekannually from May to September since 2003.Measurements include total phosphorus load, totalsuspended solids, conductivity, pH, and dissolvedoxygen. 98 Results from this program forconductivity, pH and dissolved oxygen aredescribed in section 2.3.1. Phosphorus loadingcurves have been developed for all ten sites in theprogram. Figure 2.32 shows the curve for the Traver Creek site at Wagner Road. The slope ofthe loading curve is an indication of the storm flow effect on the overall loading to themeasurement site. In the case of the Traver Creek site, the low slope indicates that, the TPload increases little as the discharge increases. However, no significant storm samples areincluded in this data. Additional storm samples were taken July-September 2007. These dataare in the process of being analyzed and will be improve the reliability of the slope calculation.Total suspended solids curves have also been developed for each of the ten sites. Thesecurves and their calculations can be found in Appendix K. This data along with a comparisonbetween TP and TSS is being analyzed at the current time as part of the 2007 Middle <strong>Huron</strong>Partners Annual Report.Ann Arbor-Ypsilanti Metropolitan Area 2-67<strong>Watershed</strong> <strong>Management</strong> <strong>Plan</strong>
Traver CreekTotal P Load (lbs/day)8765432100.1 1 10 100Discharge (cfs)y = 0.4243xR 2 = 0.846SamplesLinear (Samples)Figure 2.32. Instantaneous total phosphorus loading calculations by measured discharge for monthly measuresMay-September 2003-2006, and storm samples July-September, 2007 at the Traver Creek site at the Neilson Courtcrossing.The MDEQ collected E. coli data in 2001 and 2002 for Geddes Pond and its tributaries insupport of the development of the Geddes Pond E. coli TMDL. Water quality standards of 130E. coli per 100 mL in Traver Creek were exceeded in 2001 and remained elevated in 2002.Some of the highest concentrations were found at the mouth of the tributary. 99The Adopt-A-Stream Program at the <strong>Huron</strong> <strong>Watershed</strong> <strong>Council</strong> uses a stream waterconductivity threshold of 800 µS as an indicator of possible water pollution, above which waterquality degradation may be occurring. Traver Creek is monitored at two sites, by the Adopt-A-Stream program. The average conductivity at these sites is 1032 µS at Broadway Road and798 µS upstream at Dhu Varren Road. This suggests that ion (i.e. salt) loading may beoccurring as the creek flows into Ann Arbor.Freshwater Biological CommunitiesTraver Creek is monitored at Broadway and Dhu Varren Road by the Adopt-A-Stream program.The ecological condition of the sites over the past five years (2001-2005), as determined by acombination of biological and physical data, has been rated as poor and fair respectively. Theaquatic invertebrate communities at the sites have been stable over the past five years (2001-2005). During the Fall 2005 search, only four different insect families were found at theBroadway site of which two were mayflies, stoneflies, or caddisflies compared to eleven insectfamilies found at the Dhu Varren site, of which four were mayflies, stoneflies, or caddisflies.Winter stoneflies were found at these sites when they were searched during the winters of2002-2006 with the exception of the Broadway site in 2006. 100Ann Arbor-Ypsilanti Metropolitan Area 2-68<strong>Watershed</strong> <strong>Management</strong> <strong>Plan</strong>
Table 2.12. Ecological Conditions and Aquatic Insect Families at HRWC Adopt-A-StreamProgram Monitoring Sites in the Traver Creekshed 101Study SiteEcologicalConditions*PopulationDiversityAvg. InsectFamiliesAvg. EPTFamiliesBroadway Poor Stable 4 2 0Dhu VarrenFair Stable 11 4 0Rd* categories: excellent, good, fair, and poor2.4.10 Ford LakeAvg.SensitiveFamiliesWinterStoneflyPresent 2yearsPresent 4yearsThe MDEQ has collected annual water quality dataat monthly intervals at four stations in Ford Lake todetermine the progress toward meeting thephosphorus goal established for the Ford andBellville Lakes TMDL. Total phosphorusconcentrations cannot exceed 50 µg/L in the<strong>Huron</strong> <strong>River</strong>, immediately upstream of Ford Lake,in order to meet the goal of 30 µg/L for totalphosphorus in Bellville Lake. Data was collectedfrom April to September during the years 1994-1999, 2001-2003, and 2004. The most recentmonitoring data collected during the 2004 season indicates that the average total phosphorusconcentrations found in Ford Lake ranged from 40 to 61 µg/L. Comparison of historical data tocurrent data for Ford Lake shows no clear trends in average total phosphorus concentrations.The MDEQ also measured secchi depths in Ford Lake over the same monitoring seasons.These measurements showed the largest changes in apparent water quality from 1994 to 2001.However, water quality conditions did not continue to improve after 2002. Thermocline data for2004 showed tremendous variability in the timing and degree of thermal stratification in FordLake when compared to historical data. Overall water quality indicators for Ford Lake102, 103, 104, 105, 106, 107demonstrate that this lake is a eutrophic impoundment.The DNR conducted a study on the fish population of Ford Lake in 1998 to gauge the levels ofwhite perch inhabiting the lake, fearing they may become nuisance. Besides the white perch,Ford Lake has not seen any gains or loses in fish species over the last twenty-two years. Fishspecies found through electrofishing were “carp, gar, log perch, pumpkinseed sunfish, bluegill,yellow perch, green sunfish, largemouth bass, smallmouth bass and walleye.” White perchwere not found at high enough levels to classify them as “nuisance.” 1082.4.11 Belleville LakeThe MDEQ has collected annual water quality dataat monthly intervals at four stations in BellevilleLake to determine the progress toward meeting thephosphorus goal established for the Ford andBellville Lakes TMDL. Total phosphorusAnn Arbor-Ypsilanti Metropolitan Area 2-69<strong>Watershed</strong> <strong>Management</strong> <strong>Plan</strong>
concentrations cannot exceed the target of 30 µg/L in Bellville Lake. Data was collected fromApril to September during the years 1994-1999, and 2001-2006. The most recent monitoringdata collected during the 2004 season indicates that the average total phosphorusconcentrations found in Belleville Lake all exceeded the 30 µg/L threshold and ranged from 31to 67 µg/L. Comparison of historical data to current data for Belleville Lake shows no cleartrends in average total phosphorus concentrations.The MDEQ also measured secchi depths in Belleville Lake over the same monitoring seasons.These measurements showed the largest changes in apparent water quality from 1994 to 2001.However, water quality conditions did not continue to improve after 2001. Thermocline data for2004 showed tremendous variability in the timing and degree of thermal stratification in FordLake when compared to historical data. Overall water quality indicators for Ford Lake109, 110, 111, 112, 113, 114demonstrate that this lake is a eutrophic impoundment.In 1994, a collaboration between multiple shareholders in federal, state and local government;business; and academia came together to create a plan to clean-up the Willow Run Creek Siteto avert designation as a US EPA “Superfund” site for hazardous waste. The site had beenused as a dumping ground for manufacturing since 1941 with most hazardous waste pouredinto the Willow Run Sludge Lagoon, Tyler Pond and Edison Pond. The Creek Site wasremedied over the course of four years by treating and confining the dried, hazardoussediments to a landfill site according to MDEQ requirements. In the future, the partnershipplans to clean up nearby wetlands affected by the Lagoon and two ponds, mitigate the lostwetlands and institute a long-term monitoring plan for erosion and surface and groundwater 115 .2.5 CRITICAL AREASIn order to establish an effective plan for addressing the key threats and impairments in thewatershed, it is helpful to determine which areas in the Middle <strong>Huron</strong> <strong>Watershed</strong> arecontributing the most to its impairment. Accordingly, this plan’s is role is to identify these“Critical Areas” and provide direction for further, more specific analysis. Additionalsubwatershed or creekshed plans have been—and will continue to be—developed to identifymore specific critical area targets for addressing key pollutants.The first step in identifying critical areas is to examine the TMDL coverage of impaired waters.Figure 2.33 indicates the impaired waters in the Middle <strong>Huron</strong> <strong>Watershed</strong> that are listed forcurrent or future TMDL development. These areas require specific analysis and treatmentactivities to address the listed impairments. Specific loading calculations for these areas arediscussed in Section 2.5.1.In addition to these specific impairments, general measures of potential impairment were alsoconsidered. Based on the most recent (2000) land use data developed by the SoutheastMichigan <strong>Council</strong> of Governments (SEMCOG) and imperviousness statistics developed by theRouge <strong>River</strong> Wet Weather Demonstration Project, 116 watershed imperviousness maps andstatistics were calculated. The amount of imperviousness in a watershed is a strong indicator oflikely impacts to hydrology and water chemistry including higher nutrient and sediment values.Figure 2.34 displays imperviousness across the watershed according to key breakpoints thatare indicative of impairment. Generally, research indicates that once the impervious cover in awatershed exceeds 10%, surface waters begin to show signs of impairment. Imperious coverover 25% generally results in significant impairment, and watersheds with over 50% imperviousAnn Arbor-Ypsilanti Metropolitan Area 2-70<strong>Watershed</strong> <strong>Management</strong> <strong>Plan</strong>
cover required extensive and expensive management actions to maintain even modest waterand habitat quality.Figure 2.35 shows the impervious cover by creekshed. From this graphic, it is apparent thatAllens, Millers and Malletts Creeksheds, along with the drainages to both Ford and BellevilleLakes, are challenged by high amounts of imperious cover. These are the most urbanizedcreeksheds in the Middle <strong>Huron</strong> <strong>Watershed</strong>. The only creekshed with less than 10% imperviouscover is the Boyden Creekshed, thus the entire watershed is challenged from this perspective.This conclusion is even more apparent when one analyzes future projections. Using masterplanning documents from municipalities in the watershed, a future land use map was projected,assuming that each municipality is built-out according to its master plan (see figure 2.13). Withthis method, imperviousness was assumed to be consistent with current land use based onzoning classifications. The build-out scenario is not much different than the current estimates,except that Boyden Creek would move to over 10% imperviousness, and Swift Run wouldbecome more than 50% impervious (see figure 2.36).One other way to look at this issue is to examine the impact within a riparian buffer zone oneither side of the river and tributary creeks. Protection of the riparian buffer zone by maintainingit as natural area as much as possible has been shown to provide increased pollutant removalcapacity and flow attenuation. Analysis of a 300-foot buffer of surface waters in the Middle<strong>Huron</strong> <strong>Watershed</strong> shows a mix of land uses (see figure 2.37). However, several creekshedsshow a high percentage of undisturbed lands within the buffer zone (see figure 2.38). This maymitigate the impact of impervious development in these creeksheds somewhat. Othercreeksheds such as Boyden, Traver and Honey could be targets for better riparian bufferprotection and restoration.Taken together, the main conclusion of the critical area analysis is that the entire watershed isimpacted to some degree, with most of the creeksheds being highly impacted by imperviousarea. The results from monitoring efforts confirm that impairments are occurring, and that theyare likely caused by the high rates of impervious area in each creekshed. These areas, whichwill require the development of TMDL plans, are the critical areas for initial focus. Addressingthe impairments in these areas will take many years and millions of dollars. The activities toaddress these impacts will also likely have complementary benefits (beyond meeting TMDLtargets) to the watershed by addressing other impairments in the watershed. Beyond thesecritical areas, implementation activities should focus on restoring and protecting riparian buffersthroughout the watershed and managing development in the region to minimize the impact ofstormwater runoff from newly developed areas.Ann Arbor-Ypsilanti Metropolitan Area 2-71<strong>Watershed</strong> <strong>Management</strong> <strong>Plan</strong>
Figure 2.33
Figure 2.34
Figure 2.35
Figure 2.36
Figure 2.37
Figure 2.38
[THIS PAGE IS INTENTIONALLY LEFT BLANK]Ann Arbor-Ypsilanti Metropolitan Area 2-72<strong>Watershed</strong> <strong>Management</strong> <strong>Plan</strong>
2.5.1 Loadings of Pollutants to Impaired WatersPhosphorus Total Maximum Daily Load for Middle <strong>Huron</strong> TMDLIn December of 1993, a 12-month phosphorus loading analysis was initiated by the MDEQ toinvestigate the water quality of the Middle <strong>Huron</strong>. The analysis showed that Ford and Bellevillelakes were impaired as they failed to meet water quality standards due to phosphorusenrichment, which contributed to nuisance algae blooms. Based on water quality sampling andaccepted mathematical models, a phosphorus TMDL of 50 µg/L at Michigan Avenue and 30µg/L in Belleville Lake was established for the months of April to September. This TMDL wasoriginally approved by the U.S. EPA in 2000 and the most recent version was published byMDEQ in September 2004 (see Appendix A).According to MDEQ, the TMDL should assure the attainment of water quality standards forBelleville Lake, and significantly reduce problems in Ford Lake, in addition to meeting therequirements of Water Quality Standard R 323.1060(2) which states “nutrients shall be limited tothe extent necessary to prevent stimulation of growths of aquatic rooted, attached, suspended,and floating plants, fungi, or bacteria which are or may become injurious to the designated usesof the waters of the state.”Based on three years of scheduled monitoring and the employment of the Walker methodologyof lake trophic assessment, the TMDL estimated that the annual total phosphorus load was80,000 lbs/year. Approximately half of this load was derived from point sources, and half wasfrom nonpoint sources. The Mill Creek Subwatershed, the only subwatershed not covered bythis plan, was estimated from water quality monitoring to be contributing nearly one-fourth of thetotal phosphorus. The Mill Creek Subwatershed <strong>Management</strong> <strong>Plan</strong> 117 estimates the phosphorusloading from Mill Creek to be 12,000 to 15,000 lbs/year, and 15,000 lbs/yr enter the system fromsources upstream of Mill Creek. The remaining 50,000 to 53,000 lbs/year are contributed byMiddle <strong>Huron</strong> <strong>Watershed</strong> as defined in this plan (downstream of the Mill Creek outflow). Toreach the TMDL goal will require a reduction in current phosphorus loads by 50 percent, whichis approximately 25,000-26,500 lbs/year.Recent and current phosphorus contributions from the major point sources in the Middle <strong>Huron</strong><strong>Watershed</strong> (including Mill Creek) are determined from self-reporting to the MDEQ, and shown intables 2.13 and 2.15. Altogether, the four major point source facilities contribute approximately16,800 pounds per year of total phosphorus to the Middle <strong>Huron</strong> system. The loading fromthese facilities is down 29% from 23,800 pounds per year in 2003 (the last time a full estimatewas made) and down 41% from the original loading calculations in 1996. The Ann Arbor WasteWater Treatment <strong>Plan</strong>t is by far the largest contributor to the system, making up 96% of the totalpoint source load.Table 2.13. Current Total Phosphorus Loads from Major NPDES Facilities in the Middle<strong>Huron</strong> <strong>Watershed</strong> (source: Reports from the facilities)Based on mostrecent annualreporting*Avg DailyFlow (mgd)AvgConcentration(mg/L)Avg DailyLoading(lb/day)Annual Load(lb/yr)Chelsea WWTP 0.85 0.13 0.83 297.77Dexter WWTP 0.33 0.26 0.70 255.79Loch Alpine SA 0.16 0.23 0.31 112.70Ann Arbor WWTP 18.92 0.28 44.25 16,147.08Total 20.26 46.09 16,813.34Ann Arbor-Ypsilanti Metropolitan Area 2-79<strong>Watershed</strong> <strong>Management</strong> <strong>Plan</strong>
* September 2006 through August 2007.The total allocated pounds per day for the major point sources in the Middle <strong>Huron</strong> <strong>Watershed</strong>ranges from 166 lb/day in April to 55 lb/day in July and August. The larger permitted allocationin April is to account for the higher spring discharge. As shown in table 2.14, the majority of thewaste load allocation is assigned to the Ann Arbor WWTP. The original allocation included thecontributions from the DaimlerChysler proving grounds in Chelsea. As of 2004, that facility nolonger contributed effluent containing phosphorus to the watershed. The company opted toconnect to Sylvan Township’s new pipeline that removes the effluent from the Proving Groundsand transports it to a treatment facility west of the Washtenaw County line in Jackson County’sLeoni Township, and out of the <strong>Huron</strong> <strong>River</strong> <strong>Watershed</strong>. Therefore, the Chelsea ProvingGrounds no longer holds a NPDES permit from MDEQ to send effluent to Letts Creek. The 210lbs/yr of Total Phosphorus that the company previously contributed has been removed (whethertemporarily or permanently is not clear) from the watershed as a result.Table 2.14. Total Phosphorus Wasteload Allocation (WLA) (lb/day) for Middle <strong>Huron</strong>TMDL(source: Kosek,1996)Apr May Jun Jul Aug SepAnn Arbor WWTP 150 60 60 50 50 60Chelsea WWTP 9.5 2.2 2.2 1.8 1.8 2.2DaimlerChrysler-Chelsea* 0.5 0.3 0.3 0.3 0.3 0.3Dexter WWTP 3.0 0.9 0.9 0.8 0.8 0.9Loch Alpine SA 1.5 0.6 0.6 0.5 0.5 0.6Other Point Sources 1.5 1.7 1.7 1.7 1.7 1.7Total Point Source WLA 166 66 66 55 55 66* DaimlerChrysler-Chelsea is no longer a point source to the <strong>Huron</strong> <strong>River</strong>.Based on water quality monitoring data of discharges from 2003 to 2007, average monthlyphosphorus discharges from the major point sources in the Middle <strong>Huron</strong> ranged from 45lbs/day in April to 72 lbs/day in September. This data indicates that, over the five-year timespan,on average, the point sources have stayed under their allocations as a group every monthexcept September. Dexter WWTP is also over their allocation for the month of May. While thenumber and degree of exceedances since 1995 have decreased, the Ann Arbor and Dexterwaste water treatment plants continue to experience exceedences of their WLA defined in theTMDL.Table 2.15. Average Monthly Wasteload from Subwatershed Point Sources (lb/day) from2003-07 (source: MDEQ, from reports from the facilities)Apr May Jun Jul Aug SepChelsea WWTP 0.7 0.9 0.7 1.0 0.8 0.7Dexter WWTP 0.9 1.1 0.7 0.6 0.7 0.8Loch Alpine SA 0.4 0.5 0.4 0.3 0.3 0.5Ann Arbor WWTP 43.0 47.7 43.6 45.3 47.9 70.2Average Point Source WLA 45.0 50.2 45.4 47.2 49.7 72.2The major point sources are all operating under permits that were revised in December 2006following a negotiated settlement between the point sources and the State of Michigan (seeAppendix B). Under this agreement, the permit limits were adjusted slightly from 1993 levels,Ann Arbor-Ypsilanti Metropolitan Area 2-80<strong>Watershed</strong> <strong>Management</strong> <strong>Plan</strong>
ut not as far as TMDL limits. It is further stated that the permit levels will be set to TMDL levelsin 2012. If the facilities increased the concentration level of phosphorus in their effluent to thecurrent permit limits, then their annual load would jump to over 59,000 pounds per year of totalphosphorus (see Table 2.16).Table 2.16. Potential Total Phosphorus Loads from Major NPDES Facilities in the MillCreek Subwatershed Operating at Current Permit Limits (source: MDEQ)Max. Avg.Avg DailyAvg Daily Annual LoadConcentrationFlow (mgd)Load (lb/day) (lb/yr)(mg/L)Chelsea WWTP 1.3 0.8 9.8 3577.0Dexter WWTP 0.58 0.6 2.9 1058.5Loch Alpine SA 0.31 0.8 2.1 766.5Ann Arbor WWTP 29.5 1.0 147.6 53,880.6Total 31.7 162.4 59,282.6The total load allocation among the nonpoint sources and point sources in shown in table 2.17.In all months except May, the load allocated to the point sources exceeds that of the nonpointsources. If the reductions are met, then the load allocation for April through July provides abuffer of 4 to 48 pounds of total phosphorus, while the allocation would just meet the TMDL inAugust and September.Table 2.17. Total Phosphorus Load Allocation (LA) (lb/day) and TMDL for Middle <strong>Huron</strong>(Source: Kosek, 1996)Apr May Jun Jul Aug SepNonpoint Source LA 91 100 61 29 19 37Point Source WLA 166 66 66 55 55 66LA + WLA 257 166 127 84 74 103TMDL 304 214 139 88 74 103Remaining 47 48 12 4 0 0Assuming that the Mill Creek sources will be addressed by the activities outlined in the MillCreek Subwatershed <strong>Management</strong> <strong>Plan</strong>, there remains a phosphorus load of 50,000 to 53,000lbs/yr coming from the Ann Arbor-Ypsilanti Metropolitan Area covered by this plan.Extrapolatingthese figures into seasonal loads suggests that the maximum load should reach 28,036 lbs Aprilthrough September to be compliant with the TMDL. The TMDL assumes that about half (39,574lbs) of the total modeled load comes during this growing season. This requires a total loadreduction of 11,538 lbs. Of the total load, 24,293 lbs (61%) were estimated to be coming fromnonpoint sources, with the remainder (15,561 lbs) from point sources. Again extrapolating fromload allocations, the load reduction required of nonpoint sources is 14,035 lbs over the April toSeptember growing season, while point sources are required to reduce by 1,165 lbs.Based on reporting from 2003-07 (Table 2.15), point sources have reduced loading to 34%below waste load allocations to 9,438 lbs, though some monthly violations still occur. Thisrepresents a load reduction of 6,123 lbs from 1996 levels. While the nonpoint source loadreduction target will remain 14,035 lbs for the purposes of this plan, the point source reductionrepresents a solid buffer for any load reduction shortfalls. Monthly point source load limitviolations will need to be eliminated, and nonpoint source load reductions also must beAnn Arbor-Ypsilanti Metropolitan Area 2-81<strong>Watershed</strong> <strong>Management</strong> <strong>Plan</strong>
accounted for to reach the TMDL for phosphorus in the watershed. See section 3.5.3.1 for asummary of specific nonpoint source load reduction practices and targets.Modeling data from the TMDL development also makes suggestions about annual loading. For2003, the point source phosphorus load was reported as 23,800 lbs/yr. Loading from tributariesestimated by the 1996 model used for TMDL development indicates 22,000 lbs/yr was beingcontributed by nonpoint sources (see Table 2.18). As indicated previously, the most recentreporting indicates an annual load of 16,813 lbs/yr by point sources – a 53% reduction from1996 levels.Table 2.18. Total Phosphorus Loading from Tributary Sources (Source: Kosek, 1996)Significant Sources Load from '96 Load from Percent of PercentSampling '96 Model Total DifferenceUpstream Sources 30,000 30,000 37.5%Boyden Creek 961 1.2%Honey Creek 1,039 1.3%Other sources (upper section) 2,000 0.0%HBP Subtotal 32,000 32,000 40.0%Allens Creek 1,000 1,813 2.3% 81%Traver Creek 1,855 2.3%Malletts Creek 700 3,945 4.9% 464%Miller Creek 1,957 2.4%Swift Run 300 1,210 1.5% 303%Other sources (middle section) 9,700 920 1.2% -91%Dixboro Road Subtotal 43,700 43,700 54.6%Ann Arbor WWTP 28,000 28,000 35.0% 0%Fleming Creek 1,300 1,300 1.6% 0%Superior Drain 0.0%Other sources (lower section) 7,000 7,000 8.8% 0%Michigan Avenue Total 80,000 80,000 100.0%Dr. John Lehman with the University of Michigan also studied phosphorus loading through theriver system in a mass balance study between 2003 and 2005 (see section 2.4.1.) Bycomparison, his team found the following results:1. From June 2003 to December 2004, 33427 kilograms (KG) of total phosphorus (TP)entered Ford Lake. During the same time period, AAWWTP reports discharging 12427KG TP to the <strong>Huron</strong> <strong>River</strong> (37%).2. Of the 12427 KG P that AAWWTP discharged to the <strong>Huron</strong> <strong>River</strong>, only 8854 KG (71%)emerged from Superior Pond. This represents 26% of the load to Ford Lake.3. More TP entered Ford Lake during May 2004 as a result of the 22 May flood than hadbeen discharged by AAWWTP in the previous year.4. From June 2003 to March 2005, 4279 KG of dissolved P (DP) was discharged fromBarton Pond into the <strong>Huron</strong> <strong>River</strong> above Ann Arbor. During the same time, 12205 KGAnn Arbor-Ypsilanti Metropolitan Area 2-82<strong>Watershed</strong> <strong>Management</strong> <strong>Plan</strong>
DP was present below Geddes Pond and upstream of the AAWWTP outfall. Thisrepresents an increase of 7926 KG added within Ann Arbor above its WWTP.5. Also from June 2003 to March 2005, 22804 KG DP exited Superior Dam, an increase of10599 KG from upstream of the WWTP (N.B. This is less than the reported discharge byAAWWTP owing to retention within Superior Pond).6. 23002 KG DP entered Ford Lake, an increase of 198 KG from Superior Rd to Spring St.7. For Particulate P (PP; DP + PP = TP), 16771 KG discharged from Barton Pond; 12043KG discharged from Geddes Pond. This is a net loss of 4728 KG PP removed by Argoand Geddes Ponds. The balance between PP retention and DP release resulted in thenet addition of 3198 KG P to the <strong>River</strong> within Ann Arbor.8. From June 2003 to March 2005, 16190 KG discharged from Superior Dam. This is anincrease of 4147 KG compared to upstream of the AAWWTP. The N/P ratio of thisadded particulate matter is too low for it to be biological matter. It is almost surely erodedsoil. 18349 KG PP entered Ford Lake. This is an increase of 2159 KG. The N/P ratio ofthis particulate matter is too low for it to be biological matter. It is soil, too.9. 41351 KG TP entered Ford Lake and 32445 KG exited. This was a removal of 8906 KGor a retention of 21.5%. The proportioning between dissolved and particulates was suchthat 19.3% of DP and 24.3% of PP were retained. 118An updated analysis of phosphorus loading to Ford and Belleville Lakes can be reviewed inAppendix C.E. coli TMDL for Geddes PondIn August 2001, a TMDL for E. coli was established for the <strong>Huron</strong> <strong>River</strong> downstream of ArgoDam to Geddes Dam (see Appendix A). To remove the reach from the impaired waters list, itwill need to meet the water quality standard for pathogens. For the TMDL, the standardorganism count of 130 per 100 milliliters (ml) as a 30-day geometric mean between May 1 toOctober 31 was used. Following the establishment of the TMDL, an implementation plan wascompiled by affected stakeholders. It was revised in 2011. Refer to Appendix D for details.Data on counts for E. coli and fecal coliform bacteria vary widely throughout this reach and thecontributing tributaries. Historical data indicate that Lower Geddes Pond has consistentlyexhibited the highest bacteria concentrations among all <strong>Huron</strong> <strong>River</strong> reaches in the Ann Arborarea. Additional sampling conducted in 2001 by the DEQ corresponds with the findings of thehistorical data and indicates that the listed reach and its tributaries continue to exceed the WQSfor E. coli.The results of 2002 sampling for the implementation plan indicated that Geddes Pond exceededthe 30-day geometric mean for full body activities during the second half of July and all ofAugust. There was one additional sampling event that exceeded the full body activity dailymaximum standard (300 E. coli per 100 ml) in September. Each tributary sampled had elevatedE. coli, and seemed to be influenced by wet weather events. Allens Creek typically had high E.coli concentrations and had visual evidence of illicit connections. Millers Creek, at the east andwest branches at Plymouth Road, were typically higher than other locations. Sampling onMalletts Creek was started in July and showed high E. coli concentrations for the periodsampled. Early season sampling on Swift Run Creek indicated elevated concentrations atvarious locations. However, the last four weeks of sampling were dry or stagnant. TraverCreek E. coli concentrations decreased later in the sampling season, but some of the highestconcentrations overall were found at the creek mouth.Ann Arbor-Ypsilanti Metropolitan Area 2-83<strong>Watershed</strong> <strong>Management</strong> <strong>Plan</strong>
DNA sampling was also conducted during one sampling event on August 27, 2002, in the hopesof determining whether sources of E. coli were human or non-human. Unfortunately, the resultswere inconclusive.Bacteria sources have been determined to consist of a range of wet and dry weather-drivensources. However, the primary loading of pathogens enters the <strong>Huron</strong> <strong>River</strong> directly through thetributaries and storm sewers within the listed reach. Potential pathogen sources for the listedwaterbody include sources typically associated with urban and suburban runoff because theimmediate watershed is primarily composed of these land types. Source evaluation indicatesthat bacteria loads from a large part of Ann Arbor enter Geddes Pond/<strong>Huron</strong> <strong>River</strong> via the stormwater system. Bacteria loads are also delivered to Geddes Pond/<strong>Huron</strong> <strong>River</strong> by tributaries thatdrain a large portion of the Ann Arbor area. Other pathogen sources for Geddes Pond/<strong>Huron</strong><strong>River</strong> likely include upstream inputs, illicit sewer connections, pet and wildlife feces, and a smallnumber of malfunctioning septic systems. Agricultural land uses located in the upstreamreaches of the Traver Creek watershed make livestock and horse feces other likely sources.Since the bacteria standard is concentration based, the TMDL is also concentration, rather thanmass loading based. Further, since low concentrations were detected to be coming from riversources, the focus was placed on tributary sources.Based on this reasoning, and considering other relevant factors monthly average concentrationmaxima were established for each of the tributaries (see Table 2.19).Table 2.19. Allowable E. coli Concentrations for the Subwatersheds of the <strong>Huron</strong> <strong>River</strong>.Tributary May June July August September OctoberMonthly Average E. coli Concentration (per 100 ml)Allens Creek 300 300 300 300 300 300Traver Creek 130 130 130 130 130 130Millers Creek 130 130 130 130 130 130Malletts Creek 130 130 130 130 130 130Swift Run 130 130 130 130 130 130Direct Drainage 300 300 300 300 300 300Since a concentration standard is used, a total loading of bacteria from the creeks was notestablished for the TMDL. However, loading allocations were established for each creekshedbased on these allowable concentrations and monthly stream flow averages. Based on thisinformation, no fixed pathogen loading figures have been established, nor specific reductiontargets. The Geddes E. coli Implementation <strong>Plan</strong> lays out a strategy to eliminate or reduce allmajor pathogen sources to meet the monthly average concentration goals.Biota TMDL for Malletts CreekThe reach of Malletts Creek from its confluence with the <strong>Huron</strong> <strong>River</strong> at South Pond Parkupstream to Packard Road has been listed as an impaired water due to poor fish andmacroinvertebrate monitoring results (See Table 2.). The listed impairment is based on datacollected by DEQ in August 1997. A TMDL was established to address this impairment inAugust 2004 (see Appendix A).Data collected by DEQ in 2002 and 2003 at two sites in the Malletts Creekshed indicated thatfish and macroinvertebrate populations were acceptable. Habitat assessments conductedduring the same time rated the sites as “good.” However, individual measures of flow and bankstability suggested unstable conditions. Also, HRWC data through 2005 for lower Malletts sitesAnn Arbor-Ypsilanti Metropolitan Area 2-84<strong>Watershed</strong> <strong>Management</strong> <strong>Plan</strong>
have consistently rated the sites as “poor.” For these reasons, the reach remains listed asimpaired and the TMDL was established.The primary sources of concern for poor fish and macroinvertebrate conditions are hydrologicalteration and excessive sedimentation due to urban and suburban development. Reductions instorm sewer runoff rates and solids loads from both commercial and municipal storm waterrunoff sites, along with reduced stream bank erosion through more stable flow management arenecessary to reduce impacts on the aquatic life.Biota impairments also do not lend themselves to direct loading calculations. Because of thisfact, along with the concern about sediment dynamics in the system, the focus of loadingcalculations for the TMDL establishment was on total suspended solids (TSS). While theprimary goal is to improve fish, macroinvertebrate, and habitat measures, TSS measurementswill be used by DEQ to further assess improvements in Malletts Creek as a secondary goal.This secondary goal is represented by a mean annual, in-stream TSS concentration target of 80mg/l to characterize wet weather runoff/washoff events. The mean annual target concentrationof 80 mg/l TSS is based on a review of existing conditions and published literature on the effectsof TSS by the DEQ. This secondary numeric target may be overridden by achievement of thebiological and habitat numeric targets. However, if the TSS numeric target is achieved, but thebiota or habitat numeric targets are not achieved, then the TSS target may have to bereevaluated.This secondary goal has the added benefit of being consistent with goals to reduce phosphorusloading under the Ford and Belleville Lakes TMDL. According to the Malletts Creek Restoration<strong>Plan</strong> (see Appendix F), the plan targets a 50% reduction in total phosphorus, which ischaracterized as “…functionally equivalent to the mean TSS concentration of 80 mg/l.”Table 2.20. Annual TSS loads based on NPDES permitted point sources and various land usecategories in the Malletts Creek watershed. Estimated annual TSS loads and recommended TSSreductions (WLA and LA) are derived. (Source: Malletts Creek TMDL, MDEQ)Source Category Acres Estimated CurrentTSS (Pounds/Year)WLA Components:TMDL Target LoadTSS (Pounds/Year)NPDES Individual/GeneralPermitted Point Source TSS Load:127,396 127,396NPDES Permitted Storm Water TSSLoad:Residential 2422 496,343Industrial 535 202,971Commercial and Service 686 405,831Transportation/Comm/Util. 232 68,643Subtotal: 1,173,788 985,853(16% reduction)WLA Total: 3875 1,301,184 1,113,249LA Components:Agricultural LandCropland 787 53,822 29,695(45% reduction)(Background Sources)Ann Arbor-Ypsilanti Metropolitan Area 2-85<strong>Watershed</strong> <strong>Management</strong> <strong>Plan</strong>
Forested/Shrub/Open LandDeciduous Forest 437 10,512 10,512Openland/Shrub/Rangeland 1559 37,500 37,500Conifer Forest 8 192 192WetlandForested 9 191 191Water BodyLake/Reservoir 21 445 445LA Subtotal: 2821 102,662 78,535Overall Totals: 6696 1,403,846 1,191,784(Total 15% reduction)At the time of the TMDL development, the estimated total annual TSS load from all pointsources, which includes NPDES permitted storm water discharge, was approximately 651 tons(1.3 million pounds). Additional non-point source discharge and background sources accountfor 51 tons, for an overall total load of 702 tons (1.4 million pounds). The TMDL target load of596 tons of TSS will require a 15% overall reduction in loading (106 tons) – 16% reduction instorm water sources and 45% reduction in agricultural sources.A TMDL Implementation <strong>Plan</strong> was developed by relevant Malletts Creek governing agencies.The plan was revised in 2011. See Appendix X for details.Biota TMDL for Swift RunThe reach of Swift Run from its confluence with the <strong>Huron</strong> <strong>River</strong> at South Pond Park upstreamto Ellsworth Road has been listed as an impaired water due to poor macroinvertebratemonitoring results (See Figure 2.31). The listed impairment is based on data collected by DEQin August 1997. A TMDL was established to address this impairment in November 2004 (seeAppendix A).Data collected by DEQ in 1997 at Hogback Road rated the macroinvertebrate community as“poor.” Further sampling by DEQ in 2003 at Shetland Drive also rated macroinvertebratecommunities as poor. Habitat assessments conducted during the same times rated theHogback site as “fair” or moderately impaired, and the Shetland site as “good.” However,individual measures of flow and bank stability suggested unstable habitat conditions at bothsites. Also, HRWC data through 2005 for lower Swift Run at Shetland have consistently ratedthe site as “poor.” For these reasons, the reach remains listed as impaired and the TMDL wasestablished.As with the TMDL for biota in Malletts Creek to the west, the primary sources of concern forpoor macroinvertebrate conditions in Swift Run are hydrologic alteration and excessivesedimentation due to urban/comercialized development. Reductions in storm sewer runoff ratesand solids loads from both commercial and municipal storm water runoff sites, along withreduced stream bank erosion through more stable flow management are necessary to reduceimpacts on the aquatic life.Biota impairments also do not lend themselves to direct loading calculations. Because of thisfact, along with the concern about sediment dynamics in the system, the focus of loadingcalculations for the TMDL establishment was on total suspended solids (TSS). While theprimary goal is to improve fish, macroinvertebrate, and habitat measures, TSS measurementswill be used by DEQ to further assess improvements in Swift Run as a secondary goal. Thissecondary goal is represented by a mean annual, in-stream TSS concentration target of 80 mg/lAnn Arbor-Ypsilanti Metropolitan Area 2-86<strong>Watershed</strong> <strong>Management</strong> <strong>Plan</strong>
to characterize wet weather runoff/washoff events. The mean annual target concentration of 80mg/l TSS is based on a review of existing conditions and published literature on the effects ofTSS by the DEQ. This secondary numeric target may be overridden by achievement of thebiological and habitat numeric targets. However, if the TSS numeric target is achieved, but thebiota or habitat numeric targets are not achieved, then the TSS target may have to bereevaluated.This secondary goal has the added benefit of being consistent with goals to reduce phosphorusloading under the Ford and Belleville Lakes TMDL. According to the Malletts Creek Restoration<strong>Plan</strong> (see Appendix F), the plan targets a 50% reduction in total phosphorus, which ischaracterized as “…functionally equivalent to the mean TSS concentration of 80 mg/l.”Table 2.21. Land use categories and TSS loads in the Swift Run Creek watershed, WashtenawCounty, Michigan (Source: Swift Run TMDL, MDEQ; Scott Wade – LTI [2003a] using 2002 [Ann Arbor]and 1998 [Township] land use coverages)Source Category Acres Estimated CurrentTSS (Pounds/Year)WLA Components:Ann Arbor-Ypsilanti Metropolitan Area 2-87<strong>Watershed</strong> <strong>Management</strong> <strong>Plan</strong>TMDL Target LoadTSS (Pounds/Year)NPDES Individual/GeneralPermitted Point Source TSS Load: None NoneNPDES Permitted Storm Water TSSLoad:Residential 678 138,943 138,943Industrial 13 9,861 5,295(46% reduction)Commercial and Service 627 185,514 185,514Transportation/Comm/Util. 600 177,526 177,526Subtotal: 511,844 507,278(
20 tons, for an overall total load of 276 tons. The TMDL target load of 269 tons of TSS willrequire a 3% overall reduction in loading (
33 Michigan Department of Natural Resources. 2000. Michigan stream classification: 1967 system. Chapter 20 inSchneider, James C. (ed.) 2000. Manual of fisheries survey methods II: with periodic updates. MDNR FisheriesSpecial Report 25. Ann Arbor, MI: MDNR.34 U.S. Environmental Protection Agency. 1980. Modeling Phosphorus Loading and Lake Response underUncertainty: A Manual and Compilation of Export Coefficients. EPA report No. 440/5-80-011.35 U.S. Environmental Protection Agency, Office of Water. 2000. Nutrient Criteria Technical Guidance Manual:Lakes and Reservoirs, 1 st Edition. Report No. EPA-822-B00-001.36 Michigan Department of Environmental Quality (MDEQ), Water Bureau. April, 2005. Nutrient Chemistry Surveyof Ford and Belleville Lakes Washtenaw and Wayne Counties. Lansing, MI: MDEQ.37 The Middle <strong>Huron</strong> <strong>River</strong> <strong>Watershed</strong> Initiative. 2004. Annual Report 2002-2003.38 The Middle <strong>Huron</strong> <strong>River</strong> <strong>Watershed</strong> Initiative. 2002. Annual Report 2000-2001.39 The Middle <strong>Huron</strong> <strong>River</strong> <strong>Watershed</strong> Initiative. January 2001. Annual Report October 1999-December 2000.40 MDEQ: Surface Water Quality Division. February, 2002. Nutrients in Ford and Belleville Lakes, Michigan, 1998-2000.41 MDEQ, Surface Water Quality Division. January, 1996. A Phosphorus Loading and Proposed TMDL for Fordand Belleville Lakes, Washtenaw and Wayne Counties, December 1994-November 1995. Lansing, MI: MDEQ.42 Middle <strong>Huron</strong> Nutrient Stream Monitoring reports. Ann Arbor, MI: HRWC.43 Lehman, John. “Giving You a Better View: Adaptive <strong>Management</strong> for Improved Water Quality in Multi-Use<strong>Watershed</strong>s.” http://www.umich.edu/~hrstudy/ (date accessed)44 MDEQ, Water Bureau. February, 2005. A Biological Survey of the <strong>Huron</strong> <strong>River</strong> <strong>Watershed</strong>: Ingham, Livingston,Monroe, Oakland and Washtenaw Counties, July-September 2002. Lansing, MI: MDEQ.45 MDEQ, Water Bureau. February, 2005. A Biological Survey of the <strong>Huron</strong> <strong>River</strong> <strong>Watershed</strong>: Ingham, Livingston,Monroe, Oakland and Washtenaw Counties, July through September 1997. Lansing, MI: MDEQ.46 MDEQ: March, 2006 (date submitted for approval). E. coli TMDL Implementation <strong>Plan</strong> for Geddes Pond, <strong>Huron</strong><strong>River</strong>. Lansing, MI: MDEQ.47 Washtenaw County Drain Commission. January, 2007. Analysis, Identification, and Strategies for Urban WildlifeContamination to Support TMDL Implementation – Final Report.48 Adopt-a-Stream monitoring reports. Ann Arbor, MI: HRWC.49 MDEQ, Water Bureau. February, 2005. A Biological Survey of the <strong>Huron</strong> <strong>River</strong> <strong>Watershed</strong>: Ingham, Livingston,Monroe, Oakland and Washtenaw Counties, July-September 2002. Lansing, MI: MDEQ. (REPEAT 1)50 Limno-Tech, Inc. January, 2007. Aquatic Vegetation Survey and Preliminary <strong>Management</strong> Assessment Report -draft. Accessed via Ann Arbor, MI: City of Ann Arbor.51 Schneider, J.C. 1999. Classifying bluegill populations from lake survey data. Michigan Department of NaturalResources, Fisheries Division, Fisheries Technical Report No. 90-10, Ann Arbor, Michigan.52 Michigan Department of Natural Resources (MDNR): Fish Collection System. October 2001. Water Survey: ArgoPond.53 MDNR: Fish Collection System. August, 1997. Water Survey: Geddes Pond.54 MDNR: Fish Collection System. August, 1997. Water Survey: Barton Pond.55 Adopt-A-Stream macroinvertebrate and stream habitat monitoring data. 1994-2006. Ann Arbor, MI: <strong>Huron</strong><strong>River</strong> <strong>Watershed</strong> <strong>Council</strong>.56 MDEQ, Water Bureau. February, 2005. A Biological Survey of the <strong>Huron</strong> <strong>River</strong> <strong>Watershed</strong>: Ingham, Livingston,Monroe, Oakland and Washtenaw Counties, July-September 2002. Lansing, MI: MDEQ.57 Barr Engineering Co. for HRWC. 2002. Argo Pond Sediment Sampling Study. Ann Arbor, MI.58 Skadsen, J.M.., B.L. Rice, and D.J. Meyering. November, 2004. The Occurrence and Fate of Pharmaceuticals,Personal Care Products, and Endocrine Disrupting Compounds in a Municipal Water Use Cycle: A case study in theCity of Ann Arbor. Ann Arbor, MI: City of Ann Arbor, Water Utilities.59 Middle <strong>Huron</strong> Nutrient Stream Monitoring reports. Ann Arbor, MI: HRWC.60 MDEQ: March, 2006 (date submitted for approval). E. coli TMDL Implementation <strong>Plan</strong> for Geddes Pond, <strong>Huron</strong><strong>River</strong>. Lansing, MI: MDEQ.61 Washtenaw County Drain Commission website. “Rain Gardens – Natural Beauty, and Good for your <strong>River</strong>.”http://www.ewashtenaw.org/government/drain_commissioner/raingardens/raingarden.html. Accessed June 2007.62 Adopt-a-Stream monitoring reports. Ann Arbor, MI: HRWC.Ann Arbor-Ypsilanti Metropolitan Area 2-89<strong>Watershed</strong> <strong>Management</strong> <strong>Plan</strong>
63 Adopt-A-Stream macroinvertebrate and stream habitat monitoring data. 1994-2006. Ann Arbor, MI: <strong>Huron</strong><strong>River</strong> <strong>Watershed</strong> <strong>Council</strong>.64 Middle <strong>Huron</strong> Nutrient Stream Monitoring reports. Ann Arbor, MI: HRWC.65 MDEQ, Water Bureau. February, 2005. A Biological Survey of the <strong>Huron</strong> <strong>River</strong> <strong>Watershed</strong>: Ingham, Livingston,Monroe, Oakland and Washtenaw Counties, July-September 2002. Lansing, MI: MDEQ.66 Adopt-a-Stream monitoring reports. Ann Arbor, MI: HRWC.67 Adopt-A-Stream macroinvertebrate and stream habitat monitoring data. 1994-2006. Ann Arbor, MI: <strong>Huron</strong><strong>River</strong> <strong>Watershed</strong> <strong>Council</strong>.68 MDEQ, Water Bureau. February, 2005. A Biological Survey of the <strong>Huron</strong> <strong>River</strong> <strong>Watershed</strong>: Ingham, Livingston,Monroe, Oakland and Washtenaw Counties, July through September 1997. Lansing, MI: MDEQ.69 MDEQ, Water Bureau. February, 2005. A Biological Survey of the <strong>Huron</strong> <strong>River</strong> <strong>Watershed</strong>: Ingham, Livingston,Monroe, Oakland and Washtenaw Counties, July-September 2002. Lansing, MI: MDEQ.70 MDEQ, Water Bureau. February, 2005. A Biological Survey of the <strong>Huron</strong> <strong>River</strong> <strong>Watershed</strong>: Ingham, Livingston,Monroe, Oakland and Washtenaw Counties, July-September 2002. Lansing, MI: MDEQ.71 Middle <strong>Huron</strong> Nutrient Stream Monitoring reports. Ann Arbor, MI: HRWC.72 MDEQ, Water Bureau. February, 2005. A Biological Survey of the <strong>Huron</strong> <strong>River</strong> <strong>Watershed</strong>: Ingham, Livingston,Monroe, Oakland and Washtenaw Counties, July through September 1997. Lansing, MI: MDEQ.73 MDEQ, Water Bureau. February, 2005. A Biological Survey of the <strong>Huron</strong> <strong>River</strong> <strong>Watershed</strong>: Ingham, Livingston,Monroe, Oakland and Washtenaw Counties, July-September 2002. Lansing, MI: MDEQ.74 Adopt-a-Stream monitoring reports. Ann Arbor, MI: HRWC.75 Adopt-A-Stream macroinvertebrate and stream habitat monitoring data. 1994-2006. Ann Arbor, MI: <strong>Huron</strong><strong>River</strong> <strong>Watershed</strong> <strong>Council</strong>.76 MDEQ, Water Bureau. February, 2005. A Biological Survey of the <strong>Huron</strong> <strong>River</strong> <strong>Watershed</strong>: Ingham, Livingston,Monroe, Oakland and Washtenaw Counties, July-September 2002. Lansing, MI: MDEQ.77 MDEQ, Water Bureau. February, 2005. A Biological Survey of the <strong>Huron</strong> <strong>River</strong> <strong>Watershed</strong>: Ingham, Livingston,Monroe, Oakland and Washtenaw Counties, July-September 2002. Lansing, MI: MDEQ.78 MDEQ, Prohibition Zone – Groundwater Use Restrictions; Gelman Sciences, Inc. Unit E Aquifer; 1,4-DioxaneGroundwater Contamination, Washtenaw County Fact Sheet, March 2007.79 Middle <strong>Huron</strong> Nutrient Stream Monitoring reports. Ann Arbor, MI: HRWC.80 MDEQ, Water Bureau. February, 2005. A Biological Survey of the <strong>Huron</strong> <strong>River</strong> <strong>Watershed</strong>: Ingham, Livingston,Monroe, Oakland and Washtenaw Counties, July through September 1997. Lansing, MI: MDEQ.81 MDEQ, Water Bureau. February, 2005. A Biological Survey of the <strong>Huron</strong> <strong>River</strong> <strong>Watershed</strong>: Ingham, Livingston,Monroe, Oakland and Washtenaw Counties, July-September 2002. Lansing, MI: MDEQ.82 MDEQ: March, 2006 (date submitted for approval). E. coli TMDL Implementation <strong>Plan</strong> for Geddes Pond, <strong>Huron</strong><strong>River</strong>. Lansing, MI: MDEQ.83 Adopt-a-Stream monitoring reports. Ann Arbor, MI: HRWC.84 MDEQ, Water Bureau. February, 2005. A Biological Survey of the <strong>Huron</strong> <strong>River</strong> <strong>Watershed</strong>: Ingham, Livingston,Monroe, Oakland and Washtenaw Counties, July-September 2002. Lansing, MI: MDEQ.85 Adopt-A-Stream macroinvertebrate and stream habitat monitoring data. 1994-2006. Ann Arbor, MI: <strong>Huron</strong><strong>River</strong> <strong>Watershed</strong> <strong>Council</strong>.86 MDEQ, Water Bureau. February, 2005. A Biological Survey of the <strong>Huron</strong> <strong>River</strong> <strong>Watershed</strong>: Ingham, Livingston,Monroe, Oakland and Washtenaw Counties, July-September 2002. Lansing, MI: MDEQ.87 Washtenaw County Drain Commission website. “Doyle Park reconstruction.”< http://www.ewashtenaw.org/government/drain_commissioner/brownpark> (date accessed)88 Hancock, Jerry. Mallett’s Creek Restoration Activity Schedule.89 Middle <strong>Huron</strong> Nutrient Stream Monitoring reports. Ann Arbor, MI: HRWC.90 MDEQ: March, 2006 (date submitted for approval). E. coli TMDL Implementation <strong>Plan</strong> for Geddes Pond, <strong>Huron</strong><strong>River</strong>. Lansing, MI: MDEQ.91 Adopt-a-Stream monitoring reports. Ann Arbor, MI: HRWC.92 Adopt-A-Stream macroinvertebrate and stream habitat monitoring data. 1994-2006. Ann Arbor, MI: <strong>Huron</strong><strong>River</strong> <strong>Watershed</strong> <strong>Council</strong>.93 Communication with Steve Kappeler, Environmental Manager at Pfizer Global Research and Development.94 Middle <strong>Huron</strong> Nutrient Stream Monitoring reports. Ann Arbor, MI: HRWC.Ann Arbor-Ypsilanti Metropolitan Area 2-90<strong>Watershed</strong> <strong>Management</strong> <strong>Plan</strong>
95 MDEQ: March, 2006 (date submitted for approval). E. coli TMDL Implementation <strong>Plan</strong> for Geddes Pond, <strong>Huron</strong><strong>River</strong>. Lansing, MI: MDEQ.96 Adopt-a-Stream monitoring reports. Ann Arbor, MI: HRWC.97 Adopt-A-Stream macroinvertebrate and stream habitat monitoring data. 1994-2006. Ann Arbor, MI: <strong>Huron</strong><strong>River</strong> <strong>Watershed</strong> <strong>Council</strong>.98 Middle <strong>Huron</strong> Nutrient Stream Monitoring reports. Ann Arbor, MI: HRWC.99 MDEQ: March, 2006 (date submitted for approval). E. coli TMDL Implementation <strong>Plan</strong> for Geddes Pond, <strong>Huron</strong><strong>River</strong>. Lansing, MI: MDEQ.100 Adopt-a-Stream monitoring reports. Ann Arbor, MI: HRWC.101 Adopt-A-Stream macroinvertebrate and stream habitat monitoring data. 1994-2006. Ann Arbor, MI: <strong>Huron</strong><strong>River</strong> <strong>Watershed</strong> <strong>Council</strong>.102 MDEQ, Surface Water Quality Division. January, 1996. A Phosphorus Loading and Proposed TMDL for Fordand Belleville Lakes, Washtenaw and Wayne Counties, December 1994-November 1995. Lansing, MI: MDEQ.103 MDEQ: Surface Water Quality Division. February, 2002. Nutrients in Ford and Belleville Lakes, Michigan,1998-2000.104 The Middle <strong>Huron</strong> <strong>River</strong> <strong>Watershed</strong> Initiative. January 2001. Annual Report October 1999-December 2000.105 The Middle <strong>Huron</strong> <strong>River</strong> <strong>Watershed</strong> Initiative. 2002. Annual Report 2000-2001.106 The Middle <strong>Huron</strong> <strong>River</strong> <strong>Watershed</strong> Initiative. 2004. Annual Report 2002-2003107 Michigan Department of Environmental Quality (MDEQ), Water Bureau. April, 2005. Nutrient ChemistrySurvey of Ford and Belleville Lakes Washtenaw and Wayne Counties. Lansing, MI: MDEQ.108 MDNR: Fish Collection System. July, 1998. Water Survey: Ford Lake.109 MDEQ, Surface Water Quality Division. January, 1996. A Phosphorus Loading and Proposed TMDL for Fordand Belleville Lakes, Washtenaw and Wayne Counties, December 1994-November 1995. Lansing, MI: MDEQ.110 MDEQ: Surface Water Quality Division. February, 2002. Nutrients in Ford and Belleville Lakes, Michigan,1998-2000.111 The Middle <strong>Huron</strong> <strong>River</strong> <strong>Watershed</strong> Initiative. January 2001. Annual Report October 1999-December 2000.112 The Middle <strong>Huron</strong> <strong>River</strong> <strong>Watershed</strong> Initiative. 2002. Annual Report 2000-2001.113 The Middle <strong>Huron</strong> <strong>River</strong> <strong>Watershed</strong> Initiative. 2004. Annual Report 2002-2003114 Michigan Department of Environmental Quality (MDEQ), Water Bureau. April, 2005. Nutrient ChemistrySurvey of Ford and Belleville Lakes Washtenaw and Wayne Counties. Lansing, MI: MDEQ.115 The Willow Run Creek Site Remediation Project. “Success Through Partnership.”116 Cave, et al.117 Riggs. 2006.118 Lehman, John. “Mass Balance Study of the Middle <strong>Huron</strong> <strong>River</strong> 2003-2004: Highlights of Key Findings to DateRelevant to Middle <strong>Huron</strong> Partners.” http://www.umich.edu/~hrstudy/, April 25, 2005Ann Arbor-Ypsilanti Metropolitan Area 2-91<strong>Watershed</strong> <strong>Management</strong> <strong>Plan</strong>
CHAPTER 3:ACTION PLAN FOR THE MIDDLE HURONWATERSHED______________________________________________________________________________<strong>Watershed</strong> management planning provides the opportunity for communities and otherstakeholders to assess the current condition of their watershed, and also to peer into the futureto see what the watershed will look like if they simply maintain the status quo. The quality of lifethat a community desires for its future residents often does not coincide with the realities of thedirection in which the community is headed.This chapter outlines designated and desired uses of surface waters in the <strong>Watershed</strong>, thethreats (impairments) posed to them, and the sources and causes of those threats. A set ofgoals and objectives has been updated by the Advisory Committee to ensure that thedesignated and desired uses in the watershed will be met. Because surface water quality isultimately a function of what water carries off of the land, much of the discussion will focus onhow human activities impact the land and actions that can be taken to improve human land usefrom a water quality/quantity perspective. These recommended actions are described andsummarized in the Action <strong>Plan</strong> (Table 3.6) at the end of this chapter.3.1 DESIGNATED AND DESIRED USESAccording to the Michigan Department of Environmental Quality, the primary criterion for waterquality is whether or not the water body meets its designated uses. Designated uses arerecognized uses of water established by state and federal water quality programs. In Michigan,the goal is to have all waters of the state meet all designated uses. It is important to note thatnot all of the uses listed below may be attainable, but they may serve as goals toward which thewatershed can move.All surface waters of the state of Michigan are designated for and shall be protected for all of thefollowing uses. 1 The designated uses that apply to the Middle <strong>Huron</strong> <strong>Watershed</strong> are inboldface:• Agriculture• Industrial water supply• Public water supply at the point of intake• Navigation• Warmwater fishery• Other indigenous aquatic life and wildlifeAnn Arbor-Ypsilanti Metropolitan Area 3-1<strong>Watershed</strong> <strong>Management</strong> <strong>Plan</strong>
• Partial body contact recreation• Total body contact recreation between May 1 and October 31• Coldwater fisheryDue to human impacts and the impairments they cause throughout the Middle <strong>Huron</strong><strong>Watershed</strong>, not all of the designated uses are fulfilled. The following is a summary of the majorimpairments to the watershed, which are discussed in more detail in Chapter 2:The warmwater fishery is impaired due to elevated levels of PCBs in Barton Pond, Fordand Belleville Lakes, and an unnamed lake. The PCB levels also impair the public water supplyintake in Barton Pond. High mercury levels in fish tissue samples from Second Sister Lake andthe unnamed lake also impair the warmwater fishery. The fishery is also damaged by habitatimpairments in Malletts Creek. Other indigenous aquatic life and wildlife is impaired in thewatershed due to poor macroinvertebrate communities in portions of Swift Run and MallettsCreek. Partial or total body contact is impaired in the <strong>Huron</strong> <strong>River</strong> between the Argo andGeddes Dams, and in a section of Honey Creek due to periodic high pathogen counts,specifically Eschrichia coli (E. coli) bacteria. Aquatic life and warmwater fisheries may bethreatened throughout the watershed as high nutrient loads have been cited within aphosphorus TMDL that has been established for the watershed draining to Ford and BellevilleLakes. High nutrient loads can lead to low dissolved oxygen levels and cause nuisance algalblooms in such lake environments.In addition to state-designated uses, the residents of the watershed wish to use its surfacewaters in ways that are not yet achievable. The following desired uses have been identified bythe communities in the watershed over the course of the development and updating of theWMP:• Coordinated developmentPromote a balance of environmental and economic considerations through intentionalcommunity planning and coordinated development within and among the Middle <strong>Huron</strong>communities.• Hydrologic functions of natural featuresProtect and enhance natural features related to water quantity and quality, includingwetlands, floodplains, riparian buffer zones, and stream channels that regulate the flowof stormwater runoff, protect against flooding, and reduce soil erosion andsedimentation.• Open space, recreation and urban amenitiesProtect priority natural habitat, recreational areas and trails, agricultural lands, and urbanopen spaces from development in order to maintain their natural functions, preserverural character, and enhance recreational opportunities for present and futuregenerations.3.2 IMPAIRMENTS, THEIR SOURCES, AND THEIR CAUSESVarious pollutants, or impairments, to the water quality of the <strong>Huron</strong> <strong>River</strong> and its tributaries arefound throughout the Middle <strong>Huron</strong> <strong>Watershed</strong>, which present challenges to meeting thedesignated and desired uses. Analysis of existing data indicates that the Middle <strong>Huron</strong><strong>Watershed</strong> has areas of medium-quality and low-quality waters that require mitigation of existingAnn Arbor-Ypsilanti Metropolitan Area 3-2<strong>Watershed</strong> <strong>Management</strong> <strong>Plan</strong>
impairments. This section summarizes current impairments in the watershed and identifies thesources and causes of those impairments. The authors, with assistance from the AdvisoryCommittee have compiled and updated the information necessary to identify and understandthese impairments and their sources and causes, as well as to prioritize them from greatest toleast threat. This prioritization of impairments is based upon the results of analysis of existingdata, Advisory Committee member observations, and citizen input. Although the partners in thisplan intend to address all of these challenges in the long term with targeted programs, it hasbeen important to rank the most pressing concerns in the watershed so that resources can bespent cost-effectively in a phased approach. Table 3.1 presents this prioritized listing ofimpairments, sources, and causes in the Middle <strong>Huron</strong> <strong>Watershed</strong>.The sources and causes of each impairment in Table 3.1 are presented in priority order, basedon the availability of data indicating direct linkages and assessments of the degree ofcontribution to the chain from cause to impairment. Known causes (k) are listed beforesuspected causes (s). Known impairments, sources or causes are defined as those wherethere exists direct data (i.e. a study or observation) or information establishing a connection.Elements listed as suspected are those for which a connection is implied by land use analysis,anecdotal evidence or common sense. In cases where impairments, sources, or causes weresuspected since not enough information was known about them, effort was made to gatheradditional information. Methods ranged from field work to desktop analyses using a geographicinformation system, to review of available literature and water quality studies. While much datawas compiled to eliminate most suspected items in the table below, some items require furtherinvestigation to confirm their presence in the watershed and/or determine the extent to whichthey are hindering the designated uses in the watershed. As additional information is obtainedthat indicates that a lower ranked impairment, source or cause should be elevated in priority, thepriority ranking should be adjusted to reflect the new information.3.2.1 Excess PhosphorusA certain amount of nutrients are found in water resources naturally. In excess, nutrients cancause aquatic systems, both flowing and impounded,to become out of balance favoring certain organismsover others and changing the function, use and lookof creeks, ponds and the river. Phosphorus is theprimary nutrient of concern in the Middle <strong>Huron</strong><strong>Watershed</strong> because phosphorus is usually thelimiting growth factor for algae and other nuisanceplants in Michigan aquatic ecosystems. When excessphosphorus enters waterways from excess fertilizeror other sources, it encourages the acceleratedgrowth of plants and algae, reducing the dissolvedoxygen and light entering the water and creating anenvironment where it is difficult for most fish andaquatic insects to live. High nutrient concentrationsExcess phosphorus from nonpoint sourcesencourages algae blooms. Photo: HRWCwith boating.interfere with recreation and aesthetic enjoyment ofwaterbodies by causing reduced water clarity,unpleasant swimming conditions, foul odors, bloomsof toxic and nontoxic organisms, and interferenceAnn Arbor-Ypsilanti Metropolitan Area 3-3<strong>Watershed</strong> <strong>Management</strong> <strong>Plan</strong>
Due to the persistent and systemic presence of high concentrations of phosphorus in Ford andBelleville Lakes, as well as the <strong>Huron</strong> <strong>River</strong> and tributaries upstream in the watershed, highnutrient loading is the top challenge identified in this <strong>Plan</strong>. A TMDL for excessive phosphorusloading from point and nonpoint sources has been established for Ford and Belleville Lakes andtheir contributing waters. While the flowing <strong>Huron</strong> <strong>River</strong> and its tributaries do not generally showsigns of excessive phosphorus concentrations, the impoundments along these waterways tendto act as sinks for phosphorus loading, which can lead to eutrophic conditions. Sources ofphosphorus in the watershed include: fertilizers from lawns, golf courses, and croplands; failingseptic systems; sediment and eroded soils; pet/wildlife wastes; illicit connections betweensanitary sewers and storm drains; wastewater treatment plants; and contributions from MillCreek and the <strong>Huron</strong> <strong>River</strong> upstream. Most of these sources are associated with existing ornewly developed areas, which continue to increase and therefore are a source of additionalnutrient loads on water bodies in the watershed. Eroded soils can serve as significant sourcesof phosphorus to streams since the nutrient bonds with particles in the soil.3.2.2 Altered HydrologyHydrology refers to the study of water quantity and flow characteristics in a river system. Howmuch and at what rate water flows through a river system, and how these factors compare tothe system’s historic or “pristine” state, are critical in determining the long-term health of thewaterway. In a natural river system, precipitation in the form of rain or snow is intercepted by theleaves of plants, absorbed by plant roots, infiltrated into groundwater, soaked up by wetlands,and is slowly released into the surface water system. Very little rainwater and snowmelt flowsdirectly into waterways via surface runoff because there are so many natural barriers inbetween.Undercut banks are a sign of flashy flowsPhoto: HRWCgroundwater seeps.When vegetated areas are replaced by roads,rooftops, sidewalks, and lawns, a largerproportion of rainwater and snowmelt fallsonto impervious (hard) surfaces. In lessdeveloped areas, this stormwater runoff flowseither into roadside ditches that drain to thenearest creek, or, in the more denselydeveloped areas, it flows into a system ofstorm drainpipes that eventually outlet to thecreek. During a rain event, this increasedrunoff causes the flow rate of the creek toincrease dramatically over a short period oftime, resulting in what is referred to as “flashyflows.” In addition to rapidly increasing flowsduring storm events, the increase inimpervious surface also decreases baseflows during non-storm conditions becauseless water infiltrates into the ground to beslowly released into the creek viaExtreme flashiness can lead to rapid erosion of streambanks (especially in areas where thestreambank vegetation has been removed or altered) and sedimentation. These impacts createunstable conditions for the macroinvertebrates and fish. Directly connected imperviousAnn Arbor-Ypsilanti Metropolitan Area 3-4<strong>Watershed</strong> <strong>Management</strong> <strong>Plan</strong>
landscapes pose a significant problem to hydrology. An example of a directly connectedimpervious surface is a rooftop connected to a driveway via a downspout that is then connectedto the street where stormwater ultimately flows into the storm drain and into local creeks andstreams.The <strong>Huron</strong> <strong>River</strong> and its tributaries in the Middle <strong>Huron</strong> <strong>Watershed</strong> have been alteredsubstantially by wetlands drainage, stream channelization, dam construction, deforestation, andurbanization. These activities have affected the hydrology of the <strong>Huron</strong> <strong>River</strong> and its tributaries:flow volume and flow stability have changed substantially, along with channel morphologicalfeatures, such as gradient and shape. The extensive network of dams and lake controlstructures, developed areas, engineered drains, and construction sites all play a role inproducing flashy, sediment-laden flows. These hydrologic alterations are particularly significantproblems in Millers Creek, where streambanks have been severely eroded; Malletts Creek,where fish and macroinvertebrate habitat have been severely degraded to require a TMDL to beestablished; and Allens Creek, where most of the creek has been engineered into undersizeddrains leading to potentially severe future flooding and further impacts on the <strong>Huron</strong> <strong>River</strong>downstream of its outlet.3.2.3 SedimentWhile some sedimentation in a river system is natural, as the streambanks in one area erodeand the soil is deposited downstream, the Middle <strong>Huron</strong> experiences heavy sedimentation onthe <strong>Huron</strong> main-stem, its tributaries, and lakes and impoundments. Impacts of soil erosion andsedimentation on downstream water resources include decreased aesthetic quality withincreased turbidity, decreased light penetration and decreased plant growth, and decreasedaquatic habitat quality with sediment covering and clogging gills of fish and aquatic insects andsediment islands blocking fish migration. In addition, nutrients and other pollutants often bondwith soil particles, increasing the detrimental impacts of sedimentation on water resources.Many streambeds in the <strong>Huron</strong> <strong>River</strong> system are naturally composed of sand, gravel, andcobble. However, a problem arises when a dramatic shift from these coarse materials to morefine sediments occurs. Silt (fine-grained sediment) content in bottom composition is animportant factor when examining a creek’s habitat quality. Silt is smaller than sand and largerthan clay. Dramatic increases in fine sediment suggest unnaturally high erosion rates.Excessive deposits of fine sediment are known to impair macroinvertebrate communities. Thisis occurring in a number of locations in the Middle <strong>Huron</strong>, including Honey Creek, lower MillersCreek, Malletts Creek, Swift Run and Superior Drain. TMDLs for macroinvertebrate habitatdegredation have been established for Malletts Creek and Swift Run. Numerous other siteswith sediment problems likely exist, but have not been reported or documented.Increased stormwater flows result in increased sediment loadings for a variety of reasons. Soilparticles are picked up by stormwater as it flows over roads, through ditches, and off of bridgesinto surface waters. Increased flows from stormwater runoff or dam discharge have enoughenergy to scour soils and destabilize stream banks, carrying bank sediments downstream. Inaddition, runoff from some construction sites can be sources of sediment. This problem arises ifproper soil erosion and sedimentation controls are not in place on bare soil that has beenexposed during the construction process. Sediment enters the water at bridges as a result ofinadequate construction and maintenance practices, and via road ditches, which conveysediment from unpaved roads into the stream. Other sources of sediment include wash-off frompaved streets and parking lots. Active agricultural land may be a source of concern in the ruralAnn Arbor-Ypsilanti Metropolitan Area 3-5<strong>Watershed</strong> <strong>Management</strong> <strong>Plan</strong>
areas of the watershed since traditional farming practices leave soil bare and tilled at certaintimes of the year, which leaves soil vulnerable to wind and water erosion.3.2.4 PathogensExcess pathogens in water resources can become a public health concern and cause the publicto lose recreational opportunities such as wading and canoeing. Major sources of pathogens,specifically E. coli, in the Middle <strong>Huron</strong> include wildlife living in or near storm drains and outlets,pet and wildlife waste washed into streams from upland areas, failing septic systems, landapplication of untreated waste from these septic systems, and illicit discharges of sanitary wasteinto storm sewers that are mainly located in more urbanized areas.Two stream sections have been identified as impaired by pathogens in the Middle <strong>Huron</strong><strong>Watershed</strong>. The <strong>Huron</strong> <strong>River</strong> mainstem between Argo and Geddes Dams has exhibitedperiodic high E. coli counts. Lower Geddes Pond has consistently exhibited the highest bacteriaconcentrations among all <strong>Huron</strong> <strong>River</strong> reaches in the Ann Arbor area. Geddes Pond is also thereceiving water for three direct tributaries (Millers Creek, Malletts Creek and Swift Run Creek),plus Traver Creek and Allens Creek that enter immediately upstream. Historic data indicate thateach of these tributaries exceed the WQS for pathogens as well. The Washtenaw County DrainCommissioner’s office conducted a study to determine the source of bacteria. DNA samplingwas conducted during one sampling event on August 27, 2002, in the hopes of determiningwhether sources of E. coli were human or non-human (included in Appendix D). Unfortunately,the results were inconclusive. Should additional DNA sampling be conducted, it might be bestperformed earlier in the season (mid-summer perhaps) when E. coli numbers are typicallyhighest, and even better, when the DNA analysis methodology increases in sophistication.Honey Creek from Wagner Road to the outflow into the <strong>Huron</strong> <strong>River</strong> has also been found tohave periodic high E. coli counts. The specific sources of this bacteria has yet to be fullydetermined. Acceptable levels of pathogens are critical to overall water quality and BMPs mustbe implemented to ensure that pathogen levels are maintained or reduced throughout thewatershed. See Appendix D for detailed results of E. coli sampling and analysis.Nearly half of the septic systems in Washtenaw County have reached their service lifeexpectancy. Inspections over the first 18 months of the county’s septic inspection programrevealed:o 18% of the septic systems inspected were failing or inadequate.o One out of every 18 septic systems (5.5%) had an illicit discharge.o 15% of the wells inspected did not have adequate protection againstcontaminants.o One out of every 7 wells tested (14%) showed chemical or bacterialcontamination. 2Septic systems can fail for a number of reasons including inadequate soil conditions, long termuse, and lack of proper maintenance or use. Failing septic systems may allow untreated humanwaste to eventually be discharged to nearby surface waters, where it can affect drinking watersupplies, cause unacceptable water quality, and present a public health risk. In WashtenawCounty, 19% of all inspected septic systems have been found to be non-conforming as part ofits ordinance requiring inspection of all septic systems at time of property transfer. 3 As a meansof comparison, Wayne County also has a time-of-sale septic system inspection ordinance,which has demonstrated a failure rate of 26% of all inspected septic systems between 2000 andAnn Arbor-Ypsilanti Metropolitan Area 3-6<strong>Watershed</strong> <strong>Management</strong> <strong>Plan</strong>
2003. An inspection program in the City of Southfield in Oakland County has shown a failurerate of 20%.Illicit discharges may be broadly defined as the introduction of untreated pollutants into surfacewaters through improperly connected pipes or improper disposal (illegal dumping). Illicitconnections, which can originate in residential or commercial areas, can include floor drains,toilets, or washing machines that are improperly connected to storm drains instead of sanitarysewers. Septic systems that connect to storm drains are also illicit connections. Otherexamples of illicit discharges include pouring used motor oil or holding tank waste from a boat,RV, or mobile home into a storm drain or roadside swale. The frequency of illicit connections isdifficult to estimate accurately. In Oakland County, the Rouge <strong>River</strong> <strong>Watershed</strong> hasimplemented a successful program to detect and eliminate illicit connections, and their findingsindicate that the pollutants carried by these discharges can result in overabundance of E. coli,high ammonia levels, fecal coliform bacteria, phosphorus, and excessive algal growth in surfacewater. In 2004, with 353 facilities dye-tested, 97 illicit connections (24%) were identified. 82 ofthese were discharges related to floor drains.3.2.5 Salts, Organic Compounds and Heavy MetalsSalts typically enter waterways from road salting (de-icing) operations or from water softenerbackwash discharge into the environment. De-icing products, primarily sodium chloride, areused locally by MDOT, county road commissions, homeowners, and business/commercialestablishments. Salts are highly soluble in water and easily wash off pavement into surfacewaters and leach into soil and groundwater. High concentrations of salt can damage and killvegetation, disrupt fish spawning in streams, reduce oxygen solubility in surface water, interferewith the chemical and physical characteristics of a lake, and pollute groundwater making wellwater undrinkable.Salt entering local waterways from road de-icing efforts is a common concern among watershedresidents. However, little data was found regarding salt concentrations in local waterways orimpacts of salts on water quality. Conductivity data collected through the Middle <strong>Huron</strong>Monitoring Program and HRWC’s Adopt-A-Stream program show consistently excessiveconductivity readings in all tributaries except Superior Drain (see Section 2.3.1). These highconductivity readings may suggest the presence of high concentrations of dissolved salt ions,although the extent to which other non-salt ions are influencing the readings is unknown.A study by the USGS in Oakland County on the effects of urban land use change on streamflowand water quality showed a strong positive correlation between salt ions (sodium, potassium,and chloride) and residential and commercial landcovers, as well as overall percentage of thewatershed built, and population density. These ions were negatively correlated with agriculture,open space, forest, and wetland land covers. 4 While it may reasonably stated that the rapidurbanization in the Middle <strong>Huron</strong> <strong>Watershed</strong> has lead to increased salt concentrations in thewater, the extent to which this is occurring and the impacts of these salt concentrations requiresadditional monitoring data and studies.Organic compounds (PCBs, PAHs, DDT, etc.) and heavy metals (lead, copper, mercury, zinc,chromium, cadmium, etc.) can potentially cause adverse impacts on river ecosystems. Thesechemicals and metals can disrupt the physiology of aquatic organisms and can accumulate intheir fatty tissues. Organic chemicals such as PCBs are by-products of manufacturingprocesses and the combustion of fossil fuels. They are also present in automobile fluids such asgasoline and oils. Other organic chemicals are found in pesticides and herbicides. Heavy metalsAnn Arbor-Ypsilanti Metropolitan Area 3-7<strong>Watershed</strong> <strong>Management</strong> <strong>Plan</strong>
are also a common by-product of manufacturing, but these contaminants are also common inagricultural and road runoff.In the watershed, potential sources of organic compounds and heavy metals include urbanareas, roads, permitted industries, existing in-stream contamination from historic activities,chemicals from lawns, and runoff from agricultural operations. Little data exists for organiccompounds and heavy metals in the Middle <strong>Huron</strong>. As discussed in Chapter 2, <strong>Huron</strong> <strong>River</strong>water chemistry data collected in 2002 showed that all contaminants covered under MichiganRule 57 (which includes a variety of organic compounds, trace and heavy metals, and PCBs)were in compliance with water quality values, with the exception of PCBs, which were notmeasured. TMDLs for PCBs in fish tissue leading to fish consumption advisories are scheduledto be established for Barton Pond, Ford and Belleville Lakes and an unnamed lake south ofFord Lake. In addition, the entire <strong>Huron</strong> <strong>River</strong> system is scheduled for a TMDL due to waterquality exceedances for PCBs in Lake Erie. TMDLs for mercury in fish tissue are scheduled tobe established for the unnamed lake and Second Sister Lake. Further data on thesecontaminants will be collected prior to establishment of these TMDLs.3.2.6 Elevated Water TemperatureWater temperature directly affects many physical, biological, and chemical characteristics of awaterbody. Temperature affects the amount of oxygen that can be dissolved in the water; therate of photosynthesis by algae and larger aquatic plants; the metabolic rates of aquaticorganisms; and the sensitivity of organisms to toxic wastes, parasites, and diseases. Thesefactors limit the type of macroinvertebrate and fish communities that can live in a stream.Thermal pollution, the discharge of heated water from industrial operations, dams, orstormwater runoff from hot pavement and other impervious surfaces often cause an increase instream temperature. Suspended sediment loads can also contribute to elevated watertemperatures.All waters in the Middle <strong>Huron</strong> are warmwater fish streams. However, some coldwater fishspecies are found in portions of watershed, and the presence of EPT and sensitive aquaticinsect families at many monitoring sites is an indication of adequately cool stream temperatures.Low flows below impoundments, removal of streambank vegetation, and inputs of stormwaterrunoff (which are typically substantially warmer than base stream flows) are all potentialcontributing factors to elevated water temperatures.3.2.7 Litter/DebrisObservations from Advisory Committee members and watershed residents indicate that debrisand litter is a problem throughout the Middle <strong>Huron</strong> <strong>Watershed</strong>. Debris refers to broken downpieces of materials such as those used in construction while litter refers to strewn trash andwastepaper. The presence of debris and litter reduces the aesthetic value of water resourcesand also poses potential hazards to humans and wildlife. Field observations indicate that thesources of debris and litter include roadways, residential areas, parks, urban areas. Severalgroups in the watershed conduct annual <strong>River</strong> clean-ups to remove litter and debris.3.2.8 Pharmaceuticals and Endocrine DisruptorsA number of international, national and regional studies over the past two decades havedocumented the presence of pharmaceuticals and personal care products (PPCPs) andAnn Arbor-Ypsilanti Metropolitan Area 3-8<strong>Watershed</strong> <strong>Management</strong> <strong>Plan</strong>
endocrine disrupting compounds (EDCs) in surface waters. PPCPs include substances such asdrugs and cosmetics. EDCs are any chemicals that have been shown to interfere with thenormal function of the human endocrine system. Both types of compounds have potentialhuman health and wildlife impacts. Researchers are currently working to evaluate the effects ofenvironmental exposure to PPCPs and EDCs. For this reason, PPCPs and EDCs areconsidered suspected impairments of the watershed within this plan. These substances canenter the environment through a number of routes including: wastewater treatment discharge,industrial discharge, runoff from confined animal feeding operations, and land application ofanimal waste. The U.S. Geological Survey conducted a national study of 139 streams in 30states and found that 80% of those streams contained at least one of the 95 compounds theytargeted. A more targeted study conducted for the City of Ann Arbor assessed city waters for22 compounds of concern. The researchers in that study found that ten of the 22 compoundswere present in the source water in Barton Pond, with four remaining in finished drinking water;and 17 of the 22 compounds were found in wasterwater influent, with 15 compounds makingtheir way into the effluent discharged to the <strong>Huron</strong> <strong>River</strong>. The existing treatment processes forboth drinking water and wastewater reduced the concentrations for most, but not all of the targetcompounds 5 .Table 3.1. Prioritized Impairments, Sources and Causes in the Middle <strong>Huron</strong> <strong>Watershed</strong>Note: k = Known impairments, sources or causes, and s = suspected.Impairment 1: High Nutrient Loading (k)SourcesCauses1. NPDES permitted facilities (k) Nutrients in effluent (k)2. Fertilizers from residential,Lack of buffers (k)commercial, and golf courses (k) Limited nutrient control ordinances (k)Lack of nutrient management plans (k)3. Excessive runoff from developedareas (k)4. Legacy nutrients in lake /impoundment sediment (k)Overuse/improper application of fertilizers (s)Lack of BMPs at existing development areas (k)Impervious surfaces (k)Poor storm drain maintenance (s)Sediment deposition (k)Resuspension during storm events (k)Dissolution during summer stratification (k)5. Illicit discharges (k) Aging sanitary sewer infrastructure (s)Inadequate inspection/detection and repair due tocost (s)Illegal septic application and trailer waste disposal (s)6. Pet and wildlife waste (k) Wildlife in storm drains (k)Improper disposal of pet waste (k)Ponds increase habitat for waterfowl, wildlife (s)7. Failing septic tanks (k) Old units are too small or don’t meet codes (k)Lack of a required maintenance program (k)Poor maintenance/lack of education (s)8. Agricultural runoff from fertilizers/livestock waste (k)Lack of nutrient management plans (k)Lack of BMPs (upland and riparian buffers) (s)Exposed soils (s)Impairment 2: Altered Hydrology (k)Ann Arbor-Ypsilanti Metropolitan Area 3-9<strong>Watershed</strong> <strong>Management</strong> <strong>Plan</strong>
SourcesCauses1. Runoff from developed areas (k) Lack of BMPs at existing development areas (k)Impervious surfaces (k)Removal of woodland/forest, wetlands, and otherpervious areas (k)2. Runoff from construction sites, newdevelopment (k)Removal of woodland/forest, wetlands, and otherpervious areas (k)Decentralized development increasing imperiousness(k)Rerouting channel for development (k)Lack of resources for enforcement/inspection (s)Site exemptions (s)Lack of education on alternatives (s)3. Engineered drains and streams (k) Loss of connection between stream and floodplainfrom channelization (k)Loss of storage and infiltration capacity (k)Removal of riparian buffer (k)4. Impoundment of streams (k) Dam construction (k)Natural damming (k)Impairment 3: Sedimentation, Soil Erosion (k)Sources1. Eroding stream banks and channels(k)CausesFlashy flows (k)Channelization (k)Drain maintenance (k)Eroding crossing embankments (k)Clear cutting/lack of riparian buffers (k)2. Construction sites (k) Clear cutting/lack of riparian buffers (k)Lack of resources for enforcement/inspection (s)Lack of soil erosion BMPs and BMP education (s)Insufficient penalties for noncompliance withordinances (s)Exposed soils (s)Site exemptions (s)3. Developed areas (k) Lack of BMPs at existing development areas (k)Impervious surfaces (k)Clearcutting/lack of riparian buffers (k)4. Dirt, gravel roads (k) Poorly designed/maintained road stream crossings(k)Poor road maintenance (s)5. Sediments in impoundments (k) Legacy sedimentation, settling, then resuspension (k)Ineffective maintenance of dams (s)6. Agricultural field runoff (s) Lack of BMPs (upland and riparian buffers) (s)Exposed soils (s)Impairment 4: Pathogens (k)SourcesCauses1. Pet and wildlife waste (k) Wildlife in storm drains (k)Improper disposal of pet waste (runoff from pavedareas) (k)Ponds increase habitat for waterfowl, wildlife (s)Ann Arbor-Ypsilanti Metropolitan Area 3-10<strong>Watershed</strong> <strong>Management</strong> <strong>Plan</strong>
Impairment 4: Pathogens (k)SourcesCauses2. Illicit Discharges (k) Aging development sanitary sewer infrastructure (k)Illegal septic application and trailer waste disposal (s)Incomplete inspection/detection and repair due tocost (s)Lack of education (s)3. Failing septic tanks (k) Old units are too small or don’t meet codes (k)Lack of a required maintenance program (k)Inadequate enforcement by Health Departments (s)Poor maintenance/lack of homeowner education (s)4. Illegal/improper septage application (s) Lack of adequate septage disposal facilities (s)5. Livestock waste from agricultural Lack of BMPs (s)operations (s)Impairment 5: Salts, Organic Compounds and Heavy Metals (k)SourcesCauses1. Legacy pollution (k) PCBs in Barton Pond, Ford and Belleville Lakes, andunnamed lake (k)Excessive mercury in Second Sister and UnnamedLakes (k)Illegal dumping (s)2. Developed areas (k) Lack of stormwater BMPs (k)Waste incineration (atmospheric deposition) (k)Illegal dumping (s)Illicit connections (s)3. Roads (k) Auto emissions (k)Lack of BMPs during road de-icing (s)Poor road maintenance (s)4. NPDES permitted facilities (s) Inadequate inspection (s)Lack of BMPs (upland and riparian buffers) (s)5. Turfgrass chemicals from residential, Improper lawn care (s)commercial lawns (s)Illegal disposal (s)6. Agricultural runoff (s) Lack of BMPS (upland, riparian buffers) (s)Impairment 6: High Water Temperature (k)SourcesCauses1. Directly connected impervious areas(k)Heated stormwater from urban areas (k)Lack of groundwater recharge (s)2. Eroded soil areas (s) Soil erosion from channel and upland (k)3. Solar heating (s) Lack of vegetated canopy in riparian zone (k)Impairment 7: Debris/Litter (k)Sources1. Roadways, parks, urban areas,residential areas (k)CausesIllegal littering/dumping (s)Unsecured garbage containers and vehicles (s)Inadequate refuse containers (s)Ann Arbor-Ypsilanti Metropolitan Area 3-11<strong>Watershed</strong> <strong>Management</strong> <strong>Plan</strong>
Impairment 8: Pharmaceuticals and Endocrine Disruptors (s)SourcesCauses1. NPDES permitted facilities (k) Human excretion (s)Residential disposal via sewer system (s)Waste from medical facilities (s)2. Septic systems (s) Inadequate containment or treatment (s)3. Landfills (s) Inadequate treatment of leachate (s)4. Livestock waste from agriculturalLack of BMPs (s)operations (s)3.2.9 Overarching ChallengesSeveral overarching challenges play a role in generating the impairments discussed above.Addressing these challenges is a prerequisite to mitigating the sources and causes of theimpairments in order to reach the designated and desired uses in the Middle <strong>Huron</strong> <strong>Watershed</strong>.Land Use ChangesNew development along surface waters oftenincreases the amount of nonpoint sources ofpollution in the waterbody. Photo: HRWChigh development pressure. 8Perhaps the greatest concern and threat to waterquality degradation in the watershed is land usechange. Between 1982 and 1992, Michigan lostapproximately 854,000 acres of farmland to suburbandevelopment, which is comparable to losing the areaof 3.75 Michigan townships per year. 6 Moreover, theconversion of farmland to other uses acceleratedfrom 1992 to 1997 by 67% over the previous 5-yearperiod. 7 The economic impact of such changes inland use is potentially significant. In fact, theMichigan Economic and Environmental Roundtable(2001) estimates that the state loses $66 billion ofeconomic output annually from decreased tourismand recreation, farming, forestry, and mining due topoorly planned suburbanization. The U.S.Department of Agriculture considers much ofsoutheast Michigan to be high-quality farmland facingWhen land is converted from natural areas and low-density use, as in a rural area, to a moreintensive use such as medium density residential or commercial land use, water quality andquantity can be negatively impacted. Increased flow rates and velocities, increased stormwaterpollutants, as well as a decrease of natural areas can lead to sedimentation, stream bankerosion, loss of wildlife habitat, water temperature increase, algal blooms, decreased dissolvedoxygen and other impacts.Loss of Natural FeaturesThe loss of natural features often goes hand in hand with new development. Natural features -including groundwater recharge areas, woodlands, wetlands, watercourses, permeable soils,vegetative buffers, and steep slopes – provide many natural functions in the landscape withregard to protecting water quality, regulating water quantity and providing wildlife habitat toreceiving watercourses. In natural areas, most of the stormwater is infiltrated and utilized whereAnn Arbor-Ypsilanti Metropolitan Area 3-12<strong>Watershed</strong> <strong>Management</strong> <strong>Plan</strong>
it falls, allowing most pollutants to be filtered through soils. When these areas are lost and theirfunctions are not replaced (with infiltration, detention or restoration measures), nearby waterresources are impacted negatively with increased flow and increased pollutant loads.Areas where riparian vegetation is still fairly intact should be prioritized for preservation andrestoration based on the critical importance of this natural feature to the whole <strong>Huron</strong> <strong>River</strong>watershed. Riparian vegetation has many benefits to water resources, including stream bankstabilization, terrestrial and aquatic wildlife habitat structure, and shading and cooling of water.The impacts of losing riparian vegetation include the increase of stream bank erosion, loss ofhabitat and warmer water, which could threaten the survival of fish and aquatic insects.Studies indicate that half of the state's inland wetlands and 70% of the coastal wetlands nolonger exist. 9 Permitted fills for commercial and industrial development, housing, roads,agriculture, and logging claim an estimated 500 acres of wetlands statewide each year. The<strong>Huron</strong> <strong>River</strong> <strong>Watershed</strong> has lost approximately 66% of its wetlands to human activities. Thisgreat change in the landscape has the potential to contribute to increased flooding, loss ofproperty values, water pollution, and diminished and fragmented wildlife habitat. Wetlandssmaller than 5 acres or not within 500 feet of another waterbody are not regulated by the state.Such wetlands often serve as many or more important functions than do the larger wetlands. 10Therefore, local protection of these systems is necessary.Need for Public Awareness and ActionA general lack of awareness exists regarding the wide range of behaviors and policies thataffect water quality, and a misperception exists about who contributes to the pollution in thewatershed. For example, the basic concept of a watershed is not grasped by a majority of thepublic. Likewise, many people are unaware that storm drains lead directly to surface waterswithout treatment of stormwater. Another common misperception is that point sources such aswastewater treatment plants and industrial facilities, rather than nonpoint sources, areresponsible for a majority of the pollutants in our waterways. Such misperceptions lead tocomplacent attitudes and a lack of personal responsibility, which in turn translate into a lack ofcommunity-based action to protect and restore local water resources. The impact of this lack ofawareness and action has direct and indirect consequences. Directly, it encourages the furtherdegradation of the resource by continuing to allow stormwater runoff and pollutants into ourwaterways. Indirectly, lack of public awareness and action can lead to a lack of interest by localdecision-makers and thus lack of initiatives, programs, policies, and funding to either protect orrestore water resources.Need for Administrative Support and Institutional and Financial ArrangementsThe communities within the Middle <strong>Huron</strong> <strong>Watershed</strong> have made commitments to protect andrestore water resources with a broad spectrum of projects and programs. There is acorresponding need for additional support within these communities in order to implement,document and report on the various aspects of these increased responsibilities. Somecommunities have responded to this need to integrate stormwater projects and education intotheir regular activities by contracting with a consultant or hiring new personnel. With this needfor additional support comes a need for additional funding. Creative partnerships, new fees, andgrant funds need to be explored. The potential impact of inadequate program support, financialresources and institutional arrangements is the failure to create and implement programs,policies and projects that ensure the designated and desired uses.Monitoring Programs and DataAnn Arbor-Ypsilanti Metropolitan Area 3-13<strong>Watershed</strong> <strong>Management</strong> <strong>Plan</strong>
Integrated and coordinated water quality monitoring needs to be more firmly established withinthe watershed. Review of readily available and relevant data reveals a number of concerns. Insome cases, studies and data significant to water quality decisions are only minimallydistributed within the area of interest. In other cases, existing datasets are not complete enoughto be used as a basis for watershed decisions. Other datasets are nearly non-existent,especially those dealing with emerging issues such as the presence or absence of endocrinedisrupting compounds (EDCs) in the water, sediments, and biota. The wide range of EDCsincludes birth control pills, steroids, pesticides, inorganics, and industrial chemicals. In addition,the quality of some of the existing data causes concerns, given that the qualityassurance/quality control (QA/QC) protocols of sampling parties is unknown. The type of datathat has been historically collected is often not useful for answering the key questions about thewatershed. Moreover, the lack of time-series data prohibits the detection of trends.3.3 GOALS AND OBJECTIVES FOR THE MIDDLE HURON WATERSHEDThe designated and desired uses for theMiddle <strong>Huron</strong> <strong>Watershed</strong> provide a basisfrom which to build long-term goals andobjectives. Long-term goals describe thefuture condition of the watershed towardwhich the Middle <strong>Huron</strong> communities willwork. Long-term goals are not expected tobe met within the first five years of planimplementation, but are to be met at sometime beyond the first five years ofimplementation. The long-term goals havebeen developed on a watershed-widebasis and are also based on creating themost effective solutions to address thehighest priority impairments, sources and causes in the watershed. No single community oragency is responsible for achieving all of the goals or any one of the goals on its own. The goalsrepresent the desired end product of many individual actions, which will collectively protect andimprove the water quality, water quantity and biology of the watershed. The communities of theMiddle <strong>Huron</strong> <strong>Watershed</strong> will strive together to meet these long term goals to the maximumextent practicable by implementing a variety of BMPs over time, as applicable to the individualcommunities and agencies, relative to their specific priorities, individual jurisdictions, authority,and resources.Due to the complex ecological nature of the response of watersheds to management practices,it is difficult to predict when these goals will be met. Some of the administrative long-term goalsmight realistically be met in the next few years, whereas some of the ecological goals willrequire more study and improvements, and may ultimately take many years to achieve. Ratherthan attempting to predict when these goals will be achieved, the partners will continuouslystrive to meet these goals by implementing best management practices (BMPs) that arerecommended for addressing the goals. The watershed partners will understand what progressis being made to achieve these goals by using an iterative process of implementing BMPs andevaluating the effects of these BMPs by regularly monitoring the river for change and degree ofimprovement. Indeed much progress has been made since this WMP was originally drafted in1996 and then updated in 2000. Please see Chapter 4 for a summary of progress that hasbeen made.Ann Arbor-Ypsilanti Metropolitan Area 3-14<strong>Watershed</strong> <strong>Management</strong> <strong>Plan</strong>
The long-term goals and objectives as agreed upon by the Advisory Committee are presented inTable 3.2. Short-term objectives are presented for each goal, and will be partially or whollyfulfilled within five years of implementation of this updated plan. Progress has already beenmade toward the achievement of many of these objectives at this point. Long-term objectivesare developed for some of the goals, and may be partially fulfilled during the first five years ofplan implementation, but realistically will be fulfilled in subsequent implementation phases.The goals and objectives are listed in priority order. These priorities were determined indiscussion with the Advisory Committee after reviewing the previous version of this plan,progress made to date, and the current list of priority impairments, sources and causes, all ofwhich is based on analysis of relevant data as presented in previous sections of this plan. TheCommittee determined that the combined actions implied by these goals and objectives wouldbe the most effective way to address high-priority watershed impairments.Table 3.2. Prioritized Goals and Objectives for the Middle <strong>Huron</strong> <strong>Watershed</strong>, and theDesignated and Desired Uses They Address(Short Term = within five years; Long Term = Beyond five years)Long-Term Goal Short-Term Objective Uses Addressed1. Reduce flowvariability2. Reducenonpointsource loadingand reduce soilerosion andsedimentationa. Adopt County and local stormwatermanagement requirements that minimize flowfluctuations in receiving waterways, andassociated bank erosion, channel widening andhabitat destruction.b. Encourage local ordinances, strategies andprograms that:1. Prevent unnecessary modification of the<strong>Huron</strong> <strong>River</strong>, its tributaries and adjacentriparian areas.2. Maintain and restore hydraulic function offloodplains and floodways by discouraging theiralteration and encouraging restoration.c. Promote local site planning review standardsthat favor utilization of stormwater as an on-siteresource.d. Monitor flow dynamics of the river andtributaries through established monitoringprogram.Long-Term Objectivese. Preserve natural infiltration and the recharge ofgroundwater, by protecting and restoring openspaces and natural recharge areas, installinginfiltration BMPs, and reducing the amount ofimpervious area.f. Meet TMDL goals for biota in Mallets Creek andSwift Run.Short-Term Objectivea. Adopt County and local stormwatermanagement requirements that minimize pollutantloading to receiving waterways by capturing andtreating or infiltrating the smaller, more frequentstorm event.Designated Uses:Warmwater fishery,Aquatic life andwildlifeDesired Uses:Coordinateddevelopment;Hydrologic functionsDesignated Uses:Warmwater fishery;aquatic life andwildlife; partial andtotal body contactrecreation; industrialAnn Arbor-Ypsilanti Metropolitan Area 3-15<strong>Watershed</strong> <strong>Management</strong> <strong>Plan</strong>
3. Protect andmitigate loss ofnatural featuresfor stormwatertreatment andwildlife habitat4. Increase publicawareness andinvolvement inprotectingwaterresourcesb. Encourage local ordinances, strategies andprograms that:1. Minimize the adverse effects of stormwaterrunoff from new highways and streets.2. Encourage the use of native landscapes andreduced dependence on chemical applications.c. Promote local site planning review standardsthat foster a hierarchy to guide the selection ofstormwater management approaches and favorssource reduction.d. Maintain stable oxygen levels in thehypolimnion of Ford and Belleville Lakese. Improve application and enforcement of soilerosion and sediment controls both during andafter construction activity.f. Identify and repair the most eroded andsusceptible stream channels and banks.g. Maintain water quality monitoring programs tomeasure progress toward TMDL goals.h. Maintain baseline monitoring of sedimentationin the <strong>River</strong> and tributaries.i. Increase education on BMPs among propertyowners and developers.Long-Term Objectivesk. Meet TMDL goals for phosphorus concentrationin Ford and Belleville Lakesl. Meet TMDL goals for pathogens in GeddesPond and Allens Creekm. Increase clarity in surface waters.Short-Term Objectivesa. Encourage local ordinances, strategies andprograms that:1. Preserve natural infiltration and the rechargeof groundwater, by protecting and restoringopen spaces and natural recharge areas,and reducing the amount of impervious area.2. Promote buffering of waterways from thedirect impacts of stormwater-relatedpollution.b. Monitor water quality and biota to measureprogress.c. Educate local decision makers and the publicabout the benefits of critical habitat protection.Long-Term Objectivesd. Meet TMDL goals for biota in Malletts Creekand Swift Run.Short-Term Objectivesa. Conduct on-going programs to raise the publicand practitioners’ awareness of watershedmanagement and nonpoint pollution issues andsolutions.b. Increase opportunities for public involvement inthe protection of watershed resources.Long-Term Objectivec. Reduce pollution and hydrologic impacts to thewater supply; publicwater supplyDesired Uses:Coordinateddevelopment;hydrologic functionsDesignated Uses:Warmwater fishery;aquatic life andwildlife; industrialwater supply; publicwater supplyDesired Uses:AllDesignated Uses: allDesired Uses: allAnn Arbor-Ypsilanti Metropolitan Area 3-16<strong>Watershed</strong> <strong>Management</strong> <strong>Plan</strong>
5. Gain broadimplementationof watershedmanagementplan andassociatedplans6. Continuemonitoring anddata collectionfor waterquality, waterquantity andbiologicalindicatorswatershed by increasing public awareness andbehavior change.Short-Term Objectivea. Promote intergovernmental coordination andcooperation in land use planning, natural resourceprotection, nonpoint source pollution control andstormwater management.b. Establish financial and institutionalarrangements for WMP fulfillmentc. Ensure the long-term viability of the Middle<strong>Huron</strong> Partnership Initiative.d. Increase public awareness of progress in WMPimplementation.Short-Term Objectivesa. Maintain an adaptive monitoring strategy thatyields data to measure progress towardachievement of WMP goals and objectives.b. Develop a comprehensive database, using thebest available and most appropriate technology,to serve the stormwater management, floodcontrol and water quality planning and monitoringinformation needs of the watershed.c. Track and report on short- and long-termmaintenance of public and private stormwaterconveyance and storage facilities.Designated Uses: allDesired Uses: allDesignated Uses: allDesired Uses: all3.4 WATERSHED MANAGEMENT ALTERNATIVESOnce the current conditions were identified and reviewed –specifically, the priority list of impairments, sources andcauses – the existing management approaches werereviewed. <strong>Management</strong> practices recommended fromprevious plans and other subwatershed plans werereviewed and considered. Participating communities alsosubmitted their Phase II stormwater plans forconsideration. The authors and Advisory Committeeidentified existing ordinances, policies, and practices thatcontribute to the group’s vision of a healthy watershed, aswell as gaps and inconsistencies that present opportunitiesfor improvement. Understanding current managementprovides a starting point for identifying alternatives toimprove protection of critical sensitive areas and mitigationof critical degraded areas. It is also important to considerpractices that have been unsuccessful or difficult toimplement, so as to seek better ways to address the underlying concerns.3.4.1 Selection of <strong>Management</strong> Alternatives (Menu of Best <strong>Management</strong>Practices)In the field of watershed management, management alternatives to address the sources andcauses of the challenges are called Best <strong>Management</strong> Practices, or BMPs. BMPs cover a broadAnn Arbor-Ypsilanti Metropolitan Area 3-17<strong>Watershed</strong> <strong>Management</strong> <strong>Plan</strong>
ange of activities that vary in cost, effectiveness, and feasibility, depending on a complex set offactors. A stormwater best management practice is a technique, measure, or structural controlthat is used for a given set of conditions to manage the quantity and improve the quality ofstormwater runoff in the most cost effective manner. BMPs fall into one of three categories:Structural BMPs are engineered and constructed systems that improve the quality and/orcontrol the quantity of runoff such as detention ponds and constructed wetlands. StructuralBMPS are inherently site-specific and are designed to treat or manage stormwater at a specificlocation.Vegetative BMPs are natural processes that preserve existing vegetation or establish groundcover to minimize soil erosion. Vegetative BMPs are sometimes considered as a sub-set ofstructural BMPs.Non-structural BMPs, also known as Managerial BMPs, consist of institutional, educational orregulatory pollution prevention practices designed to limit the generation of stormwater runoff orreduce the amounts of pollutants contained in the runoff.No single BMP can address all water quality problems. Each practice has certain limitationsbased on drainage area served, available land space, cost, pollutant removal efficiency, as wellas a variety of site specific factors such as soil types, slopes, depth of groundwater table, etc.Careful consideration of these factors is necessary in order to select the appropriate group ofBMPs for a particular location or situation.Structural PracticesStructural stormwater BMPs are physical systems that are constructed for a development – newor existing – that reduce the stormwater impact of development. Such systems can range fromunderground, in-line storage vaults to manage peak flows, to slightly graded swales vegetatedwith wildflowers to slow flows as well as treat pollutants. Structural BMPs can be designed tomeet a variety of goals, depending on the needs of the practitioner. In existing urbanized areasand for new developments, structural BMPs can be implemented to address a range of waterquantity and quality considerations. Because the effect of these physical systems can often bequantitatively measured by monitoring inflow and outflow parameters, recent studies havesuggested certain pollutant removal efficiencies of various BMPs. These data are summarizedin table 3.4.Residential stormwater BMPs, most of which are designed to reduce stormwater runoff viacapture and later use by homeowners, or via enhanced onsite infiltration, have severaladvantages: they can be readily applied in older development areas where space for drainagearea BMPs is often limited; they are often low in cost, easily installed and maintained; and theyact as educational vehicles for pollution reduction. Some examples of such practices includerain barrels (cisterns), rainwater gardens, concrete grid (porous pavers) walkways, andvegetated roofs. The application of individual homeowner BMPs can sometimes be variable andyield uncertain pollutant removal rates. However, the importance of individual homeowner BMPsand managerial BMPs should not be discounted, and recommendations for implementation areprovided below.No single BMP type is ideally suited for every situation and each brings with it variousperformance, maintenance and environmental advantages and disadvantages. BMPs whichconsistently achieve moderate to high levels of removal for particulate and soluble pollutantsinclude: wet ponds, sand filters, and infiltration trenches. Wet ponds have demonstrated aAnn Arbor-Ypsilanti Metropolitan Area 3-18<strong>Watershed</strong> <strong>Management</strong> <strong>Plan</strong>
general ability to continue to function as designed for relatively long periods of time withoutroutine maintenance. BMPs which are generally not capable of predictable pollution reductionrates until their fundamental design is improved or modified include: infiltration basins, grassfilters and swales, and oil/grit separators. 11Ann Arbor-Ypsilanti Metropolitan Area 3-19<strong>Watershed</strong> <strong>Management</strong> <strong>Plan</strong>
Table 3.4. Pollutant Removal Efficiencies for Stormwater Best <strong>Management</strong> Practices<strong>Management</strong>PracticeHigh-powered streetsweepingRiparian buffersVegetated roofsVegetated filterstrips (150ft strip)TotalPhosphorusTotalNitrogen30-90% 45-90%forested: 23-42%; grass:39-78%forested:85%;grass: 17-99%Pollutant Removal EfficienciesTSS Metals Bacteriagrass:63-89%Oil andGreaseNote: 70-100% runoff reduction, 40-50% of winter rainfall. 60% temperaturereduction. Structural addition of plants over a traditional roof system.40-80% 20-80% 40-90%Bioretention 65-98% 49% 81% 51-71%Wet extendeddetention pond48 - 90% 31-90% 50-99% 29-73% 38-100% 66%Constructed wetland 39-83% 56% 69%Infiltration trench 50-100% 42-100% 50-100%(-80)-63%76%Infiltration basin 60-100% 50-100% 50-100% 85-90% 90%Grassed swales 15-77% 15 - 45% 65-95% 14-71%Catch basin inletdevicesSand and organicfilter30-40%sand filter30-90%41-84% 22-54% 63-109%26-100%(-50) -(-25)%(-23) - 98%Stabilize soils onconstruction sitesSediment basins ortraps at constructionsites80-90%65%Sources: Claytor, R. and T. R. Schueler. 1996. Design of Stormwater Filtering Systems. Center for <strong>Watershed</strong> Protection, EllicottCity, MD.Ferguson, T., R. Gignac, M. Stoffan, A. Ibrahim and J. Aldrich. 1997. Cost Estimating Guidelines, Best <strong>Management</strong>Practices and Engineered Controls. Rouge <strong>River</strong> National Wet Weather Demonstration Project.Brown, W. and T. Schueler. 1997. National Pollutant Removal Performance Database for Stormwater BMPs. Center for<strong>Watershed</strong> Protection, Ellicott City, MD.Schueler, T. R. and H. K. Holland. 2000. The Practice of watershed Protection. Center for <strong>Watershed</strong> Protection, EllicottCity, MD.Tetra Tech MPS. 2002. Stormwater BMP Prioritization Analysis for the Kent and Brighton Lake Sub-Basins, Oakland andLivingston Counties, Michigan.Tilton and Associates, Inc. 2002. Stormwater <strong>Management</strong> Structural Best <strong>Management</strong> Practices – Potential Systems forMillers Creek Restoration. Ann Arbor, MI.U.S. EPA. 2002. National Menu for Best <strong>Management</strong> Practices for Storm water Phase II.Ann Arbor-Ypsilanti Metropolitan Area 3-20<strong>Watershed</strong> <strong>Management</strong> <strong>Plan</strong>
Information regarding the pollutant removal efficiency, costs, and designs of structuralstormwater management alternatives is evolving and improving constantly. As a result,information contained in Table 3.4 is dynamic and subject to change. While potential locationsare recommended for some management alternatives in the Action <strong>Plan</strong>, general guidelines canbe consulted for their common sense placement. The location guidelines shown in Table 3.5 areadapted from the Rapid <strong>Watershed</strong> Assessment Protocol of the Center for <strong>Watershed</strong>Protection.Table 3.5. General Guidelines for Locating BMPsAmount ofDevelopmentUndeveloped Developing DevelopedPhilosophy Preserve Protect RetrofitAmount ofImpervious Surface< 10 % 11 - 26 % > 26 %Water quality Good Fair Fair-PoorStream biodiversity Good-Excellent Fair-Good PoorChannel stability Stable Unstable Highly unstableStream ProtectionObjectivesWater qualityobjectivesBMP selection anddesign criteriaPreserve biodiversity;channel stabilityMaintain key elements ofstream qualitySediment and temperature Nutrients and metals BacteriaMaintain pre-developmenthydrologyMinimize stream warmingand sedimentEmphasize filtering systemsMaintain pre-developmenthydrologyMaximize pollutant removal,remove nutrientsEmphasize filtering systemsMinimize pollutantloads delivered todownstream watersMaximize pollutantremoval and quantitycontrolRemove nutrients,metals and toxicsExample locationsRural headwater areas likeparts of Scio, Lodi andWebster TwpsSuburban and developingareas like Pittsfield, Suprior,and Scio TwpsHeavily urbanizedareas like Ann Arborand YpsilantiNon-Structural PracticesNon-structural stormwater BMPs include managerial, educational, and regulatory practicesdesigned to prevent pollutants from entering stormwater runoff or reduce the volume ofstormwater requiring management. These BMPs focus on modifying behaviors and practicesthrough education programs, public involvement programs, land use planning, natural resourceprotection, regulations, operation and maintenance, or any other initiative that does not involvedesigning and building a physical stormwater management mechanism. Although most of thesenon-structural BMPs are difficult to measure quantitatively in terms of overall pollutant reductionand other stormwater parameters, research demonstrates that these BMPs have a large impacton changing policy, enforcing protection standards, improving operating procedures andchanging public awareness and behaviors to improve water quality and quantity in a watershedAnn Arbor-Ypsilanti Metropolitan Area 3-21<strong>Watershed</strong> <strong>Management</strong> <strong>Plan</strong>
over the long term. Moreover, they target source control which has been shown to be more costeffective than “end-of-the-pipe” structural solutions. Therefore, these BMPs should not beoverlooked, and in some cases, should be the emphasis of a stormwater management program.Considerations in Selection of BMPsThe Advisory Committee took steps to determine which BMPs are more environmentallyeffective and more cost effective toward meeting the goals for the Middle <strong>Huron</strong> <strong>Watershed</strong> andaddressing the priority impairments, sources and causes. An extensive, but not exhaustive, listof possible BMPs and their potential effectiveness at addressing specific impairments, cost, andfeasibility was discussed and additions were included based on those included in other plansand ideas generated at meetings. The plan authors and the Advisory Committee consideredwhich BMPs would (1) best address the priority impairments for the watershed, (2) be amongthe more environmentally effective at addressing priority sources and causes, and (3) be morelikely to be implemented. This list of BMPs was shared among the Advisory Committeemembers and others in the Middle <strong>Huron</strong> communities in order to coordinate ideas andresources, as well as to solicit suggestions from participants, identify gaps and ensure thatwatershed goals were being addressed adequately. These steps have resulted in thedevelopment of the Action <strong>Plan</strong> (Table 3.6).The watershed is comprised of diverse communities, from rural townships to urbancenters. Consequently, a variety of structural and non-structural management alternatives, orpractices could be considered across the watershed. The alternatives described in this chaptermay apply to one community but not to another, and so it is important to note that each of thealternatives is a unique solution to a specific pollution source that is a priority in the specificgeography. Since this plan is meant to be an umbrella plan to consolidate and reference othersubwatershed plans, the Action <strong>Plan</strong> presents the broad range of practices and generalinformation about their application. The additional plans included in the appendices should bereviewed for information about areas for specific geographic implementation. Although it is notan exhaustive list of all of the possible management alternatives that could be considered, therecommended management alternatives for the watershed are summarized below in Section3.5.3.5 MIDDLE HURON WATERSHED ACTION PLANTo prepare the Action <strong>Plan</strong> Table, Advisory Committee members assessed the informationavailable from previous subwatershed, and jurisdictional plans for the types of managementalternatives and their appropriateness and efficiencies, the goals and objectives developed forthe Middle <strong>Huron</strong> <strong>Watershed</strong>, and their existing policies and programs. The managementalternatives that are listed in the Action <strong>Plan</strong> include activities that the communities haveselected as priorities to implement, as well as other BMPs that may contribute to achieving theplan’s goals and objectives but are not feasible to implement at this time.While the individual communities and entities are responsible for meeting the goals andobjectives of the <strong>Plan</strong> by implementing the recommended actions, the Action <strong>Plan</strong> is intendedas a resource for all stakeholders in the <strong>Watershed</strong>. Local planners and governmental officialscan draw upon these tools in their everyday decisions in their jobs. Local citizens can becomeinvolved at the grass roots level to implement some of these ideas, and also press their electedand local officials to carry out the management alternatives. <strong>Watershed</strong>-wide awareness of—Ann Arbor-Ypsilanti Metropolitan Area 3-22<strong>Watershed</strong> <strong>Management</strong> <strong>Plan</strong>
and active support for--the management alternatives in the Action <strong>Plan</strong> is ultimately needed toensure that the goals and objectives of the <strong>Plan</strong> are realized.The management alternatives presented in the Action <strong>Plan</strong> are described briefly below in theorder in which they appear on the Action <strong>Plan</strong>.3.5.1 Recommended Actions to Achieve <strong>Watershed</strong> Goals and ObjectivesManagerial Actions: Ordinances and PoliciesAdopt Ordinance and Rules for Stormwater <strong>Management</strong>Regulations that can guide land development with regard to protecting the water quality, waterquantity and biological integrity of the receiving surface water are important in undeveloped andsoon-to-be-developed areas. This regulation can use existing data to determine thedevelopment impact that can be tolerated by the surface waters before that system will becomedegraded. Future development or redevelopment can be guided to control runoff so that localstreams and water resources are not negatively affected by the development to the greatestextent practicable. The ordinance can incorporate requirements for managing the quality andquantity of stormwater runoff from new development sites, including residential, commercial andinstitutional sites. Adopting the Rules of the County Drain Commissioner’s Office can be anelement of the ordinance in order to be protective of local water resources. Modifications toexisting engineering and design standards for stormwater management BMPs is a necessaryelement of this activity.Improve Soil Erosion and Sediment Control (SESC) by adopting Erosion andSedimentation Ordinance, Comply with Practices and Recommendations of a SoilErosion and Soil Sedimentation Control Guide or Manual, and ImproveEnforcement of SESC PolicyRegular inspection of control measures is essential to maintain the effectiveness of duringconstructionand post-construction stormwater best management practices. Generally,inspection and maintenance of practices can be categorized into two groups—expected routinemaintenance and non-routine (repair) maintenance. Routine maintenance refers to checksperformed on a regular basis to keep the practice in good working order. In addition, routineinspection and maintenance is an efficient way to prevent potential nuisance situations (odors,mosquitoes, weeds, etc.), reduce the need for repair maintenance, and reduce the chance ofpolluting stormwater runoff by finding and correcting problems before the next rain. In addition tomaintaining the effectiveness of stormwater BMPs and reducing the incidence of pests, properinspection and maintenance is essential to avoid the health and safety threats inherent in BMPneglect. The failure of structural storm water BMPs can lead to downstream flooding, causingproperty damage, injury, and even death. 12Adopt Development Standards Zoning Ordinance for Structural and Non-Structural BMPsPittsfield Township has enacted this ordinance which covers a wide-range of land uselaws. Their description reads as follows: The township development standards, part ofthe Zoning Ordinance, include requirements for implementation of appropriate nonstructuraland/or structural BMPs. There is a 25 ft. buffer preservation for wetlands, 100ft. buffer along water bodies, establishment of easements for vegetative filters andAnn Arbor-Ypsilanti Metropolitan Area 3-23<strong>Watershed</strong> <strong>Management</strong> <strong>Plan</strong>
infiltration, and provision for reducing imperviousness through deferred parkingrequirements.Adopt Illicit Discharge Ordinance and Include Enforcement LanguageAdopt On-Site Sewage Disposal OrdinanceSeptic tank and sanitary sewer maintenance measures can be used to prevent, detect andcontrol spills, leaks, overflows and seepage from occurring in the sanitary system. Identify dryweather, illicit inflows and infiltration problems first within the sanitary system. Wet weatherflows, which are more difficult to locate, can then be located using smoke testing, sewertelevising and/or dye testing. On-site sewage disposal systems should be designed, sited,operated and maintained properly to prevent nutrient/pathogen loadings to surface waters andto reduce loadings to groundwater. Septic tanks should be pumped at least every three yearsdepending on the size of the family or group using the tank. Educational materials should bedistributed to new and current homeowners that maintain septic tanks so that pollutionprevention is emphasized.Adopt Purchase of Development Rights OrdinanceThe purchase of development rights, known as PDR, is an effective tool for local government ornon-governmental organizations such as land conservancies or land trusts, to purchase thedevelopment rights of a property to limit development and protect natural features, open spaceor agricultural land in perpetuity. The ordinance is a tool for guiding growth away from sensitiveresources and toward delineated development centers. A PDR ordinance identifies areas thatmay be protected through conservation easements or purchased for public ownership eitheroutright or through PDR. Communities in southeast Michigan have adopted PDR ordinancesand garnered the resources to purchase important parcels of land for preservation in perpetuity.Establish Master <strong>Plan</strong>s & Ordinances that Protect Natural Features, such asNatural <strong>River</strong>s Ordinance, Natural Feature Protection Ordinance, WetlandsOrdinance, Tree/Woodlands Protection Ordinance, Riparian Buffer Ordinance,and Site Design OrdinanceMany of the native plants and shrub landcover of the watershed have been replaced with nonnativeplants and shrubs and turfgrass, both of which require intensive cultivation andapplication of chemicals. Native plant and shrub species are adapted to this area and requireless water and less maintenance because of their deep root system and resistance to disease.Natives improve stormwater infiltration and stabilize soils by replacing turf grass or otherintroduced cover with native grasses, flowers, shrubs and trees. In addition, native speciesprovide habitat and food to insects and wildlife. Native landscaping resources are available insoutheast Michigan from plant growers to landscaping consultants. A native landscapingordinance would promote planting of native species and remove any existing obstacles togrowing these plants on residential and commercial lands.Wetlands serve as giant sponges, which soak up storm water during wet weather eventsallowing the water to infiltrate into the soil instead of running off directly to surface waters. Asthe stormwater infiltrates into the soil, pollutants are filtered out before it reaches groundwater.Wetlands serve to reduce storm water velocities, reduce peak flows and to filter out storm waterpollutants, they also provide habitat for numerous wildlife species. A subset of all wetlands areregulated by state and federal authorities. These regulated wetlands are at least five acres orlarger in area, within 500 feet of a water body, or located in counties where 100,000 or moreAnn Arbor-Ypsilanti Metropolitan Area 3-24<strong>Watershed</strong> <strong>Management</strong> <strong>Plan</strong>
people reside, A wetlands ordinance that is more protective than required by the state or federalgovernment is necessary to protect those smaller, isolated wetlands which are still importantnatural resources to a community. A model wetlands ordinance is available to local communitiesfrom the <strong>Huron</strong> <strong>River</strong> <strong>Watershed</strong> <strong>Council</strong> and the Michigan Coastal Zone Program of theMDEQ.Zoning maps may be amended to increase protection for water resources. Inclusion of naturalfeatures and open space zoning are two of the most common and useful ways. Allowing forcompact development design increases the ability to preserve a significant amount of open,undeveloped land by grouping buildings and paved surfaces to provide more compactdevelopments while maintaining open spaces.Adopt New Standards for Lawn Care, such as Native Landscaping Ordinance,Local Fertilizer Ordinance, Local Weed Ordinance, or Lawn Care ChemicalOrdinances (including administration)Often native plantings are used within stormwater conveyance swales, depressions and wetponds. However, native landscaping as an alternative to traditional lawns is becoming morecommon. Native plants, especially those adapted to prairie environments, require little to noirrigation, fertilizer or pesticides and allow stormwater to percolate more efficiently down into thesoil. Local weed ordinances, however, indirectly prohibit the use of native landscaping without avariance. Communities should adopt ordinances that allow and encourage native landscapingas an alternative to lawns while not negating the intent of common weed ordinances.Nitrogen, phosphorus, potassium and other nutrients are necessary to maintain optimum growthof lawns and most gardens. While phosphorus is a naturally occurring nutrient in Michiganwaters, human activities such as turfgrass fertilizing contribute excess amounts of phosphorusto lakes and rivers. Over-nutrification of freshwater systems can create nuisance algal bloomsthat deplete oxygen needed by aquatic organisms, which can lead to fish kills, and preventwater-based recreation. A local phosphorus fertilizer reduction ordinance can address theproper selection, use, application, storage and disposal of fertilizers, and incentives to reduceresidential and commercial herbicide/fertilizer use. The ordinance should be combined with acoordinated information and education campaign to communicate the need for the ordinance.Research has shown that phosphorus is not needed as a soil additive in most areas withinsoutheast Michigan. The City of Ann Arbor, Pittsfield Township, Hamburg Township, WestBloomfield Township and Commerce Township have successfully implemented suchordinances.Adopt Pet Waste OrdinancePet waste can be washed into nearby surface waters and wetlands via direct runoff or stormwater systems, thereby adding E. coli and nutrients to these freshwater systems. An ordinancethat states proper pet waste management practices and provides for education, enforcementand necessary infrastructure (e.g., bag dispensers) can reduce the incidences of pet wasteentering the watershed.Develop and Adopt Floodplain OrdinanceAdopt Site Design & Road Standards that Reduce Impervious SurfaceUtilizing a Low Impact Development (LID) <strong>Plan</strong> for new developments can reduce directlyconnected impervious surfaces. LID plans combine a hydrologically functional site design withpollution prevention measures to compensate for land development impacts on hydrology andAnn Arbor-Ypsilanti Metropolitan Area 3-25<strong>Watershed</strong> <strong>Management</strong> <strong>Plan</strong>
water quality. The result will be a reduction in stormwater peak discharge, a reduction in runoffvolume and the removal of storm water pollutants. LID principles can apply to new residential,commercial and industrial developments. Under the umbrella of LID are specific options such asreducing street widths, right of ways, minimum cul-de-sac radius, driveway widths and parkingratios, allowing for pervious materials to be used in spillover parking areas, and establishing aminimum percentage of parking lot area that is required to be landscaped (with native plants,preferably). Communities are encouraged to minimize the total impervious cover in ZoningOrdinances to protect water resources in the build-out scenario.Alternative: Once natural resources have been protected to the greatest extent possible,impervious surfaces (roads, rooftops and parking lot dimensions) should be minimized, in orderto maintain the natural balance between stormwater infiltration and runoff. Current studiessuggest that when the amount of impervious area passes a threshold level of approximately 8%,downstream impacts become evident, as stream channels are destabilized and aquatic habitatsare degraded. While minimizing the imperviousness may be a difficult objective, it is necessaryto keep in mind that for every percent this threshold is surpassed in a given area, downstreameffects are compounded significantly.Adopt a Policy Requiring Any Development which is Financed or Subsidized byLocal Government, or Receives a Tax Abatement, to Meet or Exceed LEEDStandards Pertinent to Storm Water <strong>Management</strong> where Authority to Regulate isPresentCreate Jurisdictional Authority Under Drain Code for Protection and RestorationEstablish an Environmental Protection Overlay Zoning DistrictZoning maps may be amended to increase protection for water resources. Inclusion of naturalfeatures and open space zoning are two of the most common and useful ways. Allowing forcompact development design in an area zoned for lower density development increases theability to preserve a significant amount of open, undeveloped land. By clustering buildings andpaved surfaces around natural areas and open spaces, a development can encompass thesame amount of total area while avoiding the destruction of these resources. While individuallots can lose area in this type of zoning district, residents or tenants of the entire subdivisionbenefit from increased access to natural and open spaces.Enact Ordinance Revisions to Reduce Runoff From Single and Two-FamilyResidencesIncorporate Methods for Capturing and Treating Storm Water Runoff within RoadConstruction and Improvement ProjectsRegulate Maintenance of Stormwater Control Facilities by Requiring Permits forTheir Use and Anniversary Dates for Inspections, Maintenance, and PermitRenewals Contingent on Functional Integrity of StructuresEstablish Dog Parks with Appropriate BMPsManagerial Actions: PracticesAnn Arbor-Ypsilanti Metropolitan Area 3-26<strong>Watershed</strong> <strong>Management</strong> <strong>Plan</strong>
Create and Maintain Street Cleaning and Roadside Cleaning Programs (includingAdopt-a-Road)High-powered street sweeping is a management measure that involves pavement cleaningpractices on a regular basis to minimize pollutant export to receiving waters. These cleaningpractices are designed to remove sediment debris and other pollutants from road and parkinglot surfaces that are a potential source of pollution impacting urban streams. Recentimprovements in street sweeper technology (e.g., regenerative air or vacuum assisted systems)have enhanced the ability of the current generation of street sweeper machines to pick up thefine grained sediment particles that carry a substantial portion of the stormwater pollutant load.Many of today's sweepers can now dramatically reduce the amount of street dirt enteringstreams and rivers. Street sweeping is recommended as a pollution prevention measure in coldclimate areas during or prior to spring snowmelt.Create and Maintain Yard Waste/Compost Pick-Up ProgramsIdentify and Label Catch Basins/Storm DrainsThe purpose of catch basin and storm water drain marking is to eliminate waste entering the<strong>Huron</strong> <strong>River</strong> through storm drains by creating public awareness of the danger of dumping intothese drains. This process works by marking storm drains with a warning stating that any wasteentering the drain goes straight to the <strong>Huron</strong> <strong>River</strong>. Along with the marking, the project placeseducational fliers on the doors of residences in the vicinity of newly marked drains. Markers arecontinuously placed on drains and replaced every few years when old markers begin to fade orfall off.Comply with BMPs for Fleet MaintenanceInspect Sanitary Sewer and Septic Systems for Elimination/Minimize InfiltrationRegularly Inspect and Maintain Storm Water SystemCreate Catch Basin Inspection/Maintenance ProgramsComply with BMPs for Municipal Landscaping Practices (i.e. Integrated Pest<strong>Management</strong>, Soil Testing, and Native <strong>Plan</strong>tings)Organize, Implement and Expand County Clean-up ProgramsInspect Facilities for Pollution PreventionImplement the Pump Station Contingency <strong>Plan</strong> for Pump Station FloodingClean-Up Accident Spills and Establish Communications to Coordinate EffortsSpay and Neuter Cats and Dogs to Reduce Feral Population and Decrease Habitatfor the Local Canada Goose PopulationPlace Dog Bags in Local ParksAnn Arbor-Ypsilanti Metropolitan Area 3-27<strong>Watershed</strong> <strong>Management</strong> <strong>Plan</strong>
This program provides bags for pet waste clean-up in order to reduce pet waste in parks,subsequently reducing the amount of E. coli entering surface waters from pet waste.Managerial Actions: Studies and InventoriesConduct Natural Features InventoriesThe composition and condition of natural features throughout most of the watershed is virtuallyunknown. Conducting natural features inventories is the typical approach to gathering naturalfeatures information. Several dozen state-listed and federally-listed plant and animal specieshave been sighted in the watershed. The distribution and status of those species should besurveyed and management plans for their survival and sustainability developed. These speciesand the habitats that they need for survival can serve as bellwethers for how management ofthe Middle <strong>Huron</strong> <strong>Watershed</strong> is proceeding. HRWC has developed a Bioreserve Map andproject to address this need.Create a Geographic Information System (GIS) of Municipal Separate StormSewer Systems (MS4s)GIS offers a universal tool for inventorying and manipulating data, producing accurate maps andassociated databases, and provide a basis on which to develop comprehensive land use plans.As GIS data becomes more readily available to land use decision makers, incorporatinginformation about critical natural resources, hydrology, and stormwater systems can morereadily be incorporated into master plans and individual site plan reviews. GIS information canbe incorporated into flow and water quality modeling and provide a framework for watershedscalestormwater management. Lastly, GIS technology facilitates the transfer of informationbetween agencies, governments and the public.Develop GIS for Road Drainage FacilitiesConstruct and Monitor Strategic, Innovative BMPS, including permeablepavements and Vegetated Roofs, and Develop and Refine Standards AccordinglyPorous pavement can be made of concrete, stone or plastic and promote the absorption of rainand snowmelt. The most common type of porous pavement is paving blocks and grids whichare modular systems that contain openings filled with sand and/or soil. Some pavers cansupport grass or other suitable vegetation providing a green appearance. Porous pavement canbe effective in reducing the quantity of surface runoff for small to moderate-sized storms, andmay also reduce the amount of pollutants associated with these events. Typically, thesesystems will work better when overlaid on sandy, permeable soils (as opposed to lesspermeable clay soils). Effectiveness of these pavements can be improved by maximizing theopening in the paving material and providing a sub-layer of at least 12 inches. This type ofpavement is particularly applicable for overflow and special event parking, driveways, utility andaccess roads, emergency access lanes, fire lanes and alleys.Conduct Frog and Toad SurveyContinue water quality sampling and bio-monitoring, Expand to Monitor StrategicPoints Along the Waterways, and Issue Annual Reports to the PublicA consistent dataset of water quality parameters, biotic indicators and stream flow is needed fora better understanding of conditions in the middle <strong>Huron</strong> <strong>River</strong> <strong>Watershed</strong> and to use asbaseline when measuring conditions following implementation of recommended managementAnn Arbor-Ypsilanti Metropolitan Area 3-28<strong>Watershed</strong> <strong>Management</strong> <strong>Plan</strong>
alternatives. Further, pollutant removal efficiencies should be measured as part of anyimplementation project since the literature remains incomplete. Monitoring should include dryand wet weather events and seasonal variation over multiple years. Some of the monitoringcould be conducted by trained volunteers affiliated with the <strong>Huron</strong> <strong>River</strong> <strong>Watershed</strong> <strong>Council</strong>’sAdopt-A-Stream program. The Middle <strong>Huron</strong> Monitoring Program accomplishes this and issuesannual reports. However, funding needs to be maintained to ensure sustainability of theprogram.Continue Ford Lake Water Quality MonitoringInvestigate Whether There is Adequate Means for Fish to Pass through the Middle<strong>Huron</strong> <strong>River</strong> Tributaries and DamsStudy Locations to Identify Public Properties to Serve as Overflow and DiversionPoints During High Water PeriodsManagerial Actions: Public Information and EducationCreate and Maintain a Public Hotline for Soil Erosion, OSDS, Illicit Discharge andImproper Disposal of Hazardous WastesAn estimated 75% of the nonpoint source pollutants in the <strong>Huron</strong> <strong>River</strong> <strong>Watershed</strong> are the resultof individual practices. Audiences need to include homeowners, local governments, riparianlandowners, lake and home associations, commercial lawn care businesses, generalbusinesses and services, and institutions. It is critical that these target audiences understandand respond to their impacts on the river system. Preventing pollutants from reaching the river isfar more cost effective than waiting until restoration is required.This project should target nonpoint source pollution prevention through traditional marketingoutlets including print advertising, direct mail and retail promotions. Behaviors addressed by thecampaign should include: proper lawn care practices; home toxics disposal; septic systemmaintenance; water conservation; storm drain awareness; land use; and pet waste. Marketresearch would be used to determine core behavioral motivations and how to use thesemotivations to inspire behavior change. Messages would focus on items of interest to thehomeowner, such as savings in time and money, with water quality protection positioned as an“added benefit.” Individual impacts should be stressed to empower homeowners with themessage that “their actions do make a difference.” Consistency of messages across thewatershed and repetition will be crucial to success of the campaign.Specific actions that can help fulfill the objectives for this goal are:• Educate Public on the Availability, Location and Requirements of Facilitiesfor the Disposal or Drop-Off of Household Hazardous Wastes, E-wastes,Pharmaceuticals/Personal Care Products and Others• Educate Public about Application and Disposal of Pesticides and Fertilizers• Educate Public about the Ultimate Discharge Point and Potential Impactsfrom Storm Water PollutantsAnn Arbor-Ypsilanti Metropolitan Area 3-29<strong>Watershed</strong> <strong>Management</strong> <strong>Plan</strong>
• Educate Public about Native Vegetation and Non-native, Invasive Species• Educate Public about <strong>Management</strong> of Riparian Lands• Educate Public about Soil Erosion and Sedimentation Control• Educate Public about Septic System Maintenance• Educate Public about Residential and Non-Commercial Car Washing• Educate Public about Citizen Responsibility and Stewardship Practices• Educate Public on Conservation Easements• Educate Cat and Dog Owners and Veterinarians about the Importance ofProper Fecal Waste Disposal and Keeping Cats Indoors• Educate Homeowners on the Importance of Securing Waste Receptacles,Putting Trash Out the Day of Pick-Up, and Reducing Access to Trash byWildlife• Educate RV Owners about Proper Disposal of Waste to Prevent IllicitDischargesThis program seeks to prevent the illicit discharge of black water from RVs. The plan caneducate RV owners about proper waste disposal to prevent illicit discharges throughsigns and fliers. The plan may prohibit RVs from parking overnight in parking lots, exceptin parking lots posted for RV parking.• Increase <strong>Watershed</strong> and Stream Crossing SignageDistribute Educational Handbooks on Municipal Ordinances and CitizenStewardship for Local Government and Citizen GroupsMaintain Website for <strong>Watershed</strong> Education and InformationIncrease Mass Media Efforts (i.e. Radio, Newspaper, Television)Increase the Number of Environmental Articles in Local Media SourcesContinue the Drain Commissioner's Field Inspection Division ApprenticeshipProgramContinue to Offer Public Presentations and Workshops, such as WCDC's LandUse Presentations Series and Water Resource WorkshopsDevelop School Curriculum for Storm WaterAnn Arbor-Ypsilanti Metropolitan Area 3-30<strong>Watershed</strong> <strong>Management</strong> <strong>Plan</strong>
Establish and Maintain GIS Database to Assist Hydraulic, Hydrologic, and WaterQuality ModelingA comprehensive study of the hydrology of the Middle <strong>Huron</strong> <strong>River</strong> system would provide anunderstanding of the interaction of precipitation, infiltration, surface runoff, stream flow rates,water storage, and water use and diversions. A hydraulics study would yield information aboutthe river’s velocity, flow depth, flood elevations, channel erosion, storm drains, culverts, bridgesand dams. Information resulting from these studies would provide greater detail on the sourcesand causes of problems related to hydrology-induced erosion and flooding. The studies areprerequisite to identify the most appropriate management alternatives and best locations forpractices that can restore the hydrology of the river and its tributaries.Washtenaw County has made a major commitment to developing multiple GIS layers that areuseful in local government agency and citizen watershed management practices: Withfoundation grant funding, the HRWC and the Land Information Access Association (LIAA)worked with Washtenaw County and local communities to develop an easily accessible set ofmap-based data designed to improve the quality of local land use decisions. The City of AnnArbor is currently establishing a comprehensive GIS and hydrologic model of the system withinthe city’s jurisdiction.Use Stormwater in Public Art Works such as Fountains, Sculptures, andLandscaping Water FeaturesInitiate and Develop a Waterway Stewardship Program for Citizen ParticipationUse Opportunities Provided by Public Projects (i.e. Street/Sidewalk, Sewer and/orCulver Repair) to Provide Public Education and Enjoyment (i.e. Small SittingAreas, Vestpocket Parks, and Signage Regarding BMPs)Increased watershed education and watershed ethic among residents is needed along with acoordinated information and education campaign. Public participation and involvementprograms are meant to be activities where people learn about the watershed and how to worktogether to control stormwater pollution. These programs would be based on the following fourobjectives: 1) promote a clear identification and understanding of the problem and solutions; 2)identify responsible parties/target audiences; 3) promote community ownership of the problemsand solutions; and 4) integrate public feedback into program implementation. To achieve theseobjectives the audience needs to be identified, the program carefully designed and the programeffectiveness periodically reviewed.Public participation and involvement programs can include the following activities:• Adopt-A-Stream programs – trained citizen volunteers conduct benthicmacroinvertebrate and habitat monitoring on a regular basis• Program identity – program message, logo and tag line• Collateral material – newsletters, fact sheets, brochures, posters• Coordinating committees – focus groups, stewardship/protection groups that meetregularly• Residential programs – storm drain stenciling, demonstration lawns and gardens, rainbarrels• Presentations – environmental booths, speakers’ bureau and special eventsAnn Arbor-Ypsilanti Metropolitan Area 3-31<strong>Watershed</strong> <strong>Management</strong> <strong>Plan</strong>
• School education – facility tours, contests and curriculum, outdoor education, schoolyardhabitats• Southeast Michigan Stewardship Network –brings together volunteer stewards to sharetheir experiences and learn from each other about how to protect and restore naturalareas in and around their neighborhoods. Volunteers study creeks, remove invasivespecies, collect seed from native plants, map the land around waterways, burn prairies,and participate in many other activitiesPublic information and education activities implemented by the communities in the Middle <strong>Huron</strong><strong>River</strong> <strong>Watershed</strong> will dovetail with each community’s MDEQ-approved Public Education <strong>Plan</strong>.Train Staff to Implement and Enforce Soil Erosion/Sedimentation and IDEPPolicies and ProceduresEducate Local Government Staff to Receive Pesticide CertificationManagerial Actions: Illicit Discharge EliminationIllicit discharge detection and elimination requires: 1) the prevention, detection and removal ofall physical connections to the storm water drainage system that conveys any material otherthan storm water; 2) the implementation of measures to detect, correct and enforce againstillegal dumping of materials into to streets, storm drains and streams; and 3) implementation ofspill prevention, containment, cleanup and disposal techniques of spilled materials to prevent orreduce the discharge of pollutants into storm water. Crews must be trained on how to identifyillicit discharges and locate illicit connections. Although this effort can be labor intensive, the payoff is a reduction in the amount sanitary sewage and chemicals that enters surface waters.Specific activities within an Illicit Discharge Identification and Elimination program include:Identify and Eliminate Illicit Discharges and ConnectionsConduct dye testing for illicit connections for all new construction, wheneverproperty changes ownership, or when water quality sampling or inspectionprograms show evidence of illicit connections or illegal dischargesIllicit discharge identification and elimination activities implemented by the communities in theMiddle <strong>Huron</strong> <strong>River</strong> <strong>Watershed</strong> will dovetail with each community’s MDEQ-approved IllicitDischarge Elimination <strong>Plan</strong>.Managerial Actions: Coordination and FundingDesignate an Entity to Produce and Coordinate Technical <strong>Watershed</strong>-WideInformationEstablish a Storm Water Advisory Committee and Public Involvement Programsfor Creekshed CommunitiesIncreased watershed education and watershed ethic among watershed residents is neededalong with a coordinated information and education campaign. Public participation andinvolvement programs are meant to be activities where people learn about the watershed and/orAnn Arbor-Ypsilanti Metropolitan Area 3-32<strong>Watershed</strong> <strong>Management</strong> <strong>Plan</strong>
work together to control stormwater pollution. These programs would be based on the followingfour objectives: 1) promote a clear identification and understanding of the problem andsolutions; 2) identify responsible parties/target audiences; 3) promote community ownership ofthe problems and solutions; and 4) integrate public feedback into program implementation. Toachieve these objectives the audience needs to be identified, the program carefully designedand the program effectiveness periodically reviewed.Public participation and involvement programs can include the following activities:• Adopt-A-Stream programs – trained citizen volunteers conduct benthicmacroinvertebrate and habitat monitoring on a regular basis• Program identity – program message, logo and tag line• Collateral material – newsletters, fact sheets, brochures, posters• Coordinating committees – focus groups, stewardship/protection groups that meetregularly• Residential programs – storm drain stenciling, demonstration lawns and gardens, rainbarrels• Presentations – environmental booths, speakers’ bureau and special events• School education – facility tours, contests and curriculum, outdoor education, schoolyardhabitats• Southeast Michigan Stewardship Network –brings together volunteer stewards to sharetheir experiences and learn from each other about how to protect and restore naturalareas in and around their neighborhoods. Volunteers study creeks, remove invasivespecies, collect seed from native plants, map the land around waterways, burn prairies,and participate in many other activitiesContinue Community Partners for Clean Streams (CPCS) and Promote <strong>River</strong>safeHomesThe CPCS program was developed and adopted in 1996 with funding under Section 319 of theFederal Clean Water Act, and is currently supported by the general fund of Washtenaw Countyas well as grant funds. Implementation of the program is ongoing and increasing. As of thiswriting, there are ___ current and ___ pending CPCS members.The <strong>River</strong>Safe Homes program is administered by the Washtenaw County Drain CommissionOffice and encourages local residents to practice environmentally-friendly behavior that protectsthe <strong>Huron</strong> <strong>River</strong> <strong>Watershed</strong>. For participation, the program requires residents to follow practicesthat related to Home Toxics Disposal, Yard Care and Outdoor Housekeeping, Car and VehicleCare, and Pet and Urban Wildlife Waste.Coordinate OSDS inspection program with other communities and agenciesEncourage dam removal where opportunities existCollaborate with and Provide Technical Assistance to Sub-<strong>Watershed</strong> GroupsEstablish a Single Unit in Local Government to Oversee Stormwater <strong>Management</strong>Review Construction Site <strong>Plan</strong>s for Storm Water Enforcement and BMPRecommendationsAnn Arbor-Ypsilanti Metropolitan Area 3-33<strong>Watershed</strong> <strong>Management</strong> <strong>Plan</strong>
Community site plan review standards can be revised to include, if applicable, the 100-yearfloodplain, location of waterbodies and their associated watersheds, location of slopes over 12percent, site soil types, location of landmark trees, groundwater recharge areas, vegetationtypes within 25 feet of waterbodies, woodlands and other vegetation on site, and sitetopography.Develop and Implement Creekshed and <strong>Watershed</strong> <strong>Management</strong> <strong>Plan</strong>sManagerial Actions: VegetativeRestore Wetlands/Natural AreasA restored wetland is the rehabilitation of a drained or degraded wetland where the soils,hydrology, vegetative community, and biological habitat are returned to the natural conditions tothe greatest extent possible. A constructed wetland is a man-made wetland with more than 50%of its surface area covered by wetland vegetation. It is ideal for large, regional tributary areas(10 to 300 acres) where there is a need to achieve high levels of particulate and nutrientremoval. Wetland size and configuration, hydrologic sources, and vegetation selection must beconsidered during the design phase. Constructed wetlands provide a suspended solid removalof approximately 70%, while nutrient removal capabilities vary widely (between 40% and 80%)because no standard design criteria exists. These wetlands also benefit the area by providingfish and wildlife habitat and aesthetic benefits.<strong>Plan</strong>t and Promote Rain GardensThe term "rain garden" refers to a constructed depressed area of land that is used as alandscape tool to improve water quality. Rain gardens should be placed strategically to interceptwater runoff, and typically are placed beside impervious surfaces such as driveways, sidewalks,or below downspouts. Rain gardens are designed to allow for ponding of the first flush andincreased infiltration. Nutrient removal occurs as the water comes into contact with the soil andthe roots of the trees, shrubs or other vegetation, as such plant choices should center on nativewildflowers and grasses that are adapted to local conditions. A rain garden can be as simple toestablish and maintain as a traditional garden.<strong>Plan</strong>t Grassed SwalesGrassed swales are open channel management practices designed to treat and attenuatestormwater runoff. As stormwater runoff flows through these channels, it is filtered first by thevegetation in the channel, then through a subsoil matrix, and finally infiltrates into the underlyingsoils. Grassed swales are improvements on the traditional drainage ditch and are well suited fortreating highway or residential road runoff. Grassed channels are the most similar to aconventional drainage ditch, with the major differences being flatter side and longitudinal slopesand a slower design velocity for water quality treatment of small storm events. The type andcoverage of vegetation grown in the swales will influence pollutant treatment. Pollutantreduction values in this analysis assume the use of well-established turf grasses consistent withtraditional residential settings. Other plantings may provide greater pollutant reduction, but mayalso alter conveyance hydraulics.Protect and Manage Roadside Vegetation<strong>Plan</strong>t buffers along sensitive areasAnn Arbor-Ypsilanti Metropolitan Area 3-34<strong>Watershed</strong> <strong>Management</strong> <strong>Plan</strong>
Ensure minimum disturbance of soils and vegetationReduce Turf by <strong>Plan</strong>ting Shrubs and TreesUnlike conventional turfgrass, nativetrees, shrubs and grasses haveextensive, deep root systems that canimprove stormwater infiltration.Research of stormwater runoff fromvarious land surfaces indicates thatrunoff coefficients from turfgrass canmore closely resemble runoffcoefficients for paved areas due to theshallow root structure of turfgrass andmore compacted soils on which itgrows. A popular technique forreducing turf is to use nativelandscaping for attractive borders.Because native plants have adaptedto local soils and pests, they requireless watering and need no chemicalsor fertilizers to protect them. So lessturfgrass can mean cost savings.Replacing turfgrass with native plants increases infiltrationPhoto: Center for <strong>Watershed</strong> ProtectionStabilize priority streambedsHabitat restoration techniques include in-stream structures that may be used to correct and/orimprove fish and wildlife habitat deficiencies over a broad range of conditions. Examples ofthese techniques include: channel blocks, boulder clusters, covered logs, tree cover, bank cribs,log and bank shelters, channel constrictors, cross logs and revetment and wedge and “K”dams. 13 The majority of these structures require trained installation with hand labor and tools.After construction, a maintenance program must be implemented to ensure long-term successof the habitat structures. In areas that experience high stormwater peak flows, in-stream habitatrestoration should be installed after desired flow target is reached, to ensure the success of thehabitat improvement project.Protect, stabilize and restore stream banks and channels throughengineering/bio-engineeringSoil erosion control is the process of stabilizing soils and slopes in an effort to prevent or reduceerosion due to storm water runoff. Source areas are construction sites where soil has beendisturbed and exposed, streambanks that are eroding due to lack of vegetation and an excessof peak flows during storm events, and road crossing over streams where the integrity of thestructure is compromised or where the road itself contributes gravel or dirt. Soils can bestabilized by various physical or vegetative methods, while slopes are stabilized by reshapingthe ground to grades. Both techniques will improve surface drainage and reduce the amount ofsoil eroding from a site. In areas where development activity is underway, it is important toemphasize the Soil Erosion and Sediment Control ordinance inspection and enforcement, whichoften entails hiring an adequate number of field staff.Managerial Actions: StructuralAnn Arbor-Ypsilanti Metropolitan Area 3-35<strong>Watershed</strong> <strong>Management</strong> <strong>Plan</strong>
Install inlet filtersConstruct New Storm Water Facilities and Retrofit Existing Storm Water Facilitiesto Detain First Flush and Bank Full Storms and Remove Sediment.Stormwater infiltration basins are any stormwater device or system, which causes the majorityof runoff from small storms to infiltrate into the ground rather than be discharged to a stream.Most infiltration devices also remove waterborne pollutants by filtering water through the soil.Stormwater infiltration can provide a means of maintaining the hydrologic balance by reducingthe impacts of impervious areas. Infiltration devices can include any of the following: basins,trenches, permeable pavement, modular pavement or other systems that collect runoff anddischarge it into the ground. Infiltration devices should only be used on locations with gentleslopes, permeable soils and relatively deep water tables and bedrock levels. In newdevelopments, permeable soil areas should be preserved and utilized as stormwater infiltrationareas.Extended wet detention ponds, or wet ponds, are constructed basins designed to contain apermanent pool of water in order to detain and settle stormwater runoff. The primary pollutantremoval mechanism is settling as stormwater resides in the pool and pollutant uptake occursthrough biological activity in the pond. Wet ponds are among the most cost-effective and widelyused stormwater practices. A sediment forebay should be incorporated into the pond design,which promotes increased settling of sediments and helps prevent outlet clogging. Landscapingdesign requirements should include a natural vegetated buffer around the pond to increaseaesthetics, reduce pollutants entering the area, and discourage goose habitation. Studiesindicate that wet ponds may outperform dry detention basins for nutrient and sediment removal,and dry detention basins do not treat first flush stormwater.Install/Retrofit Water Quality Sumps into Catch Basins, including RegularMaintenance and CleanoutA catch-basin is an inlet to the storm drain system that typically includes a grate or curb inletand a sump to capture sediment, debris, and associated pollutants. A number of proprietarytechnologies are now available to augment the pollutant capture of these systems. Thesetechnologies generally employ additional sump chambers to enhance the capture of solids, andmany employ filtering media to capture additional pollutants or fractions of the pollutant inflows.The generic term “catch-basin inserts” is used here to describe a variety of in-sump or in-linedesigns.Complete Ford Lake Nuisance Algae Pilot Project, Engineering ImplementationProject and Oxygen Injection EquipmentPrioritize and Execute Infrastructure Repairs to Drains and Tributaries andExpand Removal of Sediment Islands to County DrainsStabilize Roads and BridgesThe gravel and sand/gravel composite used for road surface can be the source of sedimentpollution to surface waters when precipitation washes it into the stream or when road gradingbuilds piles of the surface along the sides of the road. Stabilization of the eroding road andbridge surfaces at the sites identified in the field inventory may involve structural techniquessuch as retrofitting the bridge to prevent runoff from entering the stream or managerialtechniques such as altering grading practices and selecting a different road and bridge surface.Ann Arbor-Ypsilanti Metropolitan Area 3-36<strong>Watershed</strong> <strong>Management</strong> <strong>Plan</strong>
Local units of government, specifically the townships, will need to work through the countygovernments to implement this practice.Construct appropriate recreational access points to reduce erosion and protectbanks and shorelines. Engage livery and marina operations to establish no wakezones and similar managerial BMPs to properly control erosion associated withrecreational usesIn order to encourage public awareness and concern for rivers, streams and wetlands, it isimportant to increase opportunities for people to access these water resources. If provided withaesthetic and accessible, well-advertised recreational areas - be it a canoe livery, a fishing pier,or a trail system - the public will be able to experience the human benefits that the water offersand in turn, may want to work to protect the resource. First, the designated and desired usesmust be restored so that it is safe for the public to use the resource in the manner it is intended;i.e., reduce sediment in order to construct a canoe livery. Then, the recreational amenity can beplanned, built and promoted.Daylight Streams, where Technically Feasible and Cost-EffectiveModify Roof Drain of Directly Connected Impervious AreasInventory Opportunities and Promote LID (i.e. Rain Gardens, Rain Barrels, GreenRoofs, Porous Pavement)Land use planning and management involves a comprehensive planning process to promoteLow Impact Development (LID) and control or prevent runoff from developed land uses. LID is alow cost alternative to traditional structural stormwater BMPs. It combines resourceconservation and a hydrologically functional site design with pollution prevention measures toreduce development impacts to better replicate natural watershed hydrology and water quality.Through a variety of small-scale site design techniques, LID reduces the creation of runoff,volume, and frequency. Essentially, LID strives to mimic pre-development runoff conditions.This micro-management source control concept is quite different from conventional end-of-pipetreatment or conservation techniques. The LID planning process involves the following steps:1) determine water quality and quantity goals with respect of human health, aquatic life andrecreation; 2) identify planning area and gather pertinent hydrological, chemical and biologicaldata; 3) determine and prioritize the water quality needs as they relate to land use and theproposed development; 4) develop recommendations for low impact development to addressthe problems and needs that have been previously determined; 5) present recommendations toa political body for acceptance and 6) implement adopted recommendations.Construct BMP demonstration sites on both private and public landsAdditional Resources for Stormwater <strong>Management</strong> AlternativesAdditional information on stormwater management alternatives can be found at the followingweb-based resources:International Stormwater BMP Database:http://www.bmpdatabase.org/Low Impact Development Center:Ann Arbor-Ypsilanti Metropolitan Area 3-37<strong>Watershed</strong> <strong>Management</strong> <strong>Plan</strong>
http://www.lowimpactdevelopment.org/MDEQ’s Guidebook of Best <strong>Management</strong> Practices for Michigan <strong>Watershed</strong>s:http://www.michigan.gov/deq/0,1607,7-135-3313_3682_3716-103496--,00.htmlMDEQ’s Index of Individual BMPs:http://www.michigan.gov/deq/0,1607,%207-135-3313_3682_3714-13186--,00.htmlMDOT Approved BMPs:http://www.michigan.gov/documents/SWMP_05_MDOT_v_4_120609_7.0_Appendix_D.pdfThe Stormwater Manager’s Resource Center:http://www.stormwatercenter.net/US EPA’s National Menu of BMPs for Stormwater Phase II:http://cfpub.epa.gov/npdes/stormwater/menuofbmps/menu.cfm3.5.2 Understanding the Action <strong>Plan</strong> TableAs previously mentioned, the Action <strong>Plan</strong> Table is intended to provide a broad, though notcomplete, list of management alternatives to address the <strong>Plan</strong>’s goals and objectives. Not allmanagement alternatives apply to all permitted entities; neither must they all be implemented inorder to achieve the <strong>Plan</strong>’s goals and objectives, and address the priority impairments, sourcesand causes.Each of the items in the Action <strong>Plan</strong> is numbered for reference and includes the followinginformation:• A brief description of the action to be undertaken;• The main goals addressed by the activity;• The entities responsible for implementation;• The level of effort required for the activity to be considered fulfilled;• The estimated initial capital costs;• The estimated annual maintenance or continuation costs;• The expected duration or timeline for the project’s implementation;• A general description of the recommended locations for implementation; and• Technical and financial resources that may assist implementation.Ann Arbor-Ypsilanti Metropolitan Area 3-38<strong>Watershed</strong> <strong>Management</strong> <strong>Plan</strong>
Table 3.6. Action <strong>Plan</strong> for the Middle <strong>Huron</strong> <strong>River</strong> <strong>Watershed</strong>Goals and Objectives AddressedCost<strong>Management</strong> Alternative1 Reduce Flow Variability2 Reduce NPS Nutrient Loading3 Natural Features Protection & Mitigation4 Increase Public Awareness5 Reduce Erosion and Sedimentation6 Implementation of WMP7 Continue Monitoring & Data CollectionResponsibleLevel of EffortCapitalAnnualProjectDuration/TimelineRecommendedLocationsTechnical/FinancialResourcesManagerial: Ordinances and Policies1 Adopt ordinance and rules for storm water management Improve Soil Erosion and Sediment Control (SESC) by adopting Erosionand Sedimentation Ordinance, comply with practices and2recommendations of a Soil Erosion and Soil Sedimentation ControlGuide or Manual, and improve enforcement of SESC policiesAdopt Development Standards Zoning Ordinance for structural and nonstructural3BMPsWashtenaw County; LocalGovernments Local Governments Local GovernmentsAll Phase II municipalities w/in 2$2500-$3500 each 1 enforcementyears; all w/in 5 years.50% of municipalities by 2years; all in 5 years1-2 municipalities by year 2;half by year 5New ordinances: 1 year;Enforcement: on-going;revision every 3-5 yearsNew ordinances: 1 year;$5,000-$10,000 2; additionalstaffing costs for inspecting,processing violations 2 $40,000-$50,000 1 Enforcement: on-going;revision every 3-5 years$5,000-$10,000 2 enforcementNew ordinances: 1 year;Enforcement: on-going;revision every 3-5 yearsAll jurisdictionsAll jurisdictionsOrdinance, WCDC, AATWPobtain sample ordinances;MDOT, MDEQ, MACDC,APAobtain sample ordinances,legal review4 Adopt Illicit Discharge Ordinance and include enforcement language g Local Governments1-2 MS4s by year 2; all MS4sby year 5New ordinances: 1 year;$5,000-$10,000 $ , 2 enforcementEnforcement: on-going;grevision every 3-5 yearsAll MS4 communitiesobtain sample ordinances,legal review5 Adopt On Site Sewage Disposal Ordinance Local Government1-2 municipalities by year 2;remaining by year 5$5,000-$10,000 2 enforcementNew ordinances: 1 year;Enforcement: on-going;revision every 3-5 yearsAll, as appropriateobtain sample ordinances,legal review6 Adopt Purchase of Development Rights ordinance Washtenaw County; LocalGovernments1 municipality by year 2; 3 byyear 5$5,000-$10,000 2 availability of development right Enforcement: on-going;Variable, based upon the New ordinances: 1 year;fundsrevision every 3-5 yearsAll, especially DexterVillage and Lodi Twp.obtain sample ordinances;HCMAEstablish Master <strong>Plan</strong>s & ordinances that protect natural features, suchas a Natural <strong>River</strong>s Ordinance, Natural Feature Protection Ordinance,7Wetlands ordinance, Tree/Woodlands Protection Ordinance, RiparianBuffer Ordinance, and Site Design Ordinance Local Governments; UM 2 new ordinances per year $2500-$10,000/ordinance 1, 2 enforcementNew ordinances: 1 year;Enforcement: on-going;revision every 3-5 yearsAll jurisdictionsordinance inventory, obtainsample ordinances, legalreviewAdopt new standards for lawn care, such as Native Landscaping8 Ordinance, Local Weed Ordinance or Lawn Care Chemical Ordinances(including administration) 9 Adopt Pet Waste Ordinance Local Governments10 Develop and adopt Floodplain Ordinance Local Governments11 Adopt site design & road standards that reduce impervious surface Local Governments, WCRCAdopt a policy requiring any development which is financed orsubsidized by local government, or receives a tax abatement, to meet or12exceed LEED standards pertinent to stormwater management whereauthority to regulate is presentCreate jurisdictional authority under drain code for protection and13 restoration where jurisdiction does not exist (when requested by localUnits) Local Governments WCDCLocal Governments,especially City of Ann Arbor, 1 municipality by year 2, 3 byScio Twp., Pittsfield Twp. year five(Phosphorus); UM;2 municipalities by year 2, 5 byyear 51 municipality by year 2, 3 byyear five2 jurisdictions by year 2, 5 byyear 51 municipality by year 2, 3 byyear fiveDraft language by year 2,finalize by year 5$2500-$5,000/ordinance 1, 4$2500-$5,000/ordinance 1, 4enforcementenforcement$50,000 6 enforcementNew ordinances: 1 year;Enforcement: on-going;revision every 3-5 yearsNew ordinances: 1 year;Enforcement: on-going;revision every 3-5 yearsNew ordinances: 1 year;Enforcement: on-going;revision every 3-5 yearsAll, especially City of AnnArbor, Ann Arbor Twp.,Pittsfield Twp. andYpsilanti TownshipAll jurisdictions, withfocus on E. coli areaAll, especially City of AnnArbor$3,000 1 enforcement Revision every 3-5 years All$2500-$5,000/ordinance 1, 4enforcement$1,000,000 6 enforcementNew ordinances: 1 year;Enforcement: on-going;revision every 3-5 yearsNew ordinances: 1 year;Enforcement: on-going;revision every 3-5 yearsAllWhere local units requestobtain sample ordinances,legal reviewobtain sample ordinances,legal reviewobtain sample ordinances,legal reviewobtain sample ordinances,legal reviewobtain sample ordinances,legal review, MCA, MCCCSample language, legalreview14 Establish an Environmental Protection Overlay Zoning District Local Governments2 municipalities by year 2, 5 byyear 5$2500-$5,000/ordinance1, 4enforcementNew ordinances: 1 year;Enforcement: on-going;revision every 3-5 yearsAllobtain sample ordinances,legal reviewEnact ordinance revisions to reduce runoff from single and two-family15residences Local Governments2 jurisdictions by year 2, 5 byyear 5$1,000 enforcement Revision every 3-5 years Allobtain sample ordinances,legal reviewIncorporate methods for capturing and treating storm water runoff within16road construction and improvement projects Local Governments, WCRC2 jurisdictions by year 2, 5 byyear 5$3,000 1 enforcement Revision every 3-5 years All Engineering and legal review1 Mill Creek WMP 2 Chain of Lakes WMP 3 Millers Creek WIP 4 NPS-RIP 5 Ypsilanti Twp. 6 City of Ann Arbor 7 Lower <strong>Huron</strong> WMP
Table 3.6. Action <strong>Plan</strong> for the Middle <strong>Huron</strong> <strong>River</strong> <strong>Watershed</strong>Goals and Objectives AddressedCost<strong>Management</strong> Alternative1 Reduce Flow Variability2 Reduce NPS Nutrient Loading3 Natural Features Protection & Mitigation4 Increase Public Awareness5 Reduce Erosion and Sedimentation6 Implementation of WMP7 Continue Monitoring & Data CollectionResponsibleLevel of EffortCapitalAnnualProjectDuration/TimelineRecommendedLocationsTechnical/FinancialResourcesRegulate maintenance of stormwater control facilities by requiringpermits for their use and anniversary dates for inspections,17maintenance, and permit renewals contingent on functional integrity ofstructures WCDC, local governments2 jurisdictions by year 2, 5 byyear 5$3,000 2 enforcementNew ordinances: 1 year;Enforcement: on-going;revision every 3-5 yearsAllEngineering and legal reviewManagerial: PracticesCreate and maintain street cleaning and roadside cleaning (including18Adopt-a-Road) Local Governments, WCRC 50% by year 2, all by year 5 $100,000-200,000 1,2 $30-$65 curb/mile On-going All SOPs19 Create and maintain yard waste/compost pick-up Local Governments; PrivateLandowners1 community by year 2, 3 byyear 5Recycling station expenses 2 $10-20/cubic yd disposal On-going All Recycling engineers$1.50 lexon marker, $3.0020 Identify and label catch basin/storm drain Local Governments; UM sewered areascrystal-coaterd marker 2 Repeat coverage every 5 years On-going All HRWC design21 Comply with BMPs for Fleet Maintenance Washtenaw County; LocalAll Phase II entities by year 2,Government; UM remainder by year 5variable Maintenance costs, retraining On-going All SEMCOGWashtenaw County; LocalInspect Sanitary Sewer and Septic Systems for Elimination/Minimize22 Government; PrivateInfiltrationPropertysewered areas $100-$300 per inspection 2 On-going All SOPs, SEMCOG23 Regularly inspect and maintain storm water system 24 Create Catch Basin Inspection/Maintenance Programs Comply with BMPs for landscaping on municipal properties (i.e.25Integrated Pest <strong>Management</strong>, soil testing, and native plantings)Washtenaw County; LocalGovernmentsWCDC, WCRC, localgovernmentsAll MS4s1-2 FTEsfive year rotationalinspection25% by year 2, 50% by year 5 $100-$300 per inspection 2 Yearly inspection,minimum Local Governments 50% by year 2, all by year 5 $100/ac/year26 Organize, implement and expand County clean-up programs WCDC; Local Governments27 Inspect facilities for pollution prevention WCPE; Local Governments2 communities by year 2, 5 byyear 5All MS4s by year 2; 100% byyear 5ContinuousimplementationAll MS4sAll MS4sAll municipal propertiesSOPsSOPsSEMCOG, SOPs$10,000 start-up variable annual administraion On-going All HRWC$100-300 per inspection On-going All municipal properties SOPs, SEMCOG28 Implement the Pump Station Contingency <strong>Plan</strong> for pump station flooding Ann Arbor Township one station (others as relevant) $10,000 On-going Ann Arbor Twp.Establish dog parks with appropriate BMPs and place dog bags in local29parksWashtenaw County, LocalGovernments, privatelandowners2 municipalities by year 2, 5 byyear 5$20,000 - 50,000 per dog park2-5% of construction costs;$50/park for bagsContruction 1 year,maintenance on-goingReference plans, engineeringreviewE. coli TMDL area Humane SocietyClean-up accident spills and establish communications to coordinate30effortsWashtenaw County; LocalGovernments; UMas needed Site/Substance-specific On-going All municipal operations SOPsExpand Trap, Neuter and Release program to reduce feral popuation,31 educate pet owners & residents and decrease habitat for the Canadagoose populationManagerial: Studies and InventoriesWashtenaw County;communities in E. coliTMDL area32 Conduct Natural Features Inventories Local Governments; UMWCDC by year 2, then AnnArbor2 municipalities by year 2, 5 byyear 5$20,000 pilot program0 year pilot, then on-goingimplementation$1,200 per site 2 1 year per inventory,revise every 5 years33 Create a GIS of MS4s and use for study of hydrology and hydraulics Local Governments; UM all MS4s by year 2 $100/hr per municipal staff 2 1 year to prepare; 5 yearupdatesE. coli TMDL area State grant funding,AllHRWC, MNFIAllHRWC, state data34 Develop GIS for Road Drainage Facilities Washtenaw County; LocalGovernments; UMAll MS4s by year 2; 100% byyear 5$100/hr per municipal staff 32 years to prepare; 5 yearupdatesAllWCDC, WCRCConstruct and monitor strategic, innovative BMPs, including permeable35 pavements and vegetated roofs, and develop or refine standardsaccordinly WCRC; Local Governments;Private Owners; 1 pilot project each year variable, depending on projectCommercial Retailers$100,000 permeable pavement6 2-3 year projects All Grant funding36 Conduct Frog and Toad Survey Local Governments2 municipalities by year 2, 5 byyear 5volunteer recruitment Annual wetlandsState Government (MDNR),consultants1 Mill Creek WMP 2 Chain of Lakes WMP 3 Millers Creek WIP 4 NPS-RIP 5 Ypsilanti Twp. 6 City of Ann Arbor 7 Lower <strong>Huron</strong> WMP
Table 3.6. Action <strong>Plan</strong> for the Middle <strong>Huron</strong> <strong>River</strong> <strong>Watershed</strong>Goals and Objectives AddressedCost<strong>Management</strong> Alternative1 Reduce Flow Variability2 Reduce NPS Nutrient Loading3 Natural Features Protection & Mitigation4 Increase Public Awareness5 Reduce Erosion and Sedimentation6 Implementation of WMP7 Continue Monitoring & Data CollectionResponsibleLevel of EffortCapitalAnnualProjectDuration/TimelineRecommendedLocationsTechnical/FinancialResourcesContinue water quality sampling and bio-monitoring and expand to37 strategic points on the waterway to determine trends and effectivenessof BMPs and issue annual reports to the public State Government (MDEQ,MDNR); Washtenaw Dry and wet weatherCounty; Local Governments; monitoring; seasonal variationUM; HRWC$50,000-$100,000 1, 2 ;$40,000 1 On-going see monitoring plan Volunteers, HRWC$1,650,000 6Pilot stormwater audit program with property owners- Downspout Disconnections38 - Rain Barrels- Native Landscaping- Rain GardensWashtenaw County, LocalGovernments, HRWCPilot program with 1/4 FTE $30,000 1-year studyTarget residentialneighborhoodsStaff, grant39 Continue Ford & Belleville Lake Water Quality monitoring WCDC; Ypsilanti Twp.; UM Year-round monitoring regimen N/A $30,000 5 On-going Ford & Belleville Lake WCAC, MDEQInvestigate whether there is adequate means for fish to pass through40Middle <strong>Huron</strong> <strong>River</strong> tributaries and damsDNR; WCDC; LocalGovernmentsRegionwide study $100,000, depending on focus 3-year study All damsMDNR, HRWC, MDEQ, damoperatorsStudy locations to identify public properties to serve as overflow and41diversion points during high water periods WCDC; City of Ann Arbor Targeted study $200-300,000 3-year study Flood prone areas MDEQ, FEMAManagerial: Public Information & EducationCreate and maintain a public hotline for reporting soil erosion, OSDS,42illicit discharge and improper disposal of hazardous wastesEducate and involve communities on the availability, location andrequirements of facilities for the disposal or drop-off of household43hazardous wastes, e-wastes, pharmaceuticals/personal care productsand othersEducate and involve communities about application and disposal of44pesticides and fertilizersEducate and involve communities about the ultimate discharge point45and potential impacts from storm water pollutantsEducate and involve communities about native vegetation and nonnative,invasive46speciesWCDC; WCHD;WCOSESC; LocalGovernments; UM Local Government; UM 47 Educate and involve communities about management of riparian lands Educate and involve communities about soil erosion and sedimentation48control 49 Educate and involve communities about septic system maintenance Educate and involve communities about residential and non-commercial50car washingEducate and involve communities about citizen responsibility and51stewardship practices52 Educate and involve communities about conservation easements Washtenaw County; LocalGovernments; UMWashtenaw County; LocalGovernments; UM50% of entities by year 2, all byyear 5community-wide; (# householdsdetermined by each PEP), seeI&E sectioncommunity-wide; (# householdsdetermined by each PEP), seeI&E sectioncommunity-wide; (# householdsdetermined by each PEP), seeI&E sectioncommunity-wide; (# householdsWashtenaw County; Localdetermined by each PEP), seeGovernments; UM; HRWCI&E sectionWashtenaw County; LocalGovernments; UMWashtenaw County; LocalGovernments; UMWashtenaw County; LocalGovernments; UMWashtenaw County; LocalGovernments; UMWashtenaw County; LocalGovernments; UMWashtenaw County; LocalGovernmentscommunity-wide; (# householdsdetermined by each PEP), seeI&E sectioncommunity-wide; (# householdsdetermined by each PEP), seeI&E sectioncommunity-wide; (# householdsdetermined by each PEP), seeI&E sectioncommunity-wide; (# householdsdetermined by each PEP), seeI&E sectioncommunity-wide; (# householdsdetermined by each PEP), seeI&E sectioncommunity-wide; (# householdsdetermined by each PEP), seeI&E section$100/hr municipal staff 2 On-going All municipalities WCDC, training$.02/hh for print ads; $0.5/piece Annual campaign withfor print and mail 2rotational messages$.02/hh for print ads; $0.5/piece Annual campaign withfor print and mail 2rotational messages$.02/hh for print ads; $0.5/piece Annual campaign withfor print and mail 2rotational messages$.02/hh for print ads; $0.5/piece Annual campaign withfor print and mail 2 ; $12,000 3 rotational messages$.02/hh for print ads; $0.5/piece Annual campaign withfor print and mail 2rotational messages$.02/hh for print ads; $0.5/piece Annual campaign withfor print and mail 2rotational messages$.02/hh for print ads; $0.5/piece Annual campaign withfor print and mail 2rotational messages$.02/hh for print ads; $0.5/piece Annual campaign withfor print and mail 2rotational messages$.02/hh for print ads; $0.5/piece Annual campaign withfor print and mail 2rotational messages$.02/hh for print ads; $0.5/piece Annual campaign withfor print and mail 2rotational messagesAll municipalitiesAll municipalitiesAll municipalitiesAll municipalitiesAll municipalitiesAll municipalitiesAll municipalitiesAll municipalitiesAll municipalitiesAll municipalitiesHRWCMSU Extension; HRWCHRWCHRWC, PfizerHRWC; WCDCHRWCHRWCHRWCHRWCHRWCEducate cat and dog owners and veternarians about the importance of53proper fecal waste disposal and keeping cats indoorsWashtenaw County; LocalGovernments; UMcommunity-wide; (# householdsdetermined by each PEP), seeI&E section$0.03/Doggie flyer; $0.80 stormwater calendars 4Annual campaign withrotational messagesAll municipalitiesHRWC1 Mill Creek WMP 2 Chain of Lakes WMP 3 Millers Creek WIP 4 NPS-RIP 5 Ypsilanti Twp. 6 City of Ann Arbor 7 Lower <strong>Huron</strong> WMP
Table 3.6. Action <strong>Plan</strong> for the Middle <strong>Huron</strong> <strong>River</strong> <strong>Watershed</strong>Goals and Objectives AddressedCost<strong>Management</strong> Alternative1 Reduce Flow Variability2 Reduce NPS Nutrient Loading3 Natural Features Protection & Mitigation4 Increase Public Awareness5 Reduce Erosion and Sedimentation6 Implementation of WMP7 Continue Monitoring & Data CollectionResponsibleLevel of EffortCapitalAnnualProjectDuration/TimelineRecommendedLocationsTechnical/FinancialResourcesEducate homeowners and customers on the importance of securing54 waste recepticals, putting trash out the day of pick up, and reducingaccess to trash by wildlifeWashtenaw County; LocalGovernments; UMcommunity-wide; (# householdsdetermined by each PEP), seeI&E section$.02/hh for print ads; $0.5/piece Annual campaign withfor print and mail 2rotational messagesAll municipalitiesHRWCEducate RV owners about proper disposal of waste to prevent illicit55dischargesWashtenaw County; LocalGovernments; UMcommunity-wide; (# householdsdetermined by each PEP), seeI&E section$0.03/flier; $20 per 24"x30" sign,or $23 per 24"x36" sign, plus costof sign post and installation$2,000 4 On-going UM; City of Ann Arbor HRWC, UM-OSEH56 Increase watershed and stream crossing signage Washtenaw County; LocalGovernments20% per year; Strategiclocations on county roads$20 per 24"x30" sign, or $23 per24"x36" sign, plus cost of signpost and installation 25 years to complete, thenmaintenancePriority stream crossingsWCDC; WCRCDistribute educational handbooks on municipal ordinances and citizen57stewardship for local government and citizen groupsLocal Governments3 communities by year 2, 6 byyear 5$1/booklet5 yearsCommunities thatestablish new ordinancesHRWC58 Maintain i website for watershed education and information Washtenaw County; LocalGovernments; UM50% by year 2, all by year 5 $5,000 to develop $50-100/hr to update website 2 On-going <strong>Watershed</strong>-wideLinkages, templates,resources59 Increase Mass Media Efforts (i.e. radio, newspaper, television) Washtenaw County; LocalGovernments; UM1 pilot campaign per year$100/hr+cost for cable TV,consult w/ local media 3; $50-$100/hr/press release 21 year pilot with follow-upevaluation<strong>Watershed</strong>-wideWEMU, HRWC, SEMCOG60 Increase the number of environmental articles in local media sources Washtenaw County; LocalGovernments; UMOne article per month $50-100/article 2 On-going<strong>Watershed</strong>-wide newsmediaHRWC, news reportersContinue the Drain Commissioner's Field Inspection Division61Apprenticeship ProgramWCDC 2 apprentices per year $30,000 On-going Washtenaw County UniversitiesContinue to offer public presentations and workshops, such as WCDC's62Land Use Presentations Series and Water Resource WorkshopsWashtenaw County; LocalGovernments; UM3 presentations/workshops peryear$100/presentation On-going <strong>Watershed</strong>-wide sponsorship63 Develop school curriculum for storm water Local Governments; UM;Public & Private SchoolsPilot project by year 2$50-100/hr to develop; $5000printing3-5 years Ann Arbor, Dexter Public schools, MDEEstablish and maintain GIS database to assist hydraulic, hydrologic,64and water quality modelingWashtenaw County; LocalGovernments, HRWCInventory resrouces by year 2,update year 5$2,000-3,000 per inventory2-3 year repeat andmaintenance<strong>Watershed</strong>-wideHRWC, MDEQUse stormwater in public art works such as fountains, sculptures, and65landscaping water featuresInitiate and develop a waterway stewardship program for citizen66participationLocal Governments Local Governments67 Promote homeowner soil testing Washtenaw County; LocalGovernmentsPilot with municipal project byyear 5Develop model by year 3,implement by year 5.Integrate into educationalmaterials$20,000 - $1,000,000 maintenance 5 years Urban center MCA, MCCC, HRWC$5,000 $50-100/hr 5 years to establish <strong>Watershed</strong>-wide MCA, MCCC, HRWCno additional cost On-going <strong>Watershed</strong>-wide HRWC, MSU ExtensionUse opportunities provided by public projects (i..e.street/sidewalk, sewer68 and/or culver repair) to provide public education and enjoyment (i.e.small sitting areas, vestpocket parks, and signage regarding BMPs)Local GovernmentsOpportunistic implementation of1-2 projects by year 2, 3-5 byyear 5Variablemaintenance1-2 year projectdevelopment<strong>Watershed</strong>-wideEngineeringTrain staff to implement and enforce soil erosion/sedimentation and69IDEP policies and procedures70 Educate local government staff to receive Pesticide Certification Local GovernmentsManagerial: Illicit Discharge Elimination WCDC, local governments All MS4s by year 2 $100/hr municipal staff 2 Annually, repeat every 5years50% of applicators by year 2, allAnnually, repeat every 5by year 5$100/hr municipal staff 2 yearsAll MS4sAll municipal propertiesWCDCSEMCOGIdentify and Eliminate Illicit Discharges and Connections. Monitor dryweather flows to enable targeted efforts to find illicit discharges and71evaluate effectiveness. Educate about dumping, and encourage callingthe tiplineWashtenaw County; LocalGovernments; UMID and remove 50% by year 2,100% by year 5$100/staff investigation perproperty 2$600/dye test; $100/staffinvestigation per property;$5,000-$15,000 enforcementper property5 years, then follow-up All MS4sWCDC, MDEQ, WashtenawCounty1 Mill Creek WMP 2 Chain of Lakes WMP 3 Millers Creek WIP 4 NPS-RIP 5 Ypsilanti Twp. 6 City of Ann Arbor 7 Lower <strong>Huron</strong> WMP
Table 3.6. Action <strong>Plan</strong> for the Middle <strong>Huron</strong> <strong>River</strong> <strong>Watershed</strong>Goals and Objectives AddressedCost<strong>Management</strong> Alternative1 Reduce Flow Variability2 Reduce NPS Nutrient Loading3 Natural Features Protection & Mitigation4 Increase Public Awareness5 Reduce Erosion and Sedimentation6 Implementation of WMP7 Continue Monitoring & Data CollectionResponsibleLevel of EffortCapitalAnnualProjectDuration/TimelineRecommendedLocationsTechnical/FinancialResourcesConduct dye testing for illicit connections for all new construction,whenever property changes ownership, or when water quality sampling72or inspection programs show evidence of illicit connections or illegaldischargesManagerial: Coordination and FundingDesignate an entity to produce and coordinate technical watershed-wide73informationEstablish a storm water advisory committee and public involvement74programs for creekshed communities WCDC; Local Governments All new properties or transfers $600/dye test 2 On-going All MS4s WCDCWCDC; WCRC; LocalGovernments; UM Local Governments; HRWCOpportunistic communication $50-100/hr On-going <strong>Watershed</strong>-wide HRWC2 creeksheds by year 2, 4 byyear 5$209,000 3 N/A On-going All creeksheds HRWCContinue Community Partners for Clean Streams and promote <strong>River</strong>safe75HomesWCDC; Local Governments;WCDC annual coordination $50-100/hr On-going All communitiesPrivate LandownersDevelop a dam assessment strategy and encourage dam removal whereWashteanw County; Local Opportunistic removal plans forPriority dams from76 $200-300,000 per assessment 5-7 years per damopportunities existGovernments 1 dam by yy year 2, 2 by yyear 5inventoryHRWC, AA IMP, DNR, DEQCollaborate with and provide technical assistance to sub-watershed77groups Local Governments Staff support for relevant groups $2000/group On-goingMalletts CreekshedMillers Creekshed,Fleming Creekshed, FordLake; Whitmore LakeHRWCEstablish a single unit in local government to oversee stormwater78managementLocal Government 2 communities by year 2 1-3 FTEs On-going Phase II communities MCA, MCCCReview construction site plans for storm water enforcement and BMP79recommendations Local Governments; UM50% of Phase II communties byyear 2, all by year 5$100/plan review On-going All Phase II Training80 Develop and Implement Creekshed and <strong>Watershed</strong> <strong>Management</strong> <strong>Plan</strong>s$125,000-$200,000/planWCDC; Local Governments; <strong>Plan</strong>s complete, update every 3-development 6 ; $300,000Creek Groups 5 yearsImplementation 6Update every 3-5 years<strong>Huron</strong> <strong>River</strong> <strong>Watershed</strong>,Allens Creekshed, TraverCreekshed, FlemingCreekshed, Swift RunCreekshed, NewportCreekshedHRWCVegetative81 Restore Wetlands/Natural Areas Washtenaw County; Local100 acres by year 2, 200 byGovernments; UM; Privateyear 5Landowners$700-2,000/acre 2 ; $344.559 3 2-4% Construction Costs 1 1-3 years per project Millers CreekshedEcological, engineeringdesign82 <strong>Plan</strong>t and promote rain gardens Washtenaw County; LocalGovernments; UM; Private 20 per yearLandowners$500/homesite, or $3-5/sq ft upto $10-12/sq ft for professional 4% Construction Costs 1 5 Yearswork 2 ; $50,000 6All, especially YpsilantiTwp.WCDC83 Protect, restore and maintain grassed swales 84 Protect, restore and maintain roadside vegetation 85 <strong>Plan</strong>t buffers along sensitive areas Washtenaw County; LocalGovernments; UM; Private 1,000 linear feet per year $.50/sq. foot 1 $.02/sq. foot 1 1-2 Years per projectLandownersTarget areas based onsubwatershed planssubwatershed plansWCRC; Local Governments;Annual maintenance $50-100/hr annually all roads in target areas GIS, SOPs, SEMCOGUMWashtenaw County; Local 5000 linear feet of 25 ft minGovernments; UM; Private buffers by year 2; 15,000 byLandowners year 5.$0.40/linear ft @ 25' buffer1-2 Years per projectTarget areas based onsubwatershed planssubwatershed plans, HRWC,technical guidelines86 Ensure minimum disturbance of soils and vegetation Washtenaw County; LocalAll new construction proejcts byGovernments; UM; Privateno additional cost 2 years to implement <strong>Watershed</strong>-wide WCDCyear 2Landowners87 Reduce turf by planting shrubs and trees and native landscapes WCRC; Local Governments;UM; Private Landowners$40/tree 6 ; $5000/half acre of100 acres by year 2, 200 by year tree & shrub seedlings andgroundcover88 Stabilize priority streambeds WCDC; Local Governments 1 project by year 2, 3 by year 5 $3,500,000 6 3-5 year projects1 Mill Creek WMP 2 Chain of Lakes WMP 3 Millers Creek WIP 4 NPS-RIP 5 Ypsilanti Twp. 6 City of Ann Arbor 7 Lower <strong>Huron</strong> WMP10 YearsTarget areas based onsubwatershed plansTarget areas based onsubwatershed planssubwatershed planssubwatershed plans,engineering design, funding
Table 3.6. Action <strong>Plan</strong> for the Middle <strong>Huron</strong> <strong>River</strong> <strong>Watershed</strong>Goals and Objectives AddressedCost<strong>Management</strong> Alternative1 Reduce Flow Variability2 Reduce NPS Nutrient Loading3 Natural Features Protection & Mitigation4 Increase Public Awareness5 Reduce Erosion and Sedimentation6 Implementation of WMP7 Continue Monitoring & Data CollectionResponsibleLevel of EffortCapitalAnnualProjectDuration/TimelineRecommendedLocationsTechnical/FinancialResourcesProtect, stabilize and restore stream banks and channels through89engineering/bio-engineering Washtenaw County; LocalGovernments; UM; Private 2 project by year 2, 3 by year 5 $90/ft. 1 ; $1,650,000 3 $1.80/ft 1 1-2 year projectsLandownersTarget areas based onsubwatershed planssubwatershed plans,engineering design, fundingStructural90 Install swirl concentrators WCDC, local governments1-2 pilot projects by year 2;evaluation report by year 31-year per projectTarget inlets based onsubwatershedmanagement plansEngineering design,constructionConstruct new storm water facilities and retrofit existing storm water91 facilities to detain first flush and bank full storms and remove sediment.Execute capital improvements to create new storm structures.Construction -- Mobilization: 3%-5% of construction costs; Siteprep.: $3000-$6000 per acre forWashtenaw County; Local1-2 new projects by year 2, 5 by clearing; $2.50-$6/cu. yd forGovernments; UM; Privateyear 5excavation; $3000-$7000 forLandownerseach inlet/outlet. Design andcontingencies 25-30%construction costs. 21-2 years per projectTarget areas based onsubwatershed plansWCRC, WCDC, AAPS,PfizerInstall/retrofit water quality sumps or other pre-treatment devices into92catch basins, including regular maintenance and cleanout WCDC; Local Governments1-2 new projects by year 2, 5 byyear 51-year per projectTarget catch basinsbased on subwatershedmanagement plansEngineering design,constructionFord Lake nuisance algae engineering pilot project, engineering93implementation project and oxygen injection equipmentPrioritize and execute infrastructure repairs to drains and tributaries and94expand removal of sediment islands to county drains. Ypsilanti Township, City ofYpsilantiWCDC; WCRC; LocalGovernmentsContinue experimentation underDr. Lehman2-3 proejcts per year Annual$60,000 pilot project 5 ;$100,000 implementationproject 5 ; $22,000 injectionequipment 5 3-5 years Ford Lake U of MPriority drains based oninventoryWCDC95 Stabilize roads and bridgesWCRC; Local Governments;1-2 projects per yearUMconstruction -- Mobilization: 3%-5% of construction costs; Siteprep.: $250/ton avg. formulching; $2-4/sq. yd forgeotextile fabric; $1.50-$6 forseeding; $2-$3.50 for sod;$30/sq. yd. For rirap; design andcontingencies 25-30%construction costs. 71-2 years per projectPriority roads and bridgesbased on inventoryWCRC, MDOTConstruct appropriate recreational access points to reduce erosion andprotect banks and shorelines. Engage livery and marina operations to96establish no wake zones and similar managerial BMPs to properlycontrol erosion associated with recreational uses Local Governments 1-2 projects per year 1 year per projectHeavy access pointsfrom inventoryMDNR97 Daylight streams, where technically feasible and cost-effective WCDC; Local Governments 275 feet (Millers Creek) $540,000 3 <strong>Watershed</strong> ImprovementSee "Millers Creek<strong>Plan</strong>"Pfizer98 Modify roof drains from directly connected impervious areas Local Governments500 disconnections by year 2;1,500 by year 5Variable, depending on thelength of drain 1 ; $374,000 3 N/A 5 yearsSee "Millers Creek<strong>Watershed</strong> Improvement<strong>Plan</strong>" and othersHRWC, WCDCInventory opportunities and promote LID (i.e. rain gardens, rain barrels,99green roofs, porous pavement) WCDC; Local GovernmentsComplete desktop analysis byyear 1, USSR by year 3,complete plan by year 5$100/rain barrel; $12-$24/sq. ft.of green roof 7 ; $40,000-$80,000/acre of porouspavement 7 ; $7,000 pilot project5 years <strong>Watershed</strong>-wideLID guidebook, training,CWP100 Construct BMP demonstration sites on both private and public lands Local Governments; PrivateLandowners1-2 demonstrations per year Variable, depending on BMP 5 yearsTarget areas based onsubwatershed plansSubwatershed plans, HRWC,WCDC1 Mill Creek WMP 2 Chain of Lakes WMP 3 Millers Creek WIP 4 NPS-RIP 5 Ypsilanti Twp. 6 City of Ann Arbor 7 Lower <strong>Huron</strong> WMP
3.5.3 Action <strong>Plan</strong> StrategiesThe action items in Table 3.6 present the commitments by the communities within the Middle<strong>Huron</strong> <strong>Watershed</strong> to comprehensively address the impairments in the watershed. Thecommunity partners have developed separate schedules for addressing each of the majorimpairments for which TMDLs have been established. The following sections include updatedimplementation summaries for addressing phosphorus, E. coli, and biota/sediments. Finally, thespecific Public Information and Education <strong>Plan</strong> is included.3.5.3.1 Phosphorus Reduction StrategyIn order to meet the phosphorus reduction target of 50% for the region, the participatingcommunity partners to the Middle <strong>Huron</strong> Cooperative Agreement (see Appendix B) developed aTMDL Implementation <strong>Plan</strong> to address and reduce both point and non-point sources ofphosphorus. The plan, completed in 2011, is included in Appendix C along with an updatedtable of phosphorus reduction activities that includes loading reduction estimates, a schedule,and cost estimates.As discussed in section 2.5.1, the nonpoint source phosphorus load reduction target is 14,035lbs/yr. This target includes the Mill Creek Subwatershed. The point sources in the system arealready exceeding their reduction targets by 6,123 lbs.Table 3.7 is a summary of the non-point source reduction activities from the Middle <strong>Huron</strong> NonpointSource RIP along with their loading reduction estimates, schedule and cost estimates.Loading reduction estimates are based on published estimates when available or analysis usingthe <strong>Watershed</strong> Treatment Model. 14 See Appendix K for the model and additional load reductioncalculations.Table 3.7 Non-point Source Reduction Implementation <strong>Plan</strong> Summary of Major ActivitiesActivity Category P LoadReductionImplementationTimeframeCost Estimateover Five YearsEstimate (lbs/yr)Mill Creek Subwatershed<strong>Management</strong> <strong>Plan</strong>9,043 Scheduled 2004-2008. $5.21 MIllicit Discharge Elimination 533Complete implementation by2006; investigations ongoing$278,000Septic Inspection and Repair 1,440 Ongoing program $32.0 MPhosphorus Fertilizer2,077Enact in 2006. Ongoing$96,000Reduction OrdinanceYard Waste and other publiceducation992Pet Waste education 1,951Street sweeping 359Construction Site RunoffControlMalletts Creek RegionalDetention1,6411,000Ann Arbor-Ypsilanti Metropolitan Area 3-45<strong>Watershed</strong> <strong>Management</strong> <strong>Plan</strong>O&M.Current. Annual campaignsongoing.Began in 2003. Annualcampaigns ongoing.Annual sweeping in sectionsof Ann Arbor, Ypsilanti andU of MOngoing program. Regularinspection, O&M.Construction complete in2007. O&M and monitoringthrough 2009.$200,000$200,000$967,500$3.13 M$2.75 M
Malletts CreekReconstruction <strong>Plan</strong>ActivitiesMillers Creek <strong>Watershed</strong>Improvement <strong>Plan</strong>1,000383Schedule through 2009.Schedule through 2014$16.4 M$9.5 MTotals 20,419 $70.77 MThus, the activities conducted by the point sources, along with those included in the Non-pointSource RIP will account for more than the needed load reduction in order to meet the reductiontarget for the watershed.3.5.3.2 Pathogen Reduction StrategyAs indicated in section 2.5.1, no specific loading targets were set for the E. coli TMDL since it isconcentration based. It is quite difficult to estimate loading reductions for pathogenimpairments. It also is not entirely appropriate to focus on load reductions since the impairmentitself is based on point counts or concentrations. The focus is better placed on activities toreduce E. coli sources.The E. coli TMDL Implementation <strong>Plan</strong> was developed to establish an effective strategy toreduce potential sources through a set of implementation activities. Please refer to that strategyfound in Appendix D for more details on activities, impacts, schedules and cost estimates. Inaddition to the programs and activities included in that plan, a Trap, Neuter and Release (TNR)Program will be initiated by the Washtenaw County Drain Commission. That program will dothe following:• Trap, neuter, and release feral cats to reduce feral populations;• Educate cat owners about neutering at the point of contact, veterinarian offices and theHumane Society;• Educate pet owners about E. coli pollution and scooping waste at points of contact; and• Produce I & E materials for individual distribution and media.3.5.3.3 Biota Improvement StrategyBiota TMDLs have been established for Malletts Creek and Swift Run. A completed plan foraddressing the biota impairments in Malletts Creek can be found in the implementation plan inAppendix F and in the TMDL Implementation <strong>Plan</strong> in Appendix X. The overall phosphorusreduction under this plan is 50% and well over the 106 tons per year of TSS reduction requiredby the TMDL. These reductions come at a cost of $19.1 million. This plan indicates thatactivities designed to address the phosphorus TMDL for Ford and Belleville Lakes will have thesecondary benefit of more than addressing the sediment loading reduction targets set for thebiota TMDLs.Swift Run Improvement StrategyA TMDL Implementation <strong>Plan</strong> for Swift Run was developed in 2011, and can be found inAppendix Y. Below is a summary of earlier proposed actions. Refer to Appendix Y for moreupdated information.Table 3.6 lists a number of actions that can be undertaken to address the hydrologicdegradation and sediment transport that is targeted as the source of biota impairment. Some ofthe broad-based programs will have the effect of mitigating peak flows and reducing sedimentAnn Arbor-Ypsilanti Metropolitan Area 3-46<strong>Watershed</strong> <strong>Management</strong> <strong>Plan</strong>
transport in Swift Run. In addition to these programs, a desktop analysis of the creekshed,looking at land use patterns, hydrology, and critical areas for sediment transport was conductedto inventory potential areas for projects specifically designed to reduce hydrologic andsedimentation impacts on aquatic habitat in Swift Run. A set of 34 “Improvement Opportunities”were identified within the creekshed that could control erosion, reduce sediment transport,detain or slow runoff, reduce channel erosion or increase storage capacity. These opportunitieswill be further evaluated to determine the feasibility of each potential project and prioritize eachproject for implementation. It is anticipated that a selection of these projects will beimplemented over the next five years to address the problem sources in the creekshed andimprove the aquatic habitat to allow for improvement of bentic biota measures.The improvement opportunities were classified into the following eight categories:• Channel Improvement – including streambank and streambed stabilization;• Crop BMPs – including planting grassed swales, grade stabilization, buffer planting,conservation cover, rotation and tillage, filter strips, drain naturalization, drain tileremoval, and nutrient management;• New Detention – including construction of detention ponds, wetlands, bioswales orinfiltration basins;• Residential BMPs – including rain barrels, rain gardens, downspout disconnections, treeplanting, and targeted education;• Basin Retrofits – including reconstruction of existing flood control structures to providesediment trapping and longer retention times;• Enhanced Floodplain – including floodplain connections, native planting and seeding,and access reduction;• Vegetative BMPs – including buffer planting, natural area restoration, and reforestation;and• Wetland Improvement – including hydrologic restoration, invasives removal, andestablishment of native species.Specific activities are described in section 3.5.1 and Table 3.6. A map of improvementopportunity locations is included as Figure 3.1. Relevant broad-scale project activities and theabove improvement activities are listed in Table 3.8 for use in estimating anticipated loadreductions toward TMDL targets. In this case, TSS load reductions are estimated based on theWTM model and five-year cost estimates are also indicated based on figures from Table 3.6(unless otherwise indicated).Table 3.8 Inventory of management practices to address biota TMDL (TSS based) forSwift Run<strong>Management</strong>PracticeResponsibilityLevel of effortEstimated TSSLoad Reduction(tons/year)Estimated 5-yearCostsPublic EducationWCDC, Ann Arbor,Ann Arbor Twp,Pittsfield TwpAcross creekshedUNKNOWNStreet SweepingAnn Arbor, WCRoad CommissionTwice per year 7.4 $14,525Ann Arbor-Ypsilanti Metropolitan Area 3-47<strong>Watershed</strong> <strong>Management</strong> <strong>Plan</strong>
Construction SiteErosion ControlWCDC, Ann Arbor,Ann Arbor Twp,Pittsfield TwpNew construction increekshed36.4 $122,000ChannelImprovementWCDC, Ann Arbor 4,500 linear feet 2.4 $1,500,000Crop BMPsWCDC, NRCS6 projects inheadwatersagriculture property5.0 $69,500 1New DetentionWCDC, Ann Arbor,Ann Arbor Twp,Pittsfield Twp3 potential projects 1.0 $90,000Residential BMPsWCDC, Ann Arbor,Ann Arbor Twp,Pittsfield TwpTargeted residentialareas . ~ 200 acres3.8 $74,074 2Basin RetrofitsWCDC, Ann Arbor,Ann Arbor Twp,Pittsfield Twp4 potential projects 4.9 $200,000EnhancedFloodplainWCDC, Ann Arbor 8 acres 2.0 $500,000 3Vegetative BMPsWetlandImprovementWCDC, Ann Arbor,Ann Arbor Twp,Pittsfield TwpWCDC, Ann Arbor,Ann Arbor Twp,Pittsfield Twp0.75 stream miles 0.25 $30,300100 acres 2.2 $75,600Totals 65.35 $2.68 M(1) Estimated from Mill Creek Subwatershed <strong>Plan</strong>(2) Estimate from Millers Creek 319 project extrapolation(3) Estimate from Millers Creek Improvement <strong>Plan</strong>The activies under this plan exceed the load reduction target by a factor of almost ten. Specificprojects need to be identified and prioritized. Opportunistic implementation can then follow byworking toward the most promising projects first. Note that some project types, like channelimprovement rely on prerequisite implementation of other projects in order for them to beeffective. This sequencing will also need to be taken into account.Ann Arbor-Ypsilanti Metropolitan Area 3-48<strong>Watershed</strong> <strong>Management</strong> <strong>Plan</strong>
3.5.3.4 Information and Education <strong>Plan</strong>The Information and Education <strong>Plan</strong> for the Middle <strong>Huron</strong> <strong>Watershed</strong> follows the model laid outin Developing a Communications <strong>Plan</strong>: A Roadmap to Success 15 , which was developed forcommunities in the <strong>Huron</strong> <strong>River</strong> <strong>Watershed</strong> through funding provided by the MDEQ and U.S.EPA. As a result of having an Information and Education <strong>Plan</strong> already developed for the <strong>Huron</strong><strong>River</strong> <strong>Watershed</strong>, market research did not need to be conducted for the watershed since it hadbeen completed previously.Goal of the Information and Education <strong>Plan</strong>The goal of the plan is to create an awareness of water quality and watershed issues that willpromote positive actions to protect and enhance the integrity of the Middle <strong>Huron</strong> <strong>Watershed</strong>.Measurable ObjectivesThe objectives of the plan are to1. Reduce pollution that impacts the Middle <strong>Huron</strong> <strong>Watershed</strong> by providing practicalknowledge to key audiences;2. Increase the general public’s awareness and knowledge of the <strong>Watershed</strong> and theinterconnectedness of the system;3. Increase activities that result in preservation, restoration and protection of the <strong>Watershed</strong>system; and4. Increase participation in <strong>Watershed</strong> stewardship and recreation.Audience and Message PrioritiesTarget audiences were selected based on the goals and objectives for the Information andEducation <strong>Plan</strong>. In general, the communities in the <strong>Watershed</strong> can be characterized as eitherurban centers surrounded by suburban sprawl, such as the Ann Arbor and Ypsilanti, orsuburban communities facing issues of rapid development, such as Pittsfield and ScioTownships. Socio-economic variability between communities will also be taken into accountwhen determining messages. The land uses within these communities determine how to tailorthe message to <strong>Watershed</strong> communities.The following groups were selected: households, with riparian and lakeshore landowners beingan important sub-group; local government decision makers; businesses; developmentcommunity; education/school system; partner organizations; and to a lesser extent, theagricultural community.With the target audiences identified, water resource-related behaviors associated with theaudiences were brainstormed and prioritized according to which behaviors will have the mostimpact on the goal and objectives of the Information and Education <strong>Plan</strong>. Concurrently the planintegrates community interest in what is most important to accomplish and what is feasible toaccomplish given organizational resources.What we do in our own backyards has detrimental impacts many homeowners never conceive.The plants in our yards and businesses, and the way we maintain them, are significant sourcesof water quality and environmental pollution (Swan, 1999). Nonetheless, surveys indicate thatless than one-fourth of homeowners rate fertilizers as a water quality concern (Syferd, 1995 andAssing, 1994). The majority of land owners with lawns are not aware of the phosphorus ornitrogen content of the fertilizer they apply or that mulching grass clippings into lawns canAnn Arbor-Ypsilanti Metropolitan Area 3-50<strong>Watershed</strong> <strong>Management</strong> <strong>Plan</strong>
educe or eliminate the need to add fertilizer (Morris and Traxler, 1996). Understandingmotivations of homeowners is key to guiding them to behaviors that are less degrading to waterresources.The prioritized messages by target audience, based on current knowledge of audiences’behaviors, are the following:Households1. Creekshed awareness: sense of place within watershed, water cycle and how we impact it,including key pollutant sources2. Water-friendly lawn and garden practices: mowing habits; fertilizer/pesticide use; yard wastedisposal; erosion control; landscaping with native plants; water conservation3. Housekeeping practices and toxics disposal4. Septic system maintenance5. Surface water retention: e.g., retaining water via rain barrels and washing cars on lawnRiparian and Lakeshore Landowners1. Creekshed awareness: sense of place within watershed, water cycle and how we impact it,including key pollutant sources2. Riparian land management including importance of vegetated buffers3. Water-friendly lawn and garden practices: mowing habits; fertilizer/pesticide use; yard wastedisposal; erosion control; landscaping with native plants; water conservation4. Septic system maintenance5. Housekeeping practices and toxics disposalLocal Government Decision Makers1. Participation in watershed & education plan network2. Identification and protection of key habitats and features: aquatic buffers, woodland,wetlands, steep slopes, etc.3. Coordinate master plans and planning issues with neighboring communities4. Ensure use of Low Impact Development in development oversight5. Ensure use of innovative stormwater BMPsDevelopment Community1. Advantages of and opportunities for open space protection & financial incentives forconservation2. Advantages of and opportunities for Low Impact Development3. Impact of earth moving activities/Importance of soil erosion & sedimentation controlpractices4. Identification and protection of key habitats and features: aquatic buffers, woodland,wetlands, steep slopes, etc.5. Creekshed awareness: sense of place within watershed, water cycle and how we impact it,including key pollutant sourcesBusinesses1. Water-friendly lawn and garden practices: mowing habits; fertilizer/pesticide use; yard wastedisposal; erosion control; landscaping with native plants; water conservation2. Proper toxic chemical use, storage & disposal3. Advantages of and opportunities for innovative stormwater management4. Storm drain use and awarenessAnn Arbor-Ypsilanti Metropolitan Area 3-51<strong>Watershed</strong> <strong>Management</strong> <strong>Plan</strong>
Participation in the Community Partners for Clean Streams Program, through the WashtenawCounty Drain Commissioner’s Office, provides businesses with information on these messages.Educators/School Systems1. Adoption and promotion of state-approved watershed curriculum2. Creekshed awareness: sense of place within watershed, water cycle and how we impact it,including key pollutant sources3. Active participation in creekshed activities and stewardship projects4. Water-friendly lawn practices: mowing habits; fertilizer/pesticide use; yard waste disposal;erosion control; landscaping with native plants; water conservation5. Partnerships with the private sectorPartners Organizations1. Creekshed awareness: sense of place within watershed, water cycle and how we impact it,including key pollutant sources2. Active participation in creekshed activities and stewardship projects3. Communicate creekshed issues to members and residents4. Participate in public communications plan networkAgricultural Community1. Advantages of and opportunities for buffer and filter strips2. Impact of tillage methods/Importance of agricultural soil erosion & sedimentation controlpractices3. Impacts of fertilizer/pesticide use and mitigation options4. Impacts of livestock waste and mitigation options5. Opportunities for farmland conservation partnershipsIn this world of limited resources, it is necessary to further prioritize the audiences andmessages in terms of the level of effort to be directed toward an audience. By asking “Whichaudience will be most important for our education program so as to restore and protect waterquality and quantity?” a prioritization of audiences was determined. The audience priorities forthis plan are:1. Households2. Riparian and Lakeshore Landowners3. Local Government Decision Makers4. Development Community5. Businesses6. Educators/School Systems7. Partner Organizations8. Agricultural CommunityTo establish a methodology for reaching the target audiences, a two-pronged strategy wasdeveloped and projected for five consecutive years. Effectiveness of the media campaign andthe personal communication strategy should be evaluated annually. Results from the evaluationshould be used to assess the previous year’s efforts and be a guide to shape the work in thecoming year. Expect the level of effort to change as success is achieved and positive behavioralchanges occur in the coming years. A full review of the Information and Education <strong>Plan</strong> shouldbe conducted upon completion of the third and fifth years.One part of the strategy involves passive mechanisms to reach target audiences via multiplemass media outlets. This strategy can include print, radio, television advertising, and direct mail,Ann Arbor-Ypsilanti Metropolitan Area 3-52<strong>Watershed</strong> <strong>Management</strong> <strong>Plan</strong>
marketing, door hangers, or point of sale literature. These methods and many more aredescribed in Jennifer Wolf’s Marketing the Environment – Achieving Sustainable BehaviorChange through Marketing (2002), a guidebook to understanding and using commercialmarketing techniques to create lasting behavior change. The audiences deemed appropriate bythe Workgroup for the strategy were (1) households, (2) riparian and lakeshore landowners, (3)businesses, and (4) agricultural community.The second prong of the strategy is more hands-on in nature using a tailored approach to reachaudiences about targeted behaviors which affect watershed quality and what audiences can doto alter their behavior for the better. The focus of this effort should be on (1) local governmentdecision makers, (2) the development community, (3) businesses, (4) educators/school system,and (5) partner organizations via presentations and other face-to-faceinteraction/communication. Table 7.1 illustrates the suggested breakdown of communicationsstrategy per target audience.Table 3.9. Prioritized Target Audiences per Communications StrategyCommunications StrategyMass MediaHouseholdsRiparian and Lakeshore LandownersBusinessesAgricultural CommunityPersonal Communication/InteractionLocal Government Decision MakersDevelopment CommunityBusinessesEducators/School SystemsPartner OrganizationsInformation and Education StrategyThe main foci of the first year will be on communicating with household members within the<strong>Watershed</strong>, with a concerted effort to reach residents along waterways and waterbodies andfarmers. Some 85 percent of the efforts to be expended in this first year will be directed towardhouseholds, with the remaining 15 percent concentrated on businesses. In the second and thirdyears, efforts focused on businesses will drop down to 10 percent, with a correspondingincrease in reaching households. In the fourth and fifth years, the efforts will focus entirely onhouseholds with an increased emphasis on farmers and residents in riparian and lakeshoreareas.The primary goal of the first and second years will be to develop awareness within thecommunities in the <strong>Watershed</strong> of the water cycle and how we impact it, including key pollutantsources, and a sense of place within <strong>Watershed</strong>. Educating residents on practices andbehaviors they can implement in their lives which will result in improvement and protection ofthe <strong>Watershed</strong> will be an emphasis as well. In the third, fourth and fifth years, messages willbuild on those developed in the preceding years.HRWC’s Developing a Communications <strong>Plan</strong> will be combined with pre-existing information andeducation plans created by each community (Phase I and II public education plans andSWIPPIs) to guide the process of determining appropriate materials, media, budgets andtimeframes, and measurements of progress. However, the following recommended educationalAnn Arbor-Ypsilanti Metropolitan Area 3-53<strong>Watershed</strong> <strong>Management</strong> <strong>Plan</strong>
message and initiatives can provide the framework for further development of the publiccommunications efforts:• Acceptable application and disposal of pesticides and fertilizers and simple lawn waterquality-friendly maintenance alternatives• Availability, location and requirements of facilities for disposal or drop-off of householdhazardous wastes, travel trailer sanitary wastes, chemicals, grass clippings, leaf litter,animal wastes, and motor vehicle fluids• Encourage public reporting of the presence of illicit discharges or improper disposal ofmaterials into a separate stormwater drainage• Preferred cleaning materials and procedures for residential car washing• Public responsibility for and stewardship of their watershed, and promote awareness ofand participation in existing stewardship and monitoring programs• <strong>Management</strong> of riparian lands to protect water quality• Ultimate discharge point and potential impacts of pollutants from the separate stormwater drainage system serving their place of residence. For example, promoteawareness of stormwater runoff, simple mitigation activities, and the importance ofimperviousness to water quality.• Impact of impaired septic systems on water quality and promote knowledge ofmaintenance guidelines• Awareness of the watershed concept, sense of place within the watershed, and thebenefits of a healthy watershed• Importance of proper erosion and soil control measures and existence of currentoversight programs• Promote education of local government employees on water quality-related goodhousekeeping/pollution prevention• Alternatives to current development and land use practices within the <strong>Watershed</strong>• Build knowledge, awareness, and support of the <strong>Watershed</strong> plan and itsrecommendations• Encourage watershed-friendly business practices and site development (e.g.,Washtenaw County’s Community Partners for Clean Streams)• Benefits of proper pet waste and livestock waste handling• Benefits of water conservation measures for households• Benefits of landscaping with native plantingsAnn Arbor-Ypsilanti Metropolitan Area 3-54<strong>Watershed</strong> <strong>Management</strong> <strong>Plan</strong>
Several programs and initiatives are recommended for initiation in this <strong>Watershed</strong> plan. Below isa list of subwatershed-wide programs to be implemented in stages I and II of this plan. ‘1. Targeted Advertising in local papers as appropriate for participating partners. Likelytopics include yard and garden maintenance best practices and storm drain awareness.2. Direct Mail Piece consisting of tip cards, brochure or community calendar. Topics will besimilar to advertising.3. Rain Garden and Rain barrel Promotion through the Washtenaw County DrainCommissioner and the HRWC respectively.4. HRWC’s Adopt-A-Stream Program <strong>River</strong> monitoring and stewardship program. Programinvolved 400 volunteers per year monitoring ~75 sites per year.5. Washtenaw County’s <strong>River</strong> Safe Home Program. The <strong>River</strong>Safe Homes programenables Washtenaw County residents to identify water quality protection activities theycurrently practice around their homes, and to commit to additional pollution preventionpractices that they may not have considered before.6. Content for Websites, newsletters, and informational booths and material.Earlier in this chapter, the Action <strong>Plan</strong> (Table 3.6) presents recommended public informationand education strategies listed with details about priority pollutants addressed, costs, evaluativemechanisms, responsible parties, and so on.1Brown, E., A. Peterson, R. Kline-Roback, K. Smith, and L. Wolfson. February, 2000. Developing a<strong>Watershed</strong> <strong>Management</strong> <strong>Plan</strong> for Water Quality; and Introductory Guide, Institute for WaterResearch, Michigan State University Extension, Michigan Department of Environmental Quality,P.10.45 R323.1100 of Part 4, Part 31 of PA 451, 1994, revised 4/2/99.2 Washtenaw County Drain Commissioner. Septic System Website.http://www.ewashtenaw.org/living/environmental_health_and_services/environmental_portal/septic_systems. Accessed November 2007.3 The Rouge <strong>River</strong> Project. 2004. Overview Description of OSDS <strong>Management</strong> Program.http://www.rougeriver.com/techtop/osds/overview.html. Accessed 2005.4 Aichele, Steven S.. 2005. Effects of Urban Land-Use Change on Streamflow and Water Quality inOakland County, Michigan, 1970-2003, as Inferred from Urban Gradient and Temporal Analysis.U.S. Geological Survey Scientific Investigations Report 2005-5016.5 Skadsen, Janice M.,B.L Rice, D. J. Meyering, 2004. “The Occurrence and Fate of Pharmaceuticals,Personal Care Products and Endocrine Disrupting Compounds in a Municipal Water Use Cycle: A CaseStudy in the City of Ann Arbor.” City of Ann Arbor, Water Utilities. < http://www.ci.annarbor.mi.us/PublicServices/Water/WTP/EndocrineDisruptors.pdf>6 American Farmland Trust. 2001. Protecting farmland makes fiscal sense for two townships in CalhounCounty. AFT, East Lansing, MI.7 American Farmland Trust. 2002. Farming on the edge. Washington, D.C.: American Farmland Trust.8 Ibid.Ann Arbor-Ypsilanti Metropolitan Area 3-55<strong>Watershed</strong> <strong>Management</strong> <strong>Plan</strong>
9 Michigan Land Use Institute. 1999. Evidence of deep ideological attack on the state wetlands law. MLUI.Winter 1999 Great Lakes Bulletin.10 Olsson, K., and E. Worzalla. 1999. Advance Identification of Wetlands: Enhancing CommunityWetlands Protection and Restoration in the North Fork, Mill Creek. Final Report Submitted to the U.S. Environmental Protection Agency. Ann Arbor, MI: <strong>Huron</strong> <strong>River</strong> <strong>Watershed</strong> <strong>Council</strong>.11 Galli, J. August 1992. Analysis of Urban BMP Performance and Longevity in Prince George’s County,Maryland. Department of Environmental Programs. Metropolitan Washington <strong>Council</strong> ofGovernments.12 U. S. Environmental Protection Agency, Office of Water, NPDES Program, Menu of Stormwater Best<strong>Management</strong> Practices, June 2005.13 Lower One Subwatershed Advisory Group. 2001. Lower One Rouge <strong>River</strong> Subwatershed <strong>Management</strong><strong>Plan</strong>. Rouge <strong>River</strong> Wet Weather Demonstration Project.14 Center for <strong>Watershed</strong> Protection. <strong>Watershed</strong> Treament Model (WTM) – Version 3.1. Downloaded fromhttp://www.stormwatercenter.net/. 2007.15 Brush, L. 1996. Developing a Communications <strong>Plan</strong>: A Roadmap to Success. <strong>Huron</strong> <strong>River</strong> <strong>Watershed</strong><strong>Council</strong>.Ann Arbor-Ypsilanti Metropolitan Area 3-56<strong>Watershed</strong> <strong>Management</strong> <strong>Plan</strong>
CHAPTER 4:IMPLEMENTATION AND EVALUATIONThis chapter outlines considerations in the implementation and evaluation of the Middle <strong>Huron</strong><strong>Watershed</strong> <strong>Management</strong> <strong>Plan</strong>, as well as the interplay between evaluation and implementation,which shapes the revision process. A successful watershed plan is ultimately defined not by whatis written on the pages of the plan, but by how the recommended plans and programs are put intoaction. A successful plan for implementation also recognizes that the state of the watershedchanges over time. As such, evaluating the effectiveness and appropriateness of the actionstaken to implement the plan, as well as the ability to adapt these actions to the changingconditions of the watershed, is critical.4.1 INTEGRATED WATERSHED MANAGEMENT AND ADAPTIVEMANAGEMENTA watershed is a complex, integrated system, and its whole is greater than the sum of its parts.This complexity stems from the ever-changing interaction of social, economic, and biophysicalforces. The interplay of these forces, as shown in Figure 4.1, is the basis for the concept ofintegrated watershed management.Figure 4.1. Forces Affecting Integrated <strong>Watershed</strong> <strong>Management</strong> 1Ann Arbor-Ypsilanti Metropolitan Area 4-1<strong>Watershed</strong> <strong>Management</strong> <strong>Plan</strong>
Integrated watershed management is, by definition, dynamic in nature. Implementing the Middle<strong>Huron</strong> <strong>Watershed</strong> <strong>Management</strong> <strong>Plan</strong> in a way that follows the principles of integrated watershedmanagement therefore requires continuous evaluation of the effectiveness of the managementalternatives in meeting the <strong>Plan</strong>’s goals and objectives. The concept of “adaptive management” iscentral to successful implementation of the <strong>Plan</strong>. Adaptive management incorporates researchinto conservation action. Specifically, it is the integration of design, management, and monitoringto systematically test assumptions in order to adapt and learn.The goals and recommendations of this <strong>Plan</strong> are based on the understanding of the conditions ofthe natural watershed ecosystem at the time this <strong>Plan</strong> was developed. However, both theconditions of the watershed and the goals and actions will change over time as new information iscollected, available resources for implementation are assessed, and the values and needs of thewatershed’s residents evolve.As stated by Veissman (1990) in Heathcote’s Integrated <strong>Watershed</strong> <strong>Management</strong>: Principles andPractices: 2<strong>Watershed</strong> management institutions evolve from needs identified at somemilestone in time. The problem is that times change, and so do needs.Unfortunately, institutions seem to march on with entrenched constituencies,and many in existence today are addressing yesterday’s goals or addressingtoday’s problems with yesterday’s practices.Changes in social and economic forces can trigger changes in watershed management practices.Similarly, changes in a watershed’s ecosystem can indicate a need for altered watershedmanagement practices. Adaptive management recognizes the dynamic interplay of these forces,which implies a need to continually evaluate progress toward meeting the <strong>Plan</strong>’s goals andobjectives.4.2 WATERSHED PLAN IMPLEMENTATIONThe communities in the Middle <strong>Huron</strong> <strong>Watershed</strong> will implement and report on progress throughtwo primary vehicles. First, all the communities have signed a voluntary Cooperative Agreementwith MDEQ to address the TMDL for phosphorus in Ford and Belleville Lakes through the Middle<strong>Huron</strong> Partnership. Second, the WCDC convenes Washtenaw communities quarterly to discussand coordinate Phase II stormwater activities. Both of these bodies provide a structure for• reporting out on progress toward the WMP goals and objectives,• coordinate regional activities and projects,• discuss new developments that require attention or action,• consolidating funding for watershed management activities,• providing public input and involvement,• educating community representatives, and• discussing WMP updates.To ensure successful implementation, nine key elements should be addressed, as summarized inTable 4.1.Ann Arbor-Ypsilanti Metropolitan Area 4-2<strong>Watershed</strong> <strong>Management</strong> <strong>Plan</strong>
Table 4.1. Nine Key Elements of Successful <strong>Watershed</strong> <strong>Plan</strong> Implementation 31. Appoint a single lead agency to act as an advocate and facilitator for the plan with thecommunity and with political representatives.2. Strong linkages to existing programs, including local and regional land use planningprocesses, water quality and flow monitoring programs, and similar programs, tooptimize use of available information and minimize duplication of effort.3. Clear designation of responsibilities, timetables, and anticipated costs for project actions.4. Effective laws, regulations, and policies to provide a framework for the tasks identified inElement 3.5. Ongoing tracking of the degree of implementation of management actions and of thesuccess of those actions once implemented.6. Ongoing monitoring and reporting of progress, both to assess the effectiveness ofindividual actions and to sustain public and political interest in and enthusiasm for the plan.7. Ongoing public education and communication programs to consolidate and enhancethe social consensus achieved in the planning process.8. Periodic review and revision of the plan.9. Adequate funding for these activities.4.2.1 Advisory Committee StructureTo facilitate implementation of the Middle <strong>Huron</strong> <strong>Watershed</strong> <strong>Management</strong> <strong>Plan</strong> over time, aframework for a series of working groups within the Middle <strong>Huron</strong> Partnership Initiative andWashtenaw Phase II Citizen’s Advisory Committee will help to provide a useful feedback loop fordetermining how, and the extent to which, the goals and objectives of the <strong>Plan</strong> are beingsuccessfully implemented. These working groups would ideally be comprised of the followinggroups of stakeholders:• Managers, planners, coordinators, and their staff members• Boards and steering committees• Volunteers (citizens and watershed stewards)• Environmental Interest Groups• Funding GroupsThese groups of stakeholders should ultimately allow for input and implementation assistancefrom a broad cross-section of all stakeholder and interest groups in the watershed. Figure 5.2provides a theoretical example of a two-tier advisory committee structure that could be employedto oversee the implementation and evaluation of the Middle <strong>Huron</strong> <strong>Watershed</strong> <strong>Management</strong> <strong>Plan</strong>.Ann Arbor-Ypsilanti Metropolitan Area 4-3<strong>Watershed</strong> <strong>Management</strong> <strong>Plan</strong>
A multi-tiered advisory structure is better suited for large watershed planning projects, as is thecase in the Middle <strong>Huron</strong> <strong>Watershed</strong>, as opposed to a single-tiered structure which is better suitedfor smaller, short-term projects. 4Figure 4.2. A Typical Two-tier Advisory Committee StructureTechnicalAdvisoryCommitteeWaterQualityHydrologyInfrastructureComputerModelingProponentSteeringCommittee(seniorgovernmentofficials)ScientificAdvisoryCommitteeHumanHealthHabitatFisheriesWildlifePublicAdvisoryCommitteeNewsletterMediaOutreachPublicMeetingsPublicActivitiesExecutive Technical SubcommitteeLevel Level LevelA committee structure based on the organization shown in Figure 5.2 could be used to implement,evaluate, and revise the watershed plan over time. The “proponent” (lead agency) in thisschematic would be the Washtenaw County Drain Commissioner’s Office, which would ultimatelyprovide support for, and oversight of, the activities of the Steering Committee and smallercommittee/ subcommittee levels. The “Steering Committee,” in this watershed would be theMiddle <strong>Huron</strong> Partners, which is comprised of environmental program managers and staff whorecommend final decisions to be coordinated with support from the <strong>Huron</strong> <strong>River</strong> <strong>Watershed</strong><strong>Council</strong> and Washtenaw County Drain Commissioner. The “advisory committees” might bestaffed by land use planners, commissions, boards, interested citizens, environmental groupadvocates, scientists, etc. that will pull together various aspects of the data and results during theimplementation phases of the <strong>Plan</strong>.The importance of public representation and broad stakeholder involvement throughout anyadvisory committee structure must be stressed, as these individuals are in a position to explainand influence community opinion and help to build support for needed changes. Following theapproval of this <strong>Plan</strong>, the Washtenaw County Drain Commissioner’s office and current membersof the Middle <strong>Huron</strong> Partnership should consider an advisory committee structure that allows forinvolvement by a broad range of stakeholders as discussed above.The Middle <strong>Huron</strong> Partnership InitiativeAnn Arbor-Ypsilanti Metropolitan Area 4-4<strong>Watershed</strong> <strong>Management</strong> <strong>Plan</strong>
The original 1999 Agreement for Voluntary Reduction of Phosphorus Loading to the Middle <strong>Huron</strong>states that this cooperative approach to meeting the TMDL will be pursued by the partnercommunities and agencies, and then reevaluated in 2004 to determine whether the goals havebeen attained. With the expiration of the 1999 Agreement in April 2004, the partners formed asub-committee to create a replacement agreement since the phosphorus reduction goal of theTMDL has not yet been attained. The 2004-2009 Agreement was completed in early fall 2004after review by the partners. All current partners were presented with the opportunity to sign thecurrent agreement; as of completion of this annual report not all of the partners that intend to signthe document have done so. Several of the larger businesses that have NPDES permits todischarge to the middle <strong>Huron</strong> <strong>River</strong> <strong>Watershed</strong> also were approached during the drafting of theAgreement to gain their support as signatories. Interested businesses are included at the end ofthe Agreement.Washtenaw County Phase II Citizens Advisory Committee4.2.2 Community InvolvementImplementation of this watershed plan depends on active participation and involvement of localcommunities and their citizens. Stakeholders critical to the success of this plan include localofficials, local government department heads, public agency representatives, engineers, planners,businesses, residents, citizen groups and homeowner associations. Community involvementactivities undertaken in preparation of the original version of this watershed plan include:• Input from local governments• Participation of local sub-watershed groups (Creek Groups)• Program specific community involvement activitiesINPUT FROM LOCAL GOVERNMENTSPolicy Advisory CommitteeThe first task involved in developing the original 1994 <strong>Watershed</strong> <strong>Management</strong> <strong>Plan</strong> was theformation of a Policy Advisory Committee, with members representing each of the communities inthe project area. In January 1993, an initial meeting of this group was convened to discuss issuesrelated to nonpoint source pollution in the planning area and individual community concerns.Following this introductory meeting, goals and objectives for controlling water quality weredeveloped and submitted to committee members for review and approval. Since that time theCommittee has continued to meet on a regular basis to assist in watershed planning activitiesthroughout the Middle <strong>Huron</strong> basin. Currently, the Middle <strong>Huron</strong> Initiative coordinates thisCommittee.Project staff has also met with representatives from each municipality independently, so thatindividual concerns and priorities could be addressed more effectively. These meetings were alsoconducted to ensure that the recommendations made within this plan are realistic and desirablefor each community within the project area. During these sessions, information about nonpointsource pollution and effective BMPs was disseminated. Local government representativesprovided information about the policies and practices currently in place within each municipality,Ann Arbor-Ypsilanti Metropolitan Area 4-5<strong>Watershed</strong> <strong>Management</strong> <strong>Plan</strong>
local opportunities and/or limitations for improving water quality, and the feasibility of adoptingnew BMPs.Finally, a draft <strong>Watershed</strong> <strong>Plan</strong> was submitted for comment to key staff and officials in all localcommunities, as well as to County and State agencies, private sector representatives and citizensthat had participated in the planning process. Subsequent to this review, the Washtenaw CountyDrain Commissioner presented the plan to each community within the project area to informcommunities about the <strong>Watershed</strong> <strong>Plan</strong> and gain support for implementation of itsrecommendations. Each community, in turn, formally adopted the plan. The recommendationscontained in this <strong>Watershed</strong> <strong>Plan</strong> update were the result of formal and informal meetings withcommunity officials and staff since adoption of the initial plan in 1994. This plan update will againbe presented to these communities for their collective implementation of the objectives andrecommendations.Technical Advisory CommitteesSeveral Technical Advisory Committees were established to provide input to individualcomponents of this plan. A Committee was established to assist in revising the DrainCommissioner's rules governing the design of stormwater management systems in newdevelopments. Members included staff from local planning, engineering, building inspection andutilities departments. Private engineering and planning consultants were also represented, aswell as the <strong>Huron</strong> <strong>River</strong> <strong>Watershed</strong> <strong>Council</strong>, the County Soil Conservation District and the MDNR.Committee members were provided with working drafts of the Drain Commissioner's rules(including explanations about how revisions work to improve water quality and quantity control)and asked to provide feedback on their practicality for implementation within Washtenaw County.Revised rules were adopted in 1994. Public involvement and review also guided the March 2000update.A Technical Advisory Committee was established in 1998 to oversee development of the MallettsCreek Restoration <strong>Plan</strong>. The Committee included representatives from the City of Ann ArborDepartments of <strong>Plan</strong>ning, Engineering, Building, Parks and Utilities; Pittsfield TownshipDepartment of Municipal Services; the Washtenaw County Drain Commissioner and Deputy DrainCommissioner; and a representative of the Malletts Creek Association (Malletts Creek Group).The committee met on a monthly basis to provide input and assistance in data collection,modeling, public involvement, final recommendations, timeframe and costs. While some of therecommendations are specific to Malletts, many, especially those related to ordinance revisionsand public education are or will be implemented community wide.Similar committees have been established for individual project components of this plan including:Land Use Decision Makers, Middle <strong>Huron</strong> Initiative and the Impervious Surface Reduction Study,and development of Salem Township’s model stormwater ordinance. Their feedback provided thebasis for numerous recommendations of this plan update.INPUT OF LOCAL SUB-WATERSHED GROUPS (CREEK GROUPS)Creek groups have contributed a unique community involvement component to the developmentof this <strong>Watershed</strong> <strong>Plan</strong> update. The Malletts Creek, Allens Creek, Millers Creek and Ford Lakegroups have completed separate management plans on their own to guide and prioritize theirAnn Arbor-Ypsilanti Metropolitan Area 4-6<strong>Watershed</strong> <strong>Management</strong> <strong>Plan</strong>
activities; the Fleming Creek Group is in the process of doing the same. These managementplans establish goals and objectives, desired uses, impairments to water resources andrecommendations as viewed by the citizen-stakeholders who have written them. The CreekGroups secured input and review from local governments and agencies in the planning area. TheMalletts Creek Group <strong>Management</strong> <strong>Plan</strong> has been adopted by the Ann Arbor City <strong>Council</strong> andPittsfield Township Board; Ypsilanti City <strong>Council</strong> and the Superior Township Board have adoptedThe Ford Lake <strong>Management</strong> <strong>Plan</strong>. The Millers Creek <strong>Watershed</strong> Improvement <strong>Plan</strong> wasapproved by the State of Michigan and is included as an example of good watershed planning bythe U.S. EPA.This document, the <strong>Watershed</strong> <strong>Plan</strong> for the <strong>Huron</strong> <strong>River</strong> in the Ann Arbor - Ypsilanti MetropolitanArea, incorporates these components not simply as feedback for the update, but as a basicframework for updating the plan. Recommendations made in this document represent acollaboration effort between the <strong>Huron</strong> <strong>River</strong> <strong>Watershed</strong> <strong>Council</strong>, the Office of the WashtenawCounty Drain Commissioner, the individual creek groups and the communities within which theyoperate.Staff from the <strong>Huron</strong> <strong>River</strong> <strong>Watershed</strong> <strong>Council</strong> and the Washtenaw County Drain Office have met,and will continue to meet with creek groups, throughout the process of developing andimplementing watershed plans. Support of these groups will continue to foster community buy-infor <strong>Watershed</strong> <strong>Plan</strong> implementation and creek restoration activities. Representatives of the <strong>Huron</strong><strong>River</strong> <strong>Watershed</strong> <strong>Council</strong> and the Drain Office will remain involved in these groups to assist ingroup development, management planning, grant proposals, policy and technical assistance, andspecial event coordination. In addition, creek group representatives will continue to advise theDrain Office and the <strong>Huron</strong> <strong>River</strong> <strong>Watershed</strong> <strong>Council</strong> in program development as they have for theMalletts Creek Restoration Project, the <strong>Huron</strong> <strong>River</strong> <strong>Watershed</strong> <strong>Council</strong>’s Adopt-A-Streamprogram and others.PROGRAM SPECIFIC COMMUNITY INVOLVEMENT ACTIVITIESSeveral programs currently under the coordination of the <strong>Huron</strong> <strong>River</strong> <strong>Watershed</strong> <strong>Council</strong> and theDrain Commissioner’s Office are the result of recommendations made in the 1994 <strong>Watershed</strong><strong>Plan</strong>: Community Partners for Clean Streams, Information and Education Campaign and the GISInitiative. Other programs have continued or expanded as recommended by that 1994 <strong>Plan</strong>:Adopt-A-Stream, and Land Use Decision Makers.It is important to recognize the instrumental role of these programs in defining the objectives forthis <strong>Watershed</strong> <strong>Plan</strong> update and in developing specific recommendations for the future. Ofparticular note is the insight gained through two-way dialogue with stakeholders in a variety ofpublic meetings, focus groups, steering committees, workshops and stewardship activities.Additionally, these programs have provided venues for disseminating information about waterquality issues and effective methods for stormwater management and mitigation of nonpointsource pollution. Significant contributions of these individual programs include:Community Partners for Clean Streams (CPCS)Community Partners for Clean Streams (CPCS) has enlisted over 150 non-residentiallandowners, most of whom are within the project area, to incorporate additional best managementpractices into their day-to-day activities. Practices include maintenance of stormwater structures,Ann Arbor-Ypsilanti Metropolitan Area 4-7<strong>Watershed</strong> <strong>Management</strong> <strong>Plan</strong>
equipment and vehicle maintenance, building and pavement maintenance, landscapemaintenance, waste management, and site construction and design.This program has been enlarged to broaden its availability within the project area. Closecoordination with other programs such as Malletts Creek Restoration should be fostered tofacilitate successful implementation of both programs and make the most effective use ofavailable resources. Creek groups can become involved by encouraging increased participationin the program.Information and Education CampaignThe <strong>Huron</strong> <strong>River</strong> <strong>Watershed</strong> <strong>Council</strong>’s Information and Education campaign has brought themessage of water resource stewardship to individual households. Informational tip cards havebeen mailed to residents within Salem Township, the City of Ann Arbor and the City of Ypsilanti.The tip cards provide residents with the proper knowledge base to incorporate creek protectioninto everyday activities. Tip card topics include lawn fertilization, water conservation, septicsystem maintenance, hazardous material disposal and storm water runoff. Media outlets such asthe Ann Arbor News and local radio have been used to convey and reemphasize these samemessages. The program has shown success in changing behavior; In the Spring of 1999, a soiltesting advertisement resulted in over 200 lawn soil samples being sent to Michigan StateUniversity for phosphorus testing. This is about a hundred-fold increase in testing over previousyears.Strategic information and education must continue to achieve permanent, long-term changes inpeoples’ behavior. (The continuing education that has fostered solid waste recycling is a goodexample of what it takes to secure widespread public understanding and buy-in.) The existingcoordination between this program and the City of Ann Arbor’s Phase I Stormwater Permiteducation should be fostered. Additional coordination should be sought as Phase II regulationsare implemented in planning area communities.Adopt-a-StreamThe program has proved to be a powerful tool in raising public awareness and appreciation oflocal water resources in the project area. Through experience gained while sampling for lifewithin the creeks, mapping waterways and surveying habitat, residents have become aware of thethreats and impairments to water resources. In many cases, participants have become furtherinvolved in stewardship activities: founding creek groups, submitting input to local planningdecisions, running for public office and participating in creek cleanups. Input from creek groupshas been particularly instrumental in the development of this <strong>Watershed</strong> <strong>Plan</strong>.The water quality, habitat and bio-monitoring data collected by adopters has been analyzed andpublished. These Creek Reports have been disseminated to the public and to local decisionmakers to increase awareness of water quality threats and to enlist support for creekshedprotection.Land Use Decision Makers ProgramThe Land Use Decision Makers Program introduced and furthered the notion of watershedprotection to public officials. Key considerations in watershed protection including imperviouscover, first flush detention, bank-full treatment, native landscaping and riparian corridorconservation, are now commonly discussed as elements of master planning and site plan review.Ann Arbor-Ypsilanti Metropolitan Area 4-8<strong>Watershed</strong> <strong>Management</strong> <strong>Plan</strong>
Ordinances to protect water resources have been adopted or are under consideration in everycommunity within the planning area.The existing presentation available to decision makers has been updated. As new programs andstormwater and site design BMPs evolve, they can be included into the presentation to provide acomprehensive picture of watershed stewardship activities within the planning area.Malletts Creek RestorationThe Malletts Creek Restoration <strong>Plan</strong> is a regional model for watershed restoration. A TechnicalAdvisory Committee made up of engineers, planners, public officials and citizen activists guidedthe Restoration <strong>Plan</strong>. Four public meetings were held in conjunction with development of theRestoration <strong>Plan</strong> to incorporate public input into the overall strategy of restoration. Focus groupswere convened to involve businesses, homeowners, and other potential stakeholders into theearly stages of plan development. Additional opportunities for public involvement will be availableas implementation of specific restoration projects begin.Geographic Information ProjectWashtenaw County and the <strong>Huron</strong> <strong>River</strong> <strong>Watershed</strong> <strong>Council</strong> are to develop a comprehensiveGeographic Information Systems (GIS) database to provide local decision makers and citizenactivists with a single comprehensive source of digital land information: land use, natural features,demographics, etc. A steering committee made up of individual stakeholders will be convened tosecure community input and help guide implementation of this project.4.2.3 <strong>Watershed</strong> <strong>Plan</strong> RevisionsThe original version of this watershed plan was revised once before in 2000, roughly six yearsafter initial publication. This current update follows seven years later. It is the intent of thepartners in the watershed that this plan should be revised, on average, every five years. Severalof the collaborative groups previously mentioned in this plan will continue to meet on a regularbasis to ensure that the plan is being implemented on a watershed-wide basis. Many partnershave a vested interest in assuring that the plan is implemented. In addition, updates regardingwatershed plan implementation and activities related to it and subwatershed plans will be updatedon the WCDC’s website.Applying the concept of adaptive management to the revision process is essential for successfulimplementation of the plan. Evaluation of a specific management alternative (using the methodsdiscussed in the next section) may suggest a change is needed to affect the desired result, or ashift in focus from one management alternative to another may be needed. The iterative nature ofwatershed planning, implementation, and revision is shown below in Figure 4.3.Ann Arbor-Ypsilanti Metropolitan Area 4-9<strong>Watershed</strong> <strong>Management</strong> <strong>Plan</strong>
Figure 4.3. Typical Steps in a <strong>Watershed</strong> <strong>Management</strong> Cycle 51. Conduct intial outreach and organize basin andwatershed teams and committees2. Collect relevant basin information3. Analyze and evaluate informationPublicParticipation4. Prioritize concerns and issues5. Perform detailed assessments of priority issues6. Develop management strategiesRepeat Cycle7. Prepare/update draft watershed plan8. Finalize/distribute watershed plan9. Implement watershed plan4.3 EVALUATION METHODS FOR MEASURING SUCCESSHow can we measure whether the management alternatives listed in the Action <strong>Plan</strong> have beensuccessful at reducing pollutants? That is to say, have changes in behavior occurred amongtarget audiences, how many management practices have been implemented, or havedocumented improvements in water quality occurred? There are a number of different ways tomeasure progress toward meeting the goals for the Middle <strong>Huron</strong> <strong>Watershed</strong>. Objective markersor milestones will be used to track the progress and effectiveness of the management practices inreducing pollutants to the maximum extent possible (see Table 4.2). Evaluating the managementpractices that are implemented helps establish a baseline against which future progress atreducing pollutants can be measured. The U.S. EPA identifies the following general categories formeasuring progress:1. Tracking implementation over time. Where a BMP is continually implemented over thepermit term, a measurable goal can be developed to track how often, or where, this BMPis implemented.2. Measuring progress in implementing the BMP. Some BMPs are developed over time,and a measurable goal can be used to track this progress until BMP implementation iscompleted.Ann Arbor-Ypsilanti Metropolitan Area 4-10<strong>Watershed</strong> <strong>Management</strong> <strong>Plan</strong>
3. Tracking total numbers of BMPs implemented. Measurable goals also can be used totrack BMP implementation numerically, e.g., the number of wet detention basins in placeor the number of people changing their behavior due to the receipt of educationalmaterials.4. Tracking program/BMP effectiveness. Measurable goals can be developed to evaluateBMP effectiveness, for example, by evaluating a structural BMP's effectiveness atreducing pollutant loadings, or evaluating a public education campaign's effectiveness atreaching and informing the target audience to determine whether it reduces pollutants tothe MEP. A measurable goal can also be a BMP design objective or a performancestandard.5. Tracking environmental improvement. The ultimate goal of the NPDES storm waterprogram is environmental improvement, which can be a measurable goal. Achievement ofenvironmental improvement can be assessed and documented by ascertaining whetherstate water quality standards are being met for the receiving water body or by trackingtrends or improvements in water quality (chemical, physical, and biological) and otherindicators, such as the hydrologic or habitat condition of the water body or watershed.Although achievement of water quality standards is the goal of plan implementation, the SteeringCommittee members need to use other means to ascertain what effects individual and collectiveBMPs have on water quality and associated indicators. In-stream monitoring, such as physical,chemical, and biological monitoring, is ideal because it allows direct measurement ofenvironmental improvements resulting from management efforts. Targeted monitoring to evaluateBMP-specific effectiveness is another option, whereas ambient monitoring can be used todetermine overall program effectiveness. Alternatives to monitoring include using programmatic,social, physical, and hydrological indicators. Finally, environmental indicators can be used toquantify the effectiveness of BMPs.Environmental indicators are relatively easy-to-measure surrogates that can be used todemonstrate the actual health of the environment based on the implementation of variousprograms or individual program elements. Some indicators are more useful than others inproviding assessments of individual program areas or insight into overall program success. Usefulindicators are often indirect or surrogate measurements where the presence of the indicatorpoints to likelihood that the activity was successful. Indicators can be a cost-effective method ofassessing the effectiveness of a program because direct measurements sometimes can be toocostly or time-consuming to be practical. A well-known example is the use of fecal coliformbacteria as an indicator of the presence of human pathogens in drinking water. While E. coli isnow the preferred indicator of bacterial contamination, fecal coliform has been successfully usedfor more than a century and is still in widespread use for the protection of public health fromwaterborne, disease-causing organisms.Table 4.2 presents environmental indicators that have been developed specifically for assessingstormwater programs. 6 Water quality indicators 1 through 16—physical, hydrological, andbiological indicators—can be integrated into an overall assessment of the program and used as abasis for the long term evaluation of program success. Indicators 17 through 26 correspond moreclosely to the administrative and programmatic indicators and practice-specific indicators.Ann Arbor-Ypsilanti Metropolitan Area 4-11<strong>Watershed</strong> <strong>Management</strong> <strong>Plan</strong>
Table 4.2. Environmental Indicators for Assessing Stormwater ProgramsCategory # Indicator NameWater Quality IndicatorsThis group of indicators measuresspecific water quality or chemistryparameters.1 Water quality pollutant constituent monitoring2 Toxicity testing3 Loadings4 Exceedence frequencies of water quality standards5 Sediment contamination6 Human health criteriaPhysical and Hydrological IndicatorsThis group of indicators measureschanges to or impacts on the physicalenvironment.7 Stream widening/downcutting8 Physical habitat monitoring9 Impacted dry weather flows10 Increased flooding frequency11 Stream temperature monitoringBiological IndicatorsThis group of indicators uses biologicalcommunities to measure changes to orimpacts on biological parameters.12 Fish assemblage13 Macroinvertebrate assemblage14 Single species indicator15 Composite indicator16 Other biological indicatorsSocial IndicatorsThis group of indicators uses responsesto surveys, questionnaires, and the liketo assess various parameters.Programmatic IndicatorsThis group of indicators quantifiesvarious non-aquatic parameters formeasuring program activities.Site IndicatorsThis group of indicators assessesspecific conditions at the site level.17 Public attitude surveys18 Industrial/commercial pollution prevention19 Public involvement and monitoring20 User perception21 Number of illicit connections identified/corrected22 Number of BMPs installed, inspected and maintained23 Permitting and compliance24 Growth and development25 BMP performance monitoring26 Industrial site compliance monitoringAnn Arbor-Ypsilanti Metropolitan Area 4-12<strong>Watershed</strong> <strong>Management</strong> <strong>Plan</strong>
Measurement and evaluation are important parts of planning because they can indicate whetheror not efforts are successful, and they also provide a feedback loop for improving projectimplementation as new information is gathered. If the watershed partners are able to showresults, then the plan likely will gain more support from the partnering communities and agencies,as well as local decision makers, and increase the likelihood of project sustainability and success.Monitoring and measuring progress in the watershed necessarily will be conducted at the locallevel by individual agencies and communities, as well as at the watershed level, in order to assessthe ecological affects of the collective entity actions on the health of the <strong>Huron</strong> <strong>River</strong> and itstributaries in the Middle <strong>Huron</strong> <strong>Watershed</strong>.Monitoring and measuring progress in the watershed will be two-tiered. First, individual agenciesand communities will monitor certain projects and programs on the agency and community levelsto establish effectiveness. For example, a community-based lawn fertilizer education workshopwill be assessed and evaluated by that community. Also, with the implementation of a communityproject such as the retrofitting of detention ponds, the individual community responsible for theimplementation of that task may monitor water quality/quantity parameters before and after theretrofit in order to measure the improvements. Secondly, there will be a need to monitor progressand effectiveness on a regional – subwatershed or watershed – level in order to assess theecological affects of the collective community and agency actions on the health of the river and itstributaries.The watershed partners recognize the importance of a long-term water quality, quantity andbiological monitoring programs to determine where to focus resources as they progress towardmeeting collective goals. These physical parameters will reflect improvements on a regional scale.The monitoring program should be established on a watershed scale since this approach is themost cost effective and consistent if sampling is done by one entity for an entire region.4.3.1 Qualitative Evaluation TechniquesAs seen in the Middle <strong>Huron</strong> Action <strong>Plan</strong>, and the subwatershed plans in the appendices, thereare and will be a range programs and projects implemented—ranging from wet detention ponds topublic education—to improve water quality, water quantity and habitat in the Middle <strong>Huron</strong><strong>Watershed</strong>. Finding creative ways to measure the effectiveness of each of these individualprograms is a challenge. Many of the evaluation techniques utilized for individual projects arelisted in the Action <strong>Plan</strong> or subwatershed plans themselves.A set of qualitative evaluation criteria can be used to determine whether pollutant loadingreductions are being achieved over time and whether substantial progress is being made towardattaining water quality standards in the watershed. Conversely, the criteria can be used fordetermining whether the <strong>Plan</strong> needs to be revised at a future time in order to meet standards. Asummary (Table 4.3) of the methods provides an indication of how these programs might bemeasured and monitored to evaluate success in both the short and the long term. Some of theseevaluations may be implemented on a watershed basis, such as a public awareness survey toevaluate public education efforts, but most of these activities will be measured at the local level.By evaluating the effectiveness of these programs, communities and agencies will be betterinformed about public response and success of the programs, how to improve the programs, andwhich programs to continue. Although many of these methods of measuring progress are notdirect measures of environmental impact, it is fair to assume that successful implementation ofAnn Arbor-Ypsilanti Metropolitan Area 4-13<strong>Watershed</strong> <strong>Management</strong> <strong>Plan</strong>
these actions and programs, collectively and over time, will have a positive impact on in-streamconditions.Ann Arbor-Ypsilanti Metropolitan Area 4-14<strong>Watershed</strong> <strong>Management</strong> <strong>Plan</strong>
Table 4.3. Summary of qualitative evaluation techniques for the Middle <strong>Huron</strong> <strong>Watershed</strong>EvaluationProgram/Project What is Measured Pros and Cons ImplementationMethodPublic SurveysWrittenEvaluationsStream SurveysPublic educationor involvementprogram/projectPublic meeting orgroup educationor involvementprojectIdentify riparianand aquaticimprovements.Awareness;Knowledge;Behaviors; Attitudes;ConcernsAwareness;KnowledgeHabitat; Flow;Erosion; Recreationpotential; ImpactsPro: Moderatecost.Con: Lowresponse rate.Pro: Goodresponse rate.Low cost.Pro: Current andfirst-handinformation.Con: Timeconsuming.Some costinvolved.Pre- and post- surveysrecommended. By mail,telephone or groupsetting. Repetition onregular basis can showtrends. Appropriate forlocal or watershed basis.Post-event participantscomplete briefevaluations that ask whatwas learned, what wasmissing, what could bedone better. Evaluationscompleted on-site.Identify parameters toevaluate. Use form, suchas Stream CrossingInventory, to recordobservations. Summarizefindings to identify sitesneeding observation.VisualDocumentationStructural andvegetative BMPinstallations,retrofitsAesthetics. Pre- andpost- conditions.Pro: Easy toimplement. Lowcost.Con: Good, butlimited, form ofcommunication.Provides visual evidence.Photographs can be usedin public communicationmaterials.Phone call/ComplaintrecordsEducation efforts,advertising ofcontact numberfor complaints/concernsNumber and types ofconcerns of public.Location of problemareas.Con: Subjectiveinformation fromlimited number ofpeople.Answer phone, letter,emails and track natureof calls and concerns.ParticipationTrackingFocus GroupsPublicinvolvement andeducation projectsInformation andeducationprogramsAdapted from: Lower One SWAG, 2001Number of peopleparticipating.Geographicdistribution ofparticipants. Amountof waste collected,e.g. hazardous wastecollectionAwareness;Knowledge;Perceptions;BehaviorsPro: Low cost.Easy to track andunderstand.Pro: Instantidentification ofmotivators andbarriers tobehavior change.Con: Medium tohigh cost to dowell.Track participation bycounting people,materials collected andhaving sign-in/evaluationsheets.Select random sample ofpopulation asparticipants. 6-8 peopleper group. <strong>Plan</strong>questions, facilitate.Record and transcribediscussion.Ann Arbor-Ypsilanti Metropolitan Area 4-15<strong>Watershed</strong> <strong>Management</strong> <strong>Plan</strong>
4.3.2 Quantitative Evaluation TechniquesIn addition to measuring the effectiveness of certain specific programs and projects withincommunities or agencies, it is beneficial to monitor the long-term progress and effectiveness ofthe cumulative watershed efforts in terms of water quality, water quantity and biological health.<strong>Watershed</strong>-wide long-term monitoring will address many objectives established for the Middle<strong>Huron</strong> <strong>Watershed</strong>. A monitoring program at the watershed level will require a regionalperspective and county or state support. Wet and dry weather water quality, stream flow,biological and other monitoring will afford communities and agencies better decision makingabilities as implementation of this plan continues. Suggestions for the monitoring program arepresented below. Details for the monitoring program will be decided and approved on anongoing basis by the various advisory bodies in the watershed.Parameters and Establishing Targets for <strong>River</strong> MonitoringBeyond the data collected for the original <strong>Watershed</strong> <strong>Management</strong> <strong>Plan</strong> and its updates, it wasrecognized that there is a need to augment the type of parameters monitored, the number oflocations in the watershed, and the frequency of wet weather monitoring. A holistic monitoringprogram has been established to help communities and agencies to identify more accuratelywater quality and water quantity impairments and their sources, as well as how theseimpairments are impacting the biological communities that serve as indicators of improvements.ParametersThe long-term monitoring program has been established so that progress can be measuredover time. The program includes the following components:• Stream flow monitoring to determine baseflows and track preservation and restorationactivities upstream. This is ongoing at eight tributary sites and one river site in thewatershed. Additionally, physical and hydrological indicators such as streamwidening/downcutting, physical habitat, stream temperature, and a variety ofgeomorphology measures are collected at HRWC Adopt-a-Stream sites throughout thewaterhshed.• Wet and dry weather water quality data are being collected in the watershed to identifyspecific pollution source areas within the watershed, and measure impacts ofpreservation and restoration activities upstream. Included as water quality indicators are:water quality pollutant monitoring; and loadings. However, due to limited funding, onlylimited collection of this data has been performed. More regular collection of theseparameters along with exceedence frequencies of water quality standards, sedimentcontamination, and human health criteria need to be added to complete the program.• Biological monitoring of macroinvertebrates is conducted regularly at sites throughoutthe watershed. Additional monitoring of fish and mussels would improve the scope ofbiological knowledge. These indicators are used as measures of the potential quality andhealth of the stream ecosystem. Include as biological indicators: fish assemblage;macroinvertebrate assemblage; single species indicators; composite indicators; andother biological indicators.Ann Arbor-Ypsilanti Metropolitan Area 4-16<strong>Watershed</strong> <strong>Management</strong> <strong>Plan</strong>
• Identification of major riparian corridors and other natural areas is being conducted viaHRWC’s Bioreserve Program in order to plan for recreational opportunities, restorationand linkages.• There is a need to review and revise currently established benchmarks and dates basedon new data.• The monitoring within the watershed maximizes the use of volunteers to encourageinvolvement and stewardship.Based on the goals of the watershed, the monitoring program currently includes measurementof Dissolved Oxygen (DO), Bacteria (E. coli), Phosphorus (P), total suspended solids (TSS),Nitrate-Nitrite, stream flow, conductivity, fisheries (limited), aquatic macroinvertebrates,temperature, physical habitat, and channel structure. However, many of these measures arecollected on a limited basis, and subject to insecure funding. Establishing a sustainable plan formonitoring is a goal for this watershed.Establishing TargetsMeasuring parameters to evaluate progress toward a goal requires the establishment of targetsagainst which observed measurements are compared. These targets are not necessarily goalsthemselves, because some of them may not be obtainable realistically. However, the targets dodefine either Water Quality Standards, as set forth by the State of Michigan, or scientificallysupportednumbers that suggest measurements for achieving water quality, water quantity andbiological parameters to support state designated uses such as partial or total body contact, andfisheries and wildlife. Using these scientifically-based numbers as targets for success will assistthe advisory bodies in deciding how to improve programs to reach both restoration andpreservation goals and know when these goals have been achieved. These targets aredescribed below.Dissolved Oxygen: The Michigan Department of Environmental Quality (MDEQ) hasestablished state standards for Dissolved Oxygen (DO). The requirement is no less than 5.0mg/l as a daily average for all warm water fisheries. The Administrative Rules state:. . . for waters of the state designated for use for warmwater fish and otheraquatic life, except for inland lakes as prescribed in R 323.1065, the dissolvedoxygen shall not be lowered below a minimum of 4 milligrams per liter, or below 5milligrams per liter as a daily average, at the design flow during the warmweather season in accordance with R 323.1090(3) and (4). At the design flowsduring other seasonal periods as provided in R 323.1090(4), a minimum of 5milligrams per liter shall be maintained. At flows greater than the design flows,dissolved oxygen shall be higher than the respective minimum values specified inthis subdivision.(Michigan State Legislature. 1999)Bacteria: State standards are established for Bacteria (E. coli) by the MDEQ. For thedesignated use of total body contact (swimming), the state requires measurements of no morethan 130 E. coli per 100 milliliters as a 30-day geometric mean during 5 or more samplingAnn Arbor-Ypsilanti Metropolitan Area 4-17<strong>Watershed</strong> <strong>Management</strong> <strong>Plan</strong>
events representatively spread over a 30-day period. For partial body contact (wading, fishing,and canoeing) the state requires measurements of no more than 1000 E. coli per 100 millilitersbased on the geometric mean of 3 or more samples, taken during the same sampling event.These uses and standards will be appropriate for and applied to the creek and those tributarieswith a base flow of at least 2 cubic feet per second.Phosphorus: State water quality standards for phosphorus require that “phosphorus which is ormay readily become available as a plant nutrient shall be controlled from point sourcedischarges to achieve 1 mg/l of total phosphorus as a maximum monthly average effluentconcentration unless other limits, either higher or lower, are deemed necessary andappropriate.” In the case of the Middle <strong>Huron</strong> <strong>Watershed</strong>, the Ford and Belleville Lakes TMDLdefines effluent standards for point sources (see Section 2.5.1) and establishes anenvironmental standard of 50 µg/L at Ford Lake and 30 µg/L at Belleville Lake. The State alsorequires that “nutrients shall be limited to the extent necessary to prevent stimulation of growthsof aquatic rooted, attached, suspended, and floating plants, fungi or bacteria which are or maybecome injurious to the designated uses of the waters of the state.” Monitoring frequency andnumber of sites for phosphorus and nitrogen needs to be increased to capture seasonalvariation and dry and wet weather conditions, and effectively estimate changes in loading ofthese nutrients.Total Suspended Solids/Sediment: No numerical standard has been set by the state for TotalSuspended Solids (TSS) for surface waters. However, the state requires that “the addition ofany dissolved solids shall not exceed concentrations which are or may become injurious to anydesignated use.” To protect the designated uses of fisheries and wildlife habitat, as well as thedesired recreational and aesthetic uses of the surface waters in the watershed, there arerecommended targets established on a scientific basis. From an aesthetics standpoint, it isrecommended that TSS less than 25 mg/l is “good”, TSS 25-80 mg/l is “fair” and TSS greaterthan 80 mg/l is “poor.” 7 The TSS target, therefore, will be to maintain TSS below 80 mg/l in dryweather conditions. Another measurement that can be used to determine the impacts ofsediment loading is to determine the extent of embeddedness of the substrate (how much of thestream bottom is covered with fine silts) and the bottom deposition (what percentage of thebottom is covered with soft muck, indicating deposition of fine silts). These are measurementstaken by the Surface Water Assessment Section (SWAS) protocol habitat assessmentconducted by MDEQ every five years, and by the Adopt-A-Stream program more frequently.Rating categories are from “poor” to “excellent.” The target should be to maintain SWAS“excellent” and “good” designations at sites where they currently exist, and to improve “fair” and“poor” sites to “good.” Further standards for TSS are established by TMDLs for Malletts Creekand Swift Run (see Section 2.5.1)MDEQ, USGS and U.S. EPA are currently recommending using the alternate measure ofSuspended Sediment Concentration (SSC) as a more accurate measure for open channelmonitoring. While this may be true, the Middle <strong>Huron</strong> Monitoring Program cannot make a rapidchange in measures for several reasons. First, the analytical lab at the Ann Arbor WaterTreatment <strong>Plan</strong>t does not conduct SSC analyses. This would necessitate alternative laboratoryarrangements that would add logistical difficulty and expense. Second, biota TMDLs forMalletts Creek and Swift Run use a TSS standard. SSC measures may be inconsistent withthese limits. Finally, the program has been monitoring progress toward meeting the TMDL forover five years. It is unclear if the new measure will be comparable to past data. The MiddleAnn Arbor-Ypsilanti Metropolitan Area 4-18<strong>Watershed</strong> <strong>Management</strong> <strong>Plan</strong>
<strong>Huron</strong> Partners will consider these implications and plan for a possible transition to SSC atsome point in the future.Stream Discharge: Stream flow, or discharge, for surface waters do not have a numericalstandard set by the state. Using the health of the fish and macroinvertebrate communities as theultimate indicators of stream and river health is most useful in assessing appropriate flow.Recommended flow targets for the river and its tributaries will be established once thenecessary research has been conducted that will determine the natural, pre-developmenthydrology and current hydrology. Peak flow data is needed to compare more accuratelyobserved flow to the target flow. As describe in chapter two, USGS stream gages are locatedon the <strong>Huron</strong> <strong>River</strong> between Argo and Geddes Dams and on Malletts Creek near its mouth.These provide continuous measurement of discharge. HRWC also has a set of sensor that havebeen deployed in Millers Creek and Fleming Creek, and in 2007 in Traver Creek and Swift Run.The City of Ann Arbor deployed level sensors in Allens Creek, including a specialized sensorthat can account for backflow situations. Data generated by these stations can assist inestablishing an appropriate flow targets and assessing any progress made toward such a goal,as well as contributing to loading calculations.Conductivity: Conductivity measures the amount of dissolved ions in the water column and isconsidered an indicator for the relative amount of some types of suspended material in thestream. The scientifically-established standard for conductivity in a healthy Michigan stream is800 microSiemens (μS), which should be the goal for the <strong>Huron</strong> <strong>River</strong> and its tributaries. Levelshigher than the standard may indicate the presence of suspended materials from stormwaterrunoff, failing septics, illicit connections, ground water seeps or other sources.Fisheries: Numerical or fish community standards have not been set by the state. However, theMichigan Department of Environmental Quality has developed a system to estimate the healthof the predicted fish communities through the SWAS 51 sampling protocol. This method collectsfish at various sites and is based on whether or not certain expected fish species are present,as well as other habitat parameters; fish communities are assessed as poor, fair, good, orexcellent. The state conducts this protocol every five years in the <strong>Huron</strong> <strong>River</strong> <strong>Watershed</strong>. Thetarget should be to maintain SWAS 51 scores of “excellent” and “good” at sites where theycurrently exist, and to improve “fair” and “poor” sites to “good.” The SWAS 51 protocol alsoidentifies whether or not there are sensitive species present in the <strong>Huron</strong> <strong>River</strong> and itstributaries, which would indicate a healthy ecosystem. Certain species are especially useful fordemonstrating improving conditions. These species tend to be sensitive to turbidity, prefercleaner, cooler water, and their distribution in the <strong>Huron</strong> <strong>Watershed</strong> is currently limited. Thetarget is to continue to find species currently found in self-sustaining population numbers, at aminimum. Improvements in habitat and water quality should also result in the expansion orrecruitment of additional species.Benthic Macroinvertebrates: Similar to the assessment of fish communities, the state employsthe GLEAS 51 protocol for assessing macroinvertebrate communities on a five-year cycle forthe <strong>Huron</strong> <strong>River</strong> <strong>Watershed</strong>. The HRWC Adopt-A-Stream program monitors macroinvertebratehealth and physical habitat on 30 sites in the Middle <strong>Huron</strong> <strong>Watershed</strong> using an adaptation ofthe GLEAS 51 procedure. The sites are monitored for macroinvertebrates two or three timeseach year and periodically for physical habitat health. The monitoring target formacroinvertebrate communities will be to increase MDEQ and Adopt-A-Stream monitoring sitesAnn Arbor-Ypsilanti Metropolitan Area 4-19<strong>Watershed</strong> <strong>Management</strong> <strong>Plan</strong>
to improve the existing database and attain GLEAS 51 scores of at least “fair” at sites thatcurrently are “poor,” and improve “fair” sites to “good,” while maintaining the “good” and“excellent” conditions at the remaining sites.Temperature: The state lists temperature standards only for point source discharges andmixing zones – not ambient water temperatures in surface water. However, recommendationsfor water temperature can be generated by assessing fish species’ tolerance to temperaturechange and these guidelines are found within the statute. Although some temperature datahave been collected in the Middle <strong>Huron</strong> system by the HRWC Adopt-A-Stream program and aspart of the monitoring for the Middle <strong>Huron</strong> Partnership Initiative, additional studies are neededto establish average monthly temperatures and whether increased temperatures are limitingbiota habitat.Wetlands: An annual review should be done of MDEQ wetland permit information and localrecords in order to track wetland fills, mitigations, restoration and protection to establish net lossor gain in wetlands in the watershed. The target for this parameter is to track the net acres ofwetland in the watershed to determine action for further protection or restoration activities. Inaddition, the Bioreserve Project should be completed to capture additional small, non-regulatedwetlands. Once identified, these should also be tracked as above.Details regarding responsible parties, monitoring standards, sampling sites, and frequency ofmonitoring for qualitative and quantitative evaluation techniques need to be periodicallyreviewed by the Middle <strong>Huron</strong> Partners and subwatershed groups. Results from monitoring andprogress evaluation are reported through a variety of mechanisms. The Middle <strong>Huron</strong>Partnership Initiative reports on progress toward the Ford and Belleville Lakes TMDL every twoyears, on average. The most recent version of this report is included in Appendix Q. Many ofthe communities and other responsible agencies in the Middle <strong>Huron</strong> submit annual reports aspart of Phase II stormwater compliance. HRWC produces a summary of results on the Adopt-a-Stream program once per year.4.3.3 Evaluation Monitoring for the Middle <strong>Huron</strong> <strong>Watershed</strong>Based on an evaluation of the above information, the goals and objectives of this plan, and thecauses and sources of water quality impairments in critical areas, the monitoring plan detailed inTable 4.4 has been established. Monitoring sites included in this plan are shown in Figure 4.4.This plan is contingent upon funding and participation of community partners and monitoringagencies.The monitoring plan is based around four programs administered by three organizations. First,HRWC’s Adopt-a-Stream Program collects data on benthic macroinvertebrates three times ayear, including a special collection of winter stoneflies. Adopt also does a complete streamhabitat assessment of each site every 4-5 years, which includes a number of geomorphiccharacteristics along with general habitat characteristics as with the MDEQ protocol. Adoptcollectors also sample for water conductivity at each macroinvertebrate event. Summertemperatures are also documented every 5 years. The Adopt program uses volunteers tocollect the vast majority of the data. Results from this program are included in section 2.4Ann Arbor-Ypsilanti Metropolitan Area 4-20<strong>Watershed</strong> <strong>Management</strong> <strong>Plan</strong>
The second program is MDEQ’s rotational watershed assessments. MDEQ returns to thewatershed every five years to collect benthic macroinvertebrates, habitat assessment data and,in some cases, a suite of water chemistry parameters. Site selection varies each year.HRWC also administers the Middle <strong>Huron</strong> Tributary Monitoring Program on behalf of the Middle<strong>Huron</strong> Partnership. HRWC uses volunteers and staff to collect water samples and deliver to theAnn Arbor Water Treatment <strong>Plan</strong>t for analysis. Analytes include total phosphorus, nitrates,nitrites, total suspended solids and E. coli. Volunteers also collect stream discharge data fromall ten sites to allow for the calculation of pollutant loads. Currently, data is collected once ortwice per month (depending on site) with additional storm event and high flow samples collectedopportunistically during the April to September growing season.Finally, MDEQ conducted a water quality monitoring of six lake sites in Ford and BellevilleLakes and two sites on the <strong>Huron</strong> <strong>River</strong>. Nutrients and other parameters were collected onceper month from April to September. This program was in effect through 2006 when it washalted due to funding cuts. It is anticipated that the program will restart once funding isrestored.Ann Arbor-Ypsilanti Metropolitan Area 4-21<strong>Watershed</strong> <strong>Management</strong> <strong>Plan</strong>
Table 4.4 Middle <strong>Huron</strong> <strong>River</strong> <strong>Watershed</strong> Monitoring and EvaluationMonitoring Site 1 Parameter Target Type of Analysis Protocol Frequency Test Agent<strong>Huron</strong> <strong>River</strong> Stream Habitat Assessment HRWC Protocol 3- 5 yr interval HRWC, MDEQ 3Adopt (24,26,61,62) Total Suspended Solids SM20 2540 D 5 1x/Mo Apr-Sept HRWC to AA WTP 4Middle <strong>Huron</strong> (MH01) S,N,DO,T,I, Total Phosphorus, Nitrates, Nitrites SM20 4500 1x/Mo Apr-Sept HRWC to AA WTP; MDEQMDEQ (HR1, HR2, F1, F2 B, Bio 2 Temp, DO, pH, Conductivity Horiba U10 Meter 1x/Mo Apr-Sept HRWCF3, F4, B1, B2, B3, B4) E. coli SM20 9213 D 1x/Mo Apr-Sept HRWC to AA WTPBenthic Macroinvertebrates HRWC Protocol 2-3x/year HRWC, MDEQLake Chemistry MDEQ protocols 1x/Mo Apr-Sept MDEQ 3Mill Creek Stream Habitat Assessment HRWC Protocol 3- 5 yr interval HRWC, MDEQAdopt (31,32,33,34,55, Total Suspended Solids SM20 2540 D 1-2x/Mo + Rain event HRWC to AA WTP57,79,80) S, N, DO, T, Total Phosphorus, Nitrates, Nitrites SM20 4500 1-2x/Mo + Rain event HRWC to AA WTP; MDEQMiddle <strong>Huron</strong> (MH02A, I, B, Bio Temp, DO, pH, Conductivity Horiba U10 Meter 1-2x/Mo Apr-Sept HRWCMH02B) E. coli SM20 9213 D 1-2x/Mo + Rain event HRWC to AA WTPBenthic Macroinvertebrates HRWC Protocol 2-3x/year HRWC, MDEQBoyden Creek Stream Habitat Assessment HRWC Protocol 3- 5 yr interval HRWCAdopt (2,3,4) Bio, T, I Benthic Macroinvertebrates HRWC Protocol 2-3x/year HRWCConductivity HRWC Protocol 2-3x/year HRWCAvg Max Daily Summer Temp HRWC Protocol 3 yr interval:Summer HRWCHoney Creek Stream Habitat Assessment HRWC Protocol 3- 5 yr interval HRWC, MDEQAdopt (18,19,20,22) Total Suspended Solids SM20 2540 D 1-2x/Mo + Rain event HRWC to AA WTPMiddle <strong>Huron</strong> (MH03) S, N, DO, T, Total Phosphorus, Nitrates, Nitrites SM20 4500 1-2x/Mo + Rain event HRWC to AA WTP; MDEQI, B, Bio Temp, DO, pH, Conductivity Horiba U10 Meter 1-2x/Mo Apr-Sept HRWCE. coli SM20 9213 D 1-2x/Mo + Rain event HRWC to AA WTPBenthic Macroinvertebrates HRWC Protocol 2-3x/year HRWC, MDEQAnn Arbor-Ypsilanti Metropolitan Area 4-22<strong>Watershed</strong> <strong>Management</strong> <strong>Plan</strong>
Monitoring Site Parameter Target Type of Analysis Protocol Frequency Test AgentAllens Creek Total Suspended Solids SM20 2540 D 1-2x/Mo + Rain event HRWC to AA WTPMiddle <strong>Huron</strong> (MH04) Total Phosphorus, Nitrates, Nitrites SM20 4500 1-2x/Mo + Rain event HRWC to AA WTP; MDEQS, N, DO, T, I, B Temp, DO, pH, Conductivity Horiba U10 Meter 1-2x/Mo Apr-Sept HRWCE. coli SM20 9213 D 1-2x/Mo + Rain event HRWC to AA WTPTraver Creek Stream Habitat Assessment HRWC Protocol 3- 5 yr interval HRWC, MDEQAdopt (42,43) Total Suspended Solids SM20 2540 D 1-2x/Mo + Rain event HRWC to AA WTPMiddle <strong>Huron</strong> (MH05A, S, N, DO, T, Total Phosphorus, Nitrates, Nitrites SM20 4500 1-2x/Mo + Rain event HRWC to AA WTP; MDEQMH05B) I, B, Bio Temp, DO, pH, Conductivity Horiba U10 Meter 1-2x/Mo Apr-Sept HRWCE. coli SM20 9213 D 1-2x/Mo + Rain event HRWC to AA WTPBenthic Macroinvertebrates HRWC Protocol 2-3x/year HRWC, MDEQMillers Creek Stream Habitat Assessment HRWC Protocol 3- 5 yr interval HRWC, MDEQAdopt (35,72,73,74,75, Total Suspended Solids SM20 2540 D 1-2x/Mo + Rain event HRWC to AA WTP76,77,78,86) S, N, DO, T, Total Phosphorus, Nitrates, Nitrites SM20 4500 1-2x/Mo + Rain event HRWC to AA WTP; MDEQMiddle <strong>Huron</strong> (MH08) I, B, Bio Temp, DO, pH, Conductivity Horiba U10 Meter 1-2x/Mo Apr-Sept HRWCE. coli SM20 9213 D 1-2x/Mo + Rain event HRWC to AA WTPBenthic Macroinvertebrates HRWC Protocol 2-3x/year HRWC, MDEQMalletts Creek Stream Habitat Assessment HRWC Protocol 3- 5 yr interval HRWC, MDEQAdopt (27,28,29,56) Total Suspended Solids SM20 2540 D 1-2x/Mo + Rain event HRWC to AA WTPMiddle <strong>Huron</strong> (MH07) S, N, DO, T, Total Phosphorus, Nitrates, Nitrites SM20 4500 1-2x/Mo + Rain event HRWC to AA WTP; MDEQI, B, Bio Temp, DO, pH, Conductivity Horiba U10 Meter 1-2x/Mo Apr-Sept HRWCE. coli SM20 9213 D 1-2x/Mo + Rain event HRWC to AA WTPBenthic Macroinvertebrates HRWC Protocol 2-3x/year HRWC, MDEQAnn Arbor-Ypsilanti Metropolitan Area 4-23<strong>Watershed</strong> <strong>Management</strong> <strong>Plan</strong>
Monitoring Site Parameter Target Type of Analysis Protocol Frequency Test AgentSwift Run Stream Habitat Assessment HRWC Protocol 3- 5 yr interval HRWC, MDEQAdopt (41) Total Suspended Solids SM20 2540 D 1-2x/Mo + Rain event HRWC to AA WTPMiddle <strong>Huron</strong> (MH09) S, N, DO, T, Total Phosphorus, Nitrates, Nitrites SM20 4500 1-2x/Mo + Rain event HRWC to AA WTP; MDEQI, B, Bio Temp, DO, pH, Conductivity Horiba U10 Meter 1-2x/Mo Apr-Sept HRWCE. coli SM20 9213 D 1-2x/Mo + Rain event HRWC to AA WTPBenthic Macroinvertebrates HRWC Protocol 2-3x/year HRWC, MDEQFleming Creek Stream Habitat Assessment HRWC Protocol 3- 5 yr interval HRWC, MDEQAdopt (9,11,12,13,84) Total Suspended Solids SM20 2540 D 1-2x/Mo + Rain event HRWC to AA WTPMiddle <strong>Huron</strong> (MH06) S, N, DO, T, Total Phosphorus, Nitrates, Nitrites SM20 4500 1-2x/Mo + Rain event HRWC to AA WTP; MDEQI, B, Bio Temp, DO, pH, Conductivity Horiba U10 Meter 1-2x/Mo Apr-Sept HRWCE. coli SM20 9213 D 1-2x/Mo + Rain event HRWC to AA WTPBenthic Macroinvertebrates HRWC Protocol 2-3x/year HRWC, MDEQSuperior Drain #1 Total Suspended Solids SM20 2540 D 1-2x/Mo + Rain event HRWC to AA WTPTotal Phosphorus, Nitrates, Nitrites SM20 4500 1-2x/Mo + Rain event HRWC to AA WTP; MDEQMiddle <strong>Huron</strong> (MH10) S, N, DO, T, I, B Temp, DO, pH, Conductivity Horiba U10 Meter 1-2x/Mo Apr-Sept HRWCE. coli SM20 9213 D 1-2x/Mo + Rain event HRWC to AA WTP1) Adopt = HRWC Adopt-a-Stream; Middle <strong>Huron</strong> = Middle <strong>Huron</strong> Partners tributary nutrient monitoring; MDEQ = DEQ lake monitoring2) S= Sediment; N= Nutrients; DO= Dissolved Oxygen; T= Temperature; I= Ions; B= Bacteria; Bio= Biota3) Specific sites will be included as part of MDEQ Water Bureau's rotational water quality monitoring program; Lakes program monitors water quality monthly4) HRWC staff and volunteers to collect samples and deliver to Ann Arbor Water Treatment <strong>Plan</strong>t for analysis under their direction.5) Analytical protocols follow “Standard Methods for the Examination of Water and Wastewater”, 20th edition, by the American Waterworks AssociationAnn Arbor-Ypsilanti Metropolitan Area 4-24<strong>Watershed</strong> <strong>Management</strong> <strong>Plan</strong>
4.4 EVALUATION OF PREVIOUS PLANS4.4.1 <strong>Watershed</strong> <strong>Management</strong> Activities 1994-2000When the original <strong>Watershed</strong> <strong>Plan</strong> for the <strong>Huron</strong> <strong>River</strong> in the Ann Arbor-Ypsilanti MetropolitanArea was completed in 1994, several watershed management activities were underway. Ofthose, several have been completed, while others have continued and expanded. The updatein 2000 also contained activities that have been since completed. Also, important new initiativeshave been undertaken since the update. This section provides an update of completed,ongoing and recently undertaken major watershed activities within the project area.ACTIVITIES COMPLETED1. Public Education and InvolvementInformation and Literature – During the 1994 <strong>Watershed</strong> <strong>Plan</strong> Development Process, publiceducation materials were developed and disseminated to promote involvement and support forriver protection. These included a display used at public gatherings to engage the public oneon-one,and a citizens’ guide to nonpoint source pollution. The citizen’s guide, still available toresidents, provided pollution prevention and source control information.Presentations -- A series of presentations were made to local community boards and planningcommissions in the Fall of 1994 to inform communities about the Ann Arbor-Ypsilanti <strong>Watershed</strong><strong>Plan</strong> and gain support for implementation of its recommendations. All communities in theplanning area passed resolutions supporting the plan, and committed to its implementation.Ann Arbor-Ypsilanti Metropolitan Area 4-25<strong>Watershed</strong> <strong>Management</strong> <strong>Plan</strong>
!.2262MH011Monitoring Sites in the Middle <strong>Huron</strong>#7#77980WEBSTER 2Boyden Creek#726#7#7 4#7 3MH0320#7 !.NORTHFIELDTraver Creek43#7SALEMFleming Creek#7 1384#733!.MH02BSCIO#7#718Honey CreekLODI19DEQ-HR172"/ #773869#7#7MH0442 61Millers Creek!. #7 !. #7 35#7 #7 75 12MH05B 76 #7#7 #7 74 #7 SUPERIORAllens Creek !. #7 78 MH06ANN ARBORMH08B11!.MH0727#7<strong>Huron</strong> <strong>River</strong>#7 !. 41MH10#7 !. MH09 !.2956 #7YPSILANTI#7#7Malletts Creek28 Swift RunDEQ-HR2#7"/ DEQ-F1"/ Ford LakePITTSFIELD"/DEQ-F2"/DEQ-F3DEQ-B1DEQ-F4"/Bellevile LakeVAN"/ "/ BURENDEQ-B2"/DEQ-B3¹"/DEQ-B40 1.5 3 6 MilesBELLEVILLE87#788#714Monitoring SitesAgency!. HRWC"/ MDEQ#7 Adopt-a-Stream sitesSurface waterMunicipalitiesCreekshedsSources: HRWC, Adopt-a-Stream, MHMP;DEQ Monitoring Reports.Figure 4.4
Presentations were also made to local community groups and university classes. A majoreducational presentation was also made to the local engineering and development designcommunity, to appraise them of the impacts of stormwater runoff to the health of localwaterways.2. Water Quality and Quantity MonitoringThe City of Ann Arbor conducted stormwater testing of runoff concentrations during preparationof its stormwater permit application (1994-95). Results of this sampling and the National UrbanRunoff Pollution Study were used to model “Wet year”, “Dry Year”, and “Normal Year” nonpointsource pollutant delivery. Concurrent with development of the 1994 <strong>Watershed</strong> <strong>Plan</strong>, a flow andwater quality study was completed in the Honey Creek basin. Results were documented in theHoney Creek Stormwater Modeling Project. 83. Land Use Decision Maker ProgramThis educational program provided public officials and decision makers with tools to reduce theimpact of development on water quality, including model ordinances, literature, and low-impactdesign guidelines. A focus group of planning commissioners guided program design. Roadagencies were brought into the process; a roads/watershed roundtable was created as a forumto discuss potential measures for mitigating road impacts (imperviousness, pollutant wash-off)on waterways. Among the final tasks of the program was a major conference on use of nativelandscapes as a stormwater management tool. The program included slide presentations,education materials, and model ordinances designed to make water quality protection afundamental part of land use planning and site design review processes.CONTINUING ACTIVITIES1. Review of Best <strong>Management</strong> PracticesResearch and monitoring data relating to BMPs for water resource protection are continuallybeing reviewed via professional journals and conference proceedings. Additionally, thoroughBMP reviews were completed as work tasks for special projects including the Malletts CreekRestoration Project, the Impervious Surface Reduction Study, and the Drain Rules revision ofFebruary 2000. These projects are discussed in more detail in the remainder of this section.2. Adopt-A-StreamBio-monitoring activities of <strong>Huron</strong> <strong>River</strong> <strong>Watershed</strong> <strong>Council</strong>’s Adopt-A-Stream program havecontinued on existing sites and expanded to include additional sites both within the Ann Arbor-Ypsilanti area and throughout the <strong>Huron</strong> <strong>River</strong> <strong>Watershed</strong>. In total, 52 sites are beingmonitored, providing an invaluable experiential education to more than 500 residents of thewatershed. The complete data collected over a period of 14 years have been compiled andanalyzed to identify correlations between land use and water quality.The Adopt-A-Stream program publishes regular reports on its events and trends and therelevant data for the Middle <strong>Huron</strong> is discussed in chapter two. The Adopt-A-Stream programhas written informational reports, or Creek Reports, for several creeksheds and contributes toannual reports for the Middle <strong>Huron</strong> Partners. The reports summarize current conditions,sources of water quality impairments, opportunities for water resource protection, and biomonitoringresults to a general audience. Over thousands of reports have been disseminated toAnn Arbor-Ypsilanti Metropolitan Area 4-27<strong>Watershed</strong> <strong>Management</strong> <strong>Plan</strong>
the general public, township/city officials and schools. Presentations have been given to localland use decision makers.3. Water Quality and Quantity MonitoringWet and dry weather samples have been collected from Malletts Creek. The MDEQ tested in1994, and the Malletts Creek Restoration Project tested in 1999. Measurements included TP,TSS, BOD, dissolved P, Temp, DO, pH and conductivity. A comprehensive hydraulic and waterquality model was also created for Malletts and shared with the communities involved.Modeling and sampling results were included in the Malletts Creek Restoration <strong>Plan</strong> completedin 2000. An instream flow gauge was installed at the mouth of Malletts Creek in the Spring of1999. The gauge monitors flow at 15-minute intervals and will be maintained indefinitely by theUSGS for the City of Ann Arbor. Another gauging station exists in the main stem of the <strong>Huron</strong><strong>River</strong> at Wall Street, Ann Arbor.The MDEQ is conducting ongoing phosphorus and other testing in Ford and Belleville Lakesand two upstream sites that began in 1995. As part of the Middle <strong>Huron</strong> Initiative, HRWC hasbeen monitoring 10 stations monthly from April through September for flow, phosphorus,suspended sediments, and additional background measures. E. coli was added to the list ofparameters in 2006. Additional water quality data may be collected at the <strong>Huron</strong> <strong>River</strong> (WallStreet) and Malletts gauging station locations over the next several years by the USGS. Thesefacilities will allow future monitoring of water quality trends.4. Revision of the Rules of the Washtenaw County Drain CommissionerRevised Rules of the Washtenaw County Drain Commissioner were published in draft in 1997and, after extensive ongoing review, finalized in March 2000. Public participation helped guidethese processes. The latest rules reflect the experience gained over five years ofimplementation of a major 1994 revision. The requirements for treatment of first flush, bank-fulland 100-year storms remain in effect. Revisions include increased emphasis on practicalaspects of stormwater system design and maintenance, as well as criteria for ensuring properconstruction and system performance. Most communities in the planning area, as well asLivingston and Wayne Counties have either adopted these rules or are using very similarstandards. These standards are currently in the process of being revised again.5. Community Partners for Clean Streams (CPCS)CPCS is a program recommendation of the 1994 <strong>Plan</strong>. Implementation began in 1996. CPCSengages business and institutional landowners to inform them about the impacts of theiractivities on local waterways and to aid in the preparation of individual “water quality actionplans” for each site. The action plans integrate appropriate BMPs into existing on-site activitiesto reduce nonpoint source pollution and stormwater impacts. Partners are provided technicalassistance throughout the process and community recognition in appreciation of theircommitment. Washtenaw County Government funding has allowed this program to continues apermanent operation of the Drain Commissioner’s office once 319 funding was terminated.Currently, there are 150 partners.6. Middle <strong>Huron</strong> InitiativeIn 1994 the MDEQ established a Total Maximum Daily Load (TMDL) for phosphorus enteringFord Lake. The <strong>Huron</strong> <strong>River</strong> <strong>Watershed</strong> <strong>Council</strong>, working with State technical experts and localmunicipalities, developed the Middle <strong>Huron</strong> Initiative Phosphorus Reduction Strategy for theAnn Arbor-Ypsilanti Metropolitan Area 4-28<strong>Watershed</strong> <strong>Management</strong> <strong>Plan</strong>
Middle <strong>Huron</strong> <strong>River</strong> <strong>Watershed</strong>. The initiative provides recommendations for best managementpractices along with cost estimates for implementation of the TMDL over a 5-year period. Theinitiative focuses on point and nonpoint source phosphorus initially, then takes a broader,phased approach for addressing other watershed concerns. The program includes monthlymonitoring and annual reporting. All communities within the area served by this <strong>Watershed</strong><strong>Plan</strong> have signed a Cooperative Partnership Agreement for phosphorus reduction, whichextends through 2009. See Appendix B for the Agreement.7. Sub-watershed Group <strong>Management</strong> <strong>Plan</strong>s (Creek Groups)Adopt-A-Stream volunteers and other concerned citizens have established creek groups inFleming, Malletts, Allens, Ford Lake and Traver Creeks. These five organizations developed bycitizens and facilitated by the <strong>Huron</strong> <strong>River</strong> <strong>Watershed</strong> <strong>Council</strong> and the Washtenaw County DrainCommissioner’s office, are active on the local level to promote stewardship of area creeks andFord Lake. They have become regular participants in townships and city planning activitiesaffecting water resources including:• Involvement in local decisions making: master planning, park planning, individual siteplan review,• Drafting sub-watershed management plans that serve as a foundation for this update• Staffing informational tables at public events,• Submitting issues for print in the Ann Arbor News,• Developing and distributing public educational materials.The Malletts Creek Group <strong>Management</strong> <strong>Plan</strong> (Appendix F) has been adopted by the Ann ArborCity <strong>Council</strong>; Ypsilanti City <strong>Council</strong> and the Superior Township Board have adopted The FordLake <strong>Management</strong> <strong>Plan</strong> (Appendix H).The Fleming Creek Advisory <strong>Council</strong>, a creek group active in Ann Arbor, Salem and SuperiorTownships, has produced a brochure for new residents and a preliminary plan (Appendix G).Welcome to Your <strong>Watershed</strong> provides homeowners with an identity to the creek and creekshedthey live in and informs them of threats to the local water resources. Actions to protect thecreek and its source waters are included to enable homeowners to become active stewards.The Allens Creek Group has also produced a plan (Appendix I) and a group was formed tocontribute to the Millers Creek <strong>Plan</strong> (Appendix E).8. Information and Education Through Mass Media (I & E)In January 1995, the MDEQ awarded a nonpoint source planning grant to the <strong>Huron</strong> <strong>River</strong><strong>Watershed</strong> <strong>Council</strong> for the purpose of developing a model Information, Education, andCommunication (I/E) Strategy for the <strong>Huron</strong> <strong>River</strong> <strong>Watershed</strong>.The I & E program employs advertising and marketing methods traditionally employed by theconsumer sector to elicit meaningful behavioral change in homeowner activities such as lawncare and water conservation. Demographic tools are utilized to target mass media (print, radioand mailings) messages that are coordinated and timed to complement one another.The objectives of the <strong>Plan</strong> are to:Ann Arbor-Ypsilanti Metropolitan Area 4-29<strong>Watershed</strong> <strong>Management</strong> <strong>Plan</strong>
• Reduce pollution that impacts the watershed by providing procedural knowledge to keyaudiences;• Increase the general public's awareness and knowledge of the watershed and the interconnectednessof the system;• Increase activities that result in preservation, restoration, and protection of thewatershed ecosystem;• Increase participation in watershed recreation and stewardship; and• Expand the communications plan and graphics usage to other target watershedorganizations.This plan continues to be implemented and supported by communities through their stormwaterplans and through subsequent grants and other funding sources.9. Malletts Creek RestorationThe Drain Commissioner, the City of Ann Arbor and Pittsfield Township have undertaken theMalletts Creek Restoration Project. The project has established a Technical AdvisoryCommittee (TAC), made up of representatives from pertinent City and Township departmentswho have expertise or whose departmental activities may be affected by projectrecommendations. It also included a member of the Malletts Creek Association. The TAC hasbeen involved in every aspect of the decision-making process.Four public meetings were held in conjunction with development of the Restoration <strong>Plan</strong> toincorporate public input into the overall strategy of restoration. Focus groups were convened toinvolve businesses, homeowners and other potential stakeholders into the early stages of plandevelopment. Additional opportunities for public involvement will be available asimplementation of specific restoration projects begin.The plan (Appendix F) details current impairments and establishes a cost-effective,environmentally sound, technically feasible and acceptable approach to meet its objectives,which are:• Control stream volume and velocity• Cut phosphorus loads by 50%• Improve habitatAs part of the Mallett’s Creek Restoration project, the Washtenaw County Drain Commissionersoffice added natural features to a human-made pond in Mary Beth Doyle Park. It is estimatedthat sediment and phosphorus will be reduced by between 57% and 31% from Malletts Creek.The project is an attempt to add wildlife habitat and prevent flooding. Construction began July2006 and ended August 2007, with landscaping continuing and monitoring to complete theproject. Construction costs were about $3 million. A Clean Michigan Initiative nonpoint sourcegrant funded $1.25 million in construction costs. The balance was financed through the StateRevolving Fund for the Malletts Creek Drainage District. Partners involved are City of AnnArbor, Pittsfield Charter Township and <strong>Huron</strong> <strong>River</strong> <strong>Watershed</strong> <strong>Council</strong>.10. Imperviousness StudyThe Drain Commissioner’s Office, in partnership with Ann Arbor, Scio and Superior Townships,has completed an Impervious Surface Reduction Study. The project sought to reduce the build-Ann Arbor-Ypsilanti Metropolitan Area 4-30<strong>Watershed</strong> <strong>Management</strong> <strong>Plan</strong>
out imperviousness of Honey and Fleming Creeksheds and to mitigate the impact of nonpointsource phosphorus using integrated stormwater BMPs.A complete imperviousness build-out of the townships was modeled on a GIS system.Alternative futures were also modeled based on impervious reductions through flexible designstandards for roads, parking lots and open space developments. Literature pertaining toexisting and innovative BMPs was evaluated to gauge their long-term and sustained efficacy intreating and mitigating phosphorus export.Based on the findings, recommended amendments to township ordinances governingdevelopment standards were proffered. In addition, a Stormwater <strong>Management</strong> and TreatmentOrdinance was drafted for consideration by the townships. The stormwater ordinanceestablishes a performance standard requiring new development to limit phosphorus export.Representatives of local governments participated in every phase of ordinance development.Informational presentations were made to planning commissions and boards of threecommunities considering adoption of study recommendations. A summary document detailingthe components, processes and results of the Impervious Surface Reduction Study has beenpublished and disseminated to local communities.11. Millers Creek StudyFunded primarily by Pfizer, Inc., the Millers Creek Improvement <strong>Plan</strong> (Appendix E) was theresult of work by a broad group of stakeholders in this small, but severely impacted creekshed.The study was prompted by flooding and bank erosion on Pfizer’s Ann Arbor campus. Withassistance from the Washtenaw County Drain Commissioner (WCDC) and HRWC, Pfizerinitiated the Millers Creek Action Team and this project.Following the development of the improvement plan, the team was awarded a state grant toconduct extensive improvement projects within the creekshed. Since receiving the grant,Pfizer’s corporate parent decided to close the Ann Arbor research facility and eliminate fundingfor the program. The project has been revised to focus on upland projects and education andwill carry forward with the reduced funding.12. Phosphorus Fertilizer OrdinanceThe City of Ann Arbor and Pittsfield Township passed ordinances (Appendix P) to reduce theamount of phosphorus applied to lawns throughout their jurisdictions. Ann Arbor passed itsordinance in February 2006 and it took effect January 1, 2007. That ordinance bans theapplication of phosphorus fertilizer except when a soil test confirms the need for phosphorusamendment. It also was accompanied by a broad educational campaign. The city anticipatesthat if there were full compliance with the policy, 22% of the phosphorus in the <strong>Huron</strong> <strong>River</strong>would be removed.13. Septic Inspection ProgramSeptic systems are currently in use throughout the planning area, including a limited number inthe urban areas. Many of these systems are aging, some have failed, and still others havebeen abandoned following sewer hookup. Studies across southeast Michigan show that anestimated 20% of existing septic systems are not operating properly due to impropermaintenance or damage, and are a threat to local waterways. Once installed, septic systemsAnn Arbor-Ypsilanti Metropolitan Area 4-31<strong>Watershed</strong> <strong>Management</strong> <strong>Plan</strong>
equire proper management and maintenance. To correct the problem of septic system neglect,routine inspection and clean-out is required. In 1999, Washtenaw County passed an ordinancerequiring septic inspection at the time of title transfer. The program is administered by theWashtenaw County Environmental Health Department.14. Interagency CooperationProject specific advisory committees made up of local officials have regularly met to coordinate,collaborate, share knowledge and facilitate resolution of cross-jurisdictional watershedprotection activities:• Land Use Decision Makers• Malletts Creek Restoration• Middle <strong>Huron</strong> Initiative• Sub-watershed Creek Groups• Phase II Stormwater CommunitiesIn addition to these major activities, the communities and other partners in the watershed havemade many contributions toward reducing impairments, many of which are conducted throughPhase II stormwater programs and activities related to other of the numerous collaborativebodies in the watershed.4.5 PARTING WORDSThe Middle <strong>Huron</strong> <strong>Watershed</strong> <strong>Management</strong> <strong>Plan</strong> was created to provide a strong foundationand framework for improving water quality in the Middle <strong>Huron</strong> <strong>Watershed</strong> and protecting itsvaluable natural resources for future generations. The authors hope that choosing aconsensus-based approach to developing the <strong>Plan</strong> will pay off in the form of a strong sense ofownership and unanimous support for the <strong>Plan</strong> in the years to come.The task ahead—continued implementation of this watershed management plan—demandspatience, persistence, determination, and cooperation of many partners and stakeholders at alllevels. No matter how much effort and dedication was put into the <strong>Plan</strong>, it is of little value if the<strong>Plan</strong> itself remains the primary end-point. Fortunately, the partners who contributed to the <strong>Plan</strong>are well on their way toward implementing many of its remedial activities. The partners haveput in a great effort to date and progress is obvious. However, as these communities continueto face the challenges of balancing growth with natural resource protection, the costs ofmaintaining the status quo and the benefits of long-term planning on a watershed scale willbecome increasingly apparent.Each community in the watershed has a choice. It can regard the <strong>Plan</strong> as merely another planrequired for state funding or regulation and move on to the next requirement, or it can use the<strong>Plan</strong> as it is intended: to guide each community not only in fulfilling its own requirements, butalso in partnering with other stakeholders throughout the watershed to protect the land andwater that connects us all.1 Ibid.2 Heathcote, I.W. 1999. Integrated Watersehed <strong>Management</strong>: Principles and Practices. New York: JohnWiley and Sons, Inc.Ann Arbor-Ypsilanti Metropolitan Area 4-32<strong>Watershed</strong> <strong>Management</strong> <strong>Plan</strong>
3 Ibid.4 Ibid.5 Adapted from: MSU Institute of Water Research, et al. 2000. Developing a <strong>Watershed</strong> <strong>Management</strong><strong>Plan</strong> for Water Quality. Lansing, MI: Michigan State University.6 Claytor, R. in Schueler, T. R. and H. K. Holland. 2000. The Practice of <strong>Watershed</strong> Protection. EllicottCity, MD: The Center for <strong>Watershed</strong> Protection.7 Riggs.8 Washtenaw County Drain Commissioner, 1994. “Physical and Biological Description of the <strong>Huron</strong> <strong>River</strong>,its <strong>Watershed</strong> and Tributaries in the Ann Arbor-Ypsilanti Area”.Ann Arbor-Ypsilanti Metropolitan Area 4-33<strong>Watershed</strong> <strong>Management</strong> <strong>Plan</strong>