English (pdf, 894KB) - BP
English (pdf, 894KB) - BP
English (pdf, 894KB) - BP

You also want an ePaper? Increase the reach of your titles
YUMPU automatically turns print PDFs into web optimized ePapers that Google loves.
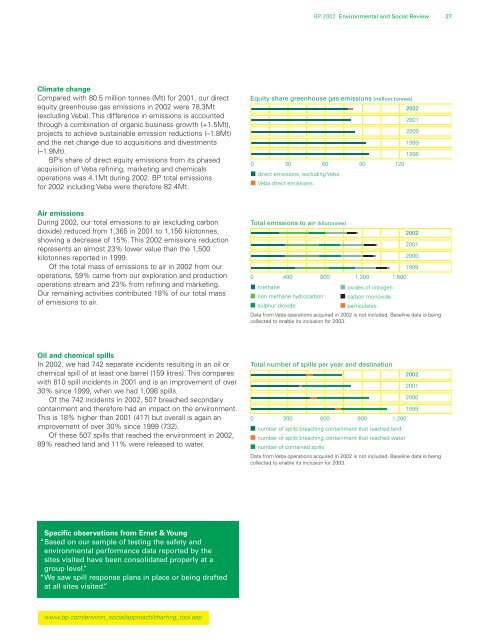
<strong>BP</strong> 2002 Environmental and Social Review 27Climate changeCompared with 80.5 million tonnes (Mt) for 2001, our directequity greenhouse gas emissions in 2002 were 78.3Mt(excluding Veba). This difference in emissions is accountedthrough a combination of organic business growth (+1.5Mt),projects to achieve sustainable emission reductions (–1.8Mt)and the net change due to acquisitions and divestments(–1.9Mt).<strong>BP</strong>’s share of direct equity emissions from its phasedacquisition of Veba refining, marketing and chemicalsoperations was 4.1Mt during 2002. <strong>BP</strong> total emissionsfor 2002 including Veba were therefore 82.4Mt.Equity share greenhouse gas emissions (million tonnes)200220012000199919980 30 60 90 120direct emissions, excluding VebaVeba direct emissionsAir emissionsDuring 2002, our total emissions to air (excluding carbondioxide) reduced from 1,365 in 2001 to 1,156 kilotonnes,showing a decrease of 15%. This 2002 emissions reductionrepresents an almost 23% lower value than the 1,500kilotonnes reported in 1999.Of the total mass of emissions to air in 2002 from ouroperations, 59% came from our exploration and productionoperations stream and 23% from refining and marketing.Our remaining activities contributed 18% of our total massof emissions to air.Total emissions to air (kilotonnes)20022001200019990 400 800 1,200 1,600methaneoxides of nitrogennon methane hydrocarbon carbon monoxidesulphur dioxideparticulatesData from Veba operations acquired in 2002 is not included. Baseline data is beingcollected to enable its inclusion for 2003.Oil and chemical spillsIn 2002, we had 742 separate incidents resulting in an oil orchemical spill of at least one barrel (159 litres). This compareswith 810 spill incidents in 2001 and is an improvement of over30% since 1999, when we had 1,098 spills.Of the 742 incidents in 2002, 507 breached secondarycontainment and therefore had an impact on the environment.This is 18% higher than 2001 (417) but overall is again animprovement of over 30% since 1999 (732).Of these 507 spills that reached the environment in 2002,89% reached land and 11% were released to water.Total number of spills per year and destination20022001200019990 300 600 900 1,200number of spills breaching containment that reached landnumber of spills breaching containment that reached waternumber of contained spillsData from Veba operations acquired in 2002 is not included. Baseline data is beingcollected to enable its inclusion for 2003.Specific observations from Ernst & Young“Based on our sample of testing the safety andenvironmental performance data reported by thesites visited have been consolidated properly at agroup level.”“We saw spill response plans in place or being draftedat all sites visited.”www.bp.com/environ_social/approach/charting_tool.asp