Relating Static and Dynamic Measurements for the Java Virtual ...
Relating Static and Dynamic Measurements for the Java Virtual ...
Relating Static and Dynamic Measurements for the Java Virtual ...
You also want an ePaper? Increase the reach of your titles
YUMPU automatically turns print PDFs into web optimized ePapers that Google loves.
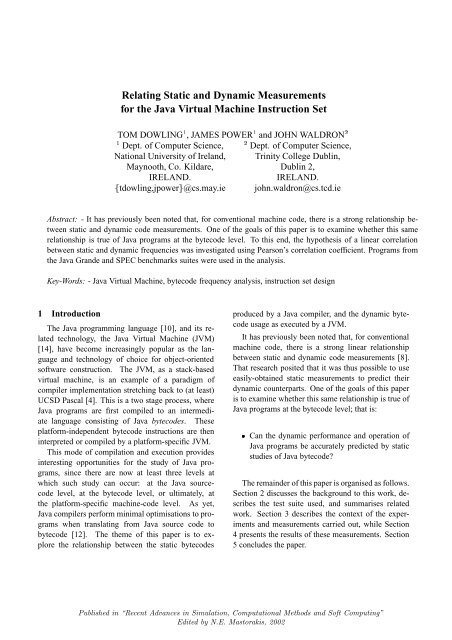
¢¡<strong>Relating</strong> <strong>Static</strong> <strong>and</strong> <strong>Dynamic</strong> <strong>Measurements</strong><strong>for</strong> <strong>the</strong> <strong>Java</strong> <strong>Virtual</strong> Machine Instruction Set¡tdowling,jpower£TOM DOWLING , JAMES POWER <strong>and</strong> JOHN WALDRONDept. of Computer Science, Dept. of Computer Science,National University of Irel<strong>and</strong>, Trinity College Dublin,Maynooth, Co. Kildare, Dublin 2,IRELAND.IRELAND.@cs.may.ie john.waldron@cs.tcd.ieAbstract: - It has previously been noted that, <strong>for</strong> conventional machine code, <strong>the</strong>re is a strong relationship betweenstatic <strong>and</strong> dynamic code measurements. One of <strong>the</strong> goals of this paper is to examine whe<strong>the</strong>r this samerelationship is true of <strong>Java</strong> programs at <strong>the</strong> bytecode level. To this end, <strong>the</strong> hypo<strong>the</strong>sis of a linear correlationbetween static <strong>and</strong> dynamic frequencies was investigated using Pearson’s correlation coefficient. Programs from<strong>the</strong> <strong>Java</strong> Gr<strong>and</strong>e <strong>and</strong> SPEC benchmarks suites were used in <strong>the</strong> analysis.Key-Words: - <strong>Java</strong> <strong>Virtual</strong> Machine, bytecode frequency analysis, instruction set design1 IntroductionThe <strong>Java</strong> programming language [10], <strong>and</strong> its relatedtechnology, <strong>the</strong> <strong>Java</strong> <strong>Virtual</strong> Machine (JVM)[14], have become increasingly popular as <strong>the</strong> language<strong>and</strong> technology of choice <strong>for</strong> object-orientedsoftware construction. The JVM, as a stack-basedvirtual machine, is an example of a paradigm ofcompiler implementation stretching back to (at least)UCSD Pascal [4]. This is a two stage process, where<strong>Java</strong> programs are first compiled to an intermediatelanguage consisting of <strong>Java</strong> bytecodes. Theseplat<strong>for</strong>m-independent bytecode instructions are <strong>the</strong>ninterpreted or compiled by a plat<strong>for</strong>m-specific JVM.This mode of compilation <strong>and</strong> execution providesinteresting opportunities <strong>for</strong> <strong>the</strong> study of <strong>Java</strong> programs,since <strong>the</strong>re are now at least three levels atwhich such study can occur: at <strong>the</strong> <strong>Java</strong> sourcecodelevel, at <strong>the</strong> bytecode level, or ultimately, at<strong>the</strong> plat<strong>for</strong>m-specific machine-code level. As yet,<strong>Java</strong> compilers per<strong>for</strong>m minimal optimisations to programswhen translating from <strong>Java</strong> source code tobytecode [12]. The <strong>the</strong>me of this paper is to explore<strong>the</strong> relationship between <strong>the</strong> static bytecodesproduced by a <strong>Java</strong> compiler, <strong>and</strong> <strong>the</strong> dynamic bytecodeusage as executed by a JVM.It has previously been noted that, <strong>for</strong> conventionalmachine code, <strong>the</strong>re is a strong linear relationshipbetween static <strong>and</strong> dynamic code measurements [8].That research posited that it was thus possible to useeasily-obtained static measurements to predict <strong>the</strong>irdynamic counterparts. One of <strong>the</strong> goals of this paperis to examine whe<strong>the</strong>r this same relationship is true of<strong>Java</strong> programs at <strong>the</strong> bytecode level; that is:¤Can <strong>the</strong> dynamic per<strong>for</strong>mance <strong>and</strong> operation of<strong>Java</strong> programs be accurately predicted by staticstudies of <strong>Java</strong> bytecode?The remainder of this paper is organised as follows.Section 2 discusses <strong>the</strong> background to this work, describes<strong>the</strong> test suite used, <strong>and</strong> summarises relatedwork. Section 3 describes <strong>the</strong> context of <strong>the</strong> experiments<strong>and</strong> measurements carried out, while Section4 presents <strong>the</strong> results of <strong>the</strong>se measurements. Section5 concludes <strong>the</strong> paper.Published in “Recent Advances in Simulation, Computational Methods <strong>and</strong> Soft Computing”Edited by N.E. Mastorakis, 2002
k-cryptk-fftk-heapsortk-lufactk-seriesk-sork-sparseThe <strong>Java</strong> Gr<strong>and</strong>e Forum Benchmark Suite Section 2: KernelsIDEA encryptionFast Fourier Trans<strong>for</strong>mInteger sortingLU FactorisationFourier coefficient analysisSuccessive over-relaxationSparse Matrix multiplicationThe <strong>Java</strong> Gr<strong>and</strong>e Forum Benchmark Suite Section 3: Large Scale Applicationsg-eul Computational Fluid <strong>Dynamic</strong>sg-mol Molecular <strong>Dynamic</strong>s simulationg-mon Monte Carlo simulationg-ray 3D Ray Tracerg-sea Alpha-beta pruned searchSt<strong>and</strong>ard Per<strong>for</strong>mance Evaluation Corporation JVM98 Benchmarkss-compress Modified Lempel-Ziv method (LZW)s-db Per<strong>for</strong>ms multiple database functions on memory resident databases-jack A <strong>Java</strong> parser generator that is based on PCCTSs-javac This is <strong>the</strong> <strong>Java</strong> compiler from <strong>the</strong> JDK 1.0.2.s-jess <strong>Java</strong> Expert Shell System is based on NASA’s CLIPS expert shell systems-mpeg Decompresses ISO MPEG Layer-3 audio filess-mtrt A raytracer with two threads each rendering a sceneFigure 1: The programs used in this analysis. There were 19 programs in total, taken from two separate suites of<strong>the</strong> <strong>Java</strong> Gr<strong>and</strong>e Forum sequential benchmarks, <strong>and</strong> from <strong>the</strong> SPEC JVM98 benchmarks.2 Background <strong>and</strong> Related WorkIn this section we present an overview of <strong>the</strong>benchmark programs used in <strong>the</strong> experiment, as wellas <strong>the</strong> method of data collection.2.1 The Benchmark SuitesA total of 19 programs have been analysed <strong>for</strong>this study, taken from both <strong>the</strong> SPEC JVM98 benchmarksuite [18] <strong>and</strong> <strong>the</strong> <strong>Java</strong> Gr<strong>and</strong>e Forum BenchmarkSuite [5, 6]. The SPEC suite was designed as anindustry-st<strong>and</strong>ard benchmark suite <strong>for</strong> measuring <strong>the</strong>per<strong>for</strong>mance of client-side <strong>Java</strong> applications, <strong>and</strong> wehave used <strong>the</strong> seven main programs from this suite.We have chosen two sets of benchmarks from version2.0 of <strong>the</strong> Gr<strong>and</strong>e suite’s sequential benchmarks.The first set of seven programs comprises section 2 of<strong>the</strong> suite, “kernels”, designed to measure frequentlyused operations. The second set of programs, section3 of <strong>the</strong> Gr<strong>and</strong>e suite, contains five large-scale applications,designed as examples of “real” applications.The benchmarks included in this work are shownin Figure 1.We believe <strong>the</strong> suites chosen are as close as possibleto “st<strong>and</strong>ard” based on published results. Manyo<strong>the</strong>r suites of benchmark programs <strong>for</strong> <strong>Java</strong> exist,including micro-benchmarks such as CaffeineMark[16] Richards <strong>and</strong> DeltaBlue [20]. As <strong>the</strong>se measuresmall, repetitive operations, it was felt that <strong>the</strong>ir resultswould not be typical of <strong>Java</strong> applications. For<strong>the</strong> same reason larger suites, designed to test <strong>Java</strong>’sthreads or server-side applications, such as SPEC’s<strong>Java</strong> Business Benchmarks (SPECjbb2000), <strong>the</strong> <strong>Java</strong>Gr<strong>and</strong>e Forum’s Multi-threaded Benchmarks, IBM’s<strong>Java</strong> Server benchmarks [2] or VolanoMark [15] havenot been included at this point.Studies of <strong>the</strong> SPEC <strong>and</strong> Gr<strong>and</strong>e suites have typicallyconcentrated on per<strong>for</strong>mance issues <strong>for</strong> variousJVMs. Studies of <strong>the</strong> Gr<strong>and</strong>e suite includeper<strong>for</strong>mance-related measures such as [5, 6], as wellas dynamic byte-code level views [7]. For <strong>the</strong> SPECsuite, [9] presents a study of <strong>the</strong> allocation <strong>and</strong> heapbehaviour , whereas [13] <strong>and</strong> [17] discuss low-levelarchitectural issues. [3] provides a higher-level dynamicbytecode view of <strong>the</strong> SPEC suite, but does notPublished in “Recent Advances in Simulation, Computational Methods <strong>and</strong> Soft Computing”Edited by N.E. Mastorakis, 2002
provide any comparison with static usage frequencies.Statistical analyses of benchmark suites have beencarried out in [12] <strong>and</strong> [11], but nei<strong>the</strong>r of <strong>the</strong>se directlyaddress <strong>the</strong> existence of a linear correlation betweenstatic <strong>and</strong> dynamic bytecode frequencies.2.2 Technical DetailsThe <strong>Java</strong> Gr<strong>and</strong>e Forum Benchmark suite is distributedin source code <strong>for</strong>mat. For this study, <strong>the</strong> programswere compiled using <strong>the</strong> <strong>Java</strong> compiler fromSUN’s JDK, version 1.3, <strong>and</strong> <strong>the</strong> static counts arebased on its output. The SPEC suite is distributed inbytecode <strong>for</strong>mat, <strong>and</strong> <strong>the</strong> static counts were compileddirectly from <strong>the</strong>se files. In order to per<strong>for</strong>m <strong>the</strong> dynamicmeasurements it was necessary to instrument aJVM to produce <strong>the</strong> relevant data. Kaffe [19], an independentimplementation of <strong>the</strong> JVM distributed under<strong>the</strong> GNU Public License, was used to collect dataon <strong>the</strong> dynamic operation of all 19 programs. Kaffeversion 1.0.6 was used <strong>for</strong> this study.3 Measurement <strong>and</strong> Analysis ModelOf <strong>the</strong> 256 possible bytecodes, only 201 bytecodeinstructions are defined <strong>for</strong> use in a class file (a fur<strong>the</strong>rthree are reserved <strong>for</strong> “internal use” by a JVM). Whileit is clearly possible to collect data <strong>for</strong> each individualbytecode (see e.g. [11]), it will suit our purposes todivide <strong>the</strong>se instructions into categories. A number ofpossible sub-divisions could be used. We have chosena relatively fine-grained approach, selecting 31 categoriesto roughly parallel those used <strong>for</strong> machine instructionsets in [8]. The bytecodes in each of <strong>the</strong>secategories are listed in Figure 3.For each of <strong>the</strong>se 31 categories, in<strong>for</strong>mation wasfirst compiled on <strong>the</strong>ir frequency of static occurrencein <strong>the</strong> bytecode files <strong>for</strong> each of <strong>the</strong> 19 applicationsin <strong>the</strong> three test suites. The 19 applications were <strong>the</strong>nrun on <strong>the</strong> instrumented Kaffe <strong>Virtual</strong> Machine, <strong>and</strong>in<strong>for</strong>mation was collected on <strong>the</strong> dynamic usage frequency<strong>for</strong> each of <strong>the</strong> categories. In all cases, <strong>the</strong>results collected excluded bytecodes executed in APIroutines, since <strong>the</strong>se are specific to <strong>the</strong> Kaffe class libraryimplementation. It should be noted however,that <strong>the</strong> percentage of executed bytecodes in <strong>the</strong> APIvaries considerably across applications [7]. Whilelack of space prohibits presenting <strong>the</strong> full frequencyGr<strong>and</strong>e Kernels<strong>Static</strong> <strong>Dynamic</strong>k-crypt 1416 905,263,342k-fft 1007 4,221,501,308k-heapsort 405 1,103,190,209k-lufact 1511 833,455,892k-series 508 560,524,605k-sor 368 3,413,988,850k-sparse 433 1,063,559,470Gr<strong>and</strong>e Applications<strong>Static</strong> <strong>Dynamic</strong>g-eul 10580 14,514,096,409g-mol 2514 7,599,820,106g-mon 4181 1,632,874,942g-ray 2518 11,792,255,694g-sea 3060 7,103,726,472SPEC JVM98<strong>Static</strong> <strong>Dynamic</strong>s-compress 2403 12,472,779,077s-db 1924 1,116,130,852s-jack 26317 264,885,522s-javac 58301 1,014,147,162s-jess 24193 1,554,389,306s-mpeg 44788 11,488,951,023s-mtrt 8647 2,121,501,462Figure 2: Summary of <strong>the</strong> experimental environment.This table summarises <strong>the</strong> test environment by giving<strong>the</strong> number of (static) bytecode instructions in eachapplication program, along with <strong>the</strong> total number ofdynamically-executed bytecode instructions.counts here, <strong>the</strong> overall size of <strong>the</strong> measurement issummarised in Figure 2.In order to test <strong>for</strong> a linear relationship between<strong>the</strong> static <strong>and</strong> dynamic instruction frequencies, we usePearson’s coefficient. Pearson’s sample correlationcoefficient is given by:¦¤§¨ £¥¤§¦©¨¤§¨¢¡Here, <strong>the</strong> two sets of data of size are representedby <strong>the</strong> variables <strong>and</strong> , with means <strong>and</strong> <strong>and</strong>¦ st<strong>and</strong>ard deviations ¦<strong>and</strong> Since <strong>the</strong> value of does not depend on <strong>the</strong> unit ofmeasurement, <strong>the</strong> static <strong>and</strong> dynamic figures <strong>for</strong> eachbytecode category were expressed as percentages of<strong>the</strong> total. This facilitated comparison across differentapplications, since <strong>the</strong> total number of bytecodePublished in “Recent Advances in Simulation, Computational Methods <strong>and</strong> Soft Computing”Edited by N.E. Mastorakis, 2002
¦Category Instruction No.acnst 1aload 25, 42, 43, 44, 45array 188, 189, 190, 197astor 58, 75, 76, 77, 78cjump 153-166, 170, 171, 198, 199compr 148, 149, 150, 151, 152f add 98, 99fcall 182, 183, 184, 185fcnst 11, 12, 13, 14, 15f div 110, 111, 114, 115field 178, 179, 180, 181fload 20, 23, 24, 34-41f mul 106, 107fstor 56, 57, 67-74f sub 102, 103, 118, 119i add 96, 97icnst 2, 3, 4, 5, 6, 7, 8, 9, 10i div 108, 109, 112, 113iload 16-19, 21, 22, 26-33i mul 104, 105istor 54, 55, 59-66i sub 100, 101, 116, 117logic 126-132miscl 0, 186, 191, 194, 195, 202-255objct 187, 192, 193retrn 169, 172, 173, 174, 175, 176, 177shift 120, 121, 122, 123, 124, 125stack 87-95, 133-147, 196ujump 167, 168, 200, 201yload 46-53ystor 79-86Figure 3: The bytecode categories used in this paper.This table lists <strong>the</strong> 31 bytecode categories used in thispaper, along with <strong>the</strong> set of bytecode instructions assignedto each category.instructioni mul 0.247 0.422 0.367 0.969 0.880logic 1.816 2.006 3.372 3.982 0.873iload 14.511 6.332 18.063 9.185 0.847shift 0.269 0.550 0.465 1.196 0.844fload 3.461 3.392 6.328 10.089 0.798i add 0.981 0.837 2.535 2.899 0.788i div 0.223 0.326 0.186 0.640 0.781astor 1.293 1.271 0.936 1.524 0.750fstor 0.870 0.985 1.486 2.333 0.743f mul 1.095 1.362 2.714 2.595 0.723f add 0.755 0.849 3.042 3.532 0.697fcall 10.233 5.845 3.627 4.580 0.694istor 2.763 2.045 2.505 3.111 0.691objct 1.461 1.254 0.554 1.267 0.665fcnst 0.667 0.841 0.332 0.848 0.665yload 3.717 3.343 7.525 6.502 0.651f sub 0.523 0.611 1.145 2.212 0.628icnst 7.126 3.382 3.206 3.037 0.588aload 17.030 6.243 16.233 8.433 0.554cjump 3.082 1.356 5.665 3.092 0.546field 11.777 6.632 11.122 8.813 0.503ujump 1.697 0.815 0.508 0.683 0.468compr 0.375 0.441 0.745 2.229 0.443f div 0.315 0.395 0.093 0.203 0.419i sub 0.768 0.787 0.687 0.968 0.360array 1.034 0.896 0.224 0.380 -0.355acnst 0.291 0.346 0.067 0.205 0.289retrn 3.182 1.539 2.074 3.336 0.258ystor 3.303 3.841 1.790 1.747 0.183stack 5.001 3.526 2.400 2.583 0.109miscl 0.134 0.304 0.005 0.021 0.087Figure 4: Summary of results obtained. Here, variables¦ <strong>and</strong> range over <strong>the</strong> static <strong>and</strong> dynamic datarespectively <strong>and</strong> is <strong>the</strong> linear correlation coefficient.instructions varied considerably from one applicationto ano<strong>the</strong>r.The values <strong>for</strong> this coefficient range between ¨¢<strong>and</strong> , where ¡ £¢¥¤§¦©¨ denotes a strong linear correlation,¤§¦© ¤§¦©¨ denotes a moderate linearcorrelation, <strong>and</strong> values of ¡ ¤§¦© denote a weaklinear correlation.4 Results <strong>and</strong> ObservationsA summary of <strong>the</strong> results obtained from calculatingPearson’s correlation coefficient is presented in Figure4.As explained in <strong>the</strong> previous section, <strong>the</strong> bivariatedata was calculated as:The frequencies of static occurrence of instructionsfrom each of <strong>the</strong> 30 categories, expressedas a percentage of <strong>the</strong> static instruction totalThe frequency of dynamic usage of instructionsfrom each of <strong>the</strong> 30 categories, expressed as apercentage of <strong>the</strong> dynamic instruction totalIn Figure 4 we show <strong>the</strong> summary data <strong>for</strong> each instructioncategory, consisting of <strong>the</strong> averages <strong>and</strong> ,<strong>the</strong> st<strong>and</strong>ard deviations <strong>and</strong> ¦ <strong>for</strong> both sets of data, Published in “Recent Advances in Simulation, Computational Methods <strong>and</strong> Soft Computing”Edited by N.E. Mastorakis, 2002
<strong>and</strong> <strong>the</strong> linear correlation coefficient . The results aresorted in decreasing order of linear correlation.It is immediately apparent that <strong>the</strong>re is overall nostrong linear correlation between <strong>the</strong> static <strong>and</strong> dynamicfigures. As can be seen in Figure 4, only 4of <strong>the</strong> categories have a linear correlation coefficientgreater than ¤§¦©¨ , <strong>and</strong> none greater than ¤§¦¡ . Theremaining 27 categories exhibit only a moderate orweak linear correlation. Indeed, even among <strong>the</strong> 4categories exhibiting a strong linear correlation, threeof <strong>the</strong>se, i mul, shift <strong>and</strong> logic have a very small averagepercentage use. It is easily verified that <strong>the</strong>main reason <strong>for</strong> <strong>the</strong> strong linear correlation <strong>for</strong> <strong>the</strong>sethree categories is <strong>the</strong> large number of applicationsthat make little or no use, statically or dynamically, of<strong>the</strong>se instructions.The one reasonably frequently-used instructioncategory that does exhibit a strong linear correlation isiload, which loads an integer from <strong>the</strong> local variablearray onto <strong>the</strong> stack. Indeed, <strong>the</strong> coefficient <strong>for</strong> <strong>the</strong>floating-point equivalent fload ¤§¦£¢¤ ¨ is , suggesting areasonably strong linear correlation here too. Thiscontrasts with <strong>the</strong> weaker linear correlation of aloadinstructions at ¤§¦© ¦¥ just . One explanation <strong>for</strong> this isthat <strong>the</strong> aload category is made up chiefly of aload 0instructions - aload 0 instructions count <strong>for</strong> 11.4/17.0of <strong>the</strong> static total <strong>and</strong> 9.2/16.2 of <strong>the</strong> dynamic total ofaload instructions. This instruction typically denotes<strong>the</strong> load of <strong>the</strong> this-pointer be<strong>for</strong>e a method invocationor field reference, <strong>and</strong> its usage varies considerablyacross applications. It is particularly unusual <strong>for</strong><strong>the</strong> g-mol application, a translation of a FORTRANprogram into <strong>Java</strong>.5 ConclusionIn this paper we have presented a methodology <strong>and</strong>results <strong>for</strong> determining <strong>the</strong> presence of a linear correlationbetween static <strong>and</strong> dynamic bytecode-level data<strong>for</strong> <strong>Java</strong> programs. We have discussed <strong>the</strong> background<strong>and</strong> merits to such an approach, <strong>and</strong> have presentedsome results <strong>for</strong> programs taken from <strong>the</strong> SPEC <strong>and</strong><strong>Java</strong> Gr<strong>and</strong>e benchmarks suites. Despite <strong>the</strong> suggestionof [8] that static frequency analysis may be usedto predict dynamic per<strong>for</strong>mance <strong>for</strong> some assemblylanguages, our figures show that this result is not directlytransferable to <strong>Java</strong> bytecodes.In future work we propose to extend this study fur<strong>the</strong>r,in particular addressing <strong>the</strong> following issues:¤Current JVM optimisation techniques concentrateon <strong>the</strong> determination of program hotspots[1], where dynamic execution is concentrated.We propose to investigate if <strong>the</strong>re is a relationshipbetween <strong>the</strong> importance of hotspots in a program’sexecution, <strong>and</strong> <strong>the</strong> lack of linear correlationbetween <strong>the</strong> static <strong>and</strong> dynamic frequencydata.¤The 31 categories chosen in this study were selectedto parallel those in [8]; o<strong>the</strong>r choices arepossible, <strong>and</strong> we propose to investigate if anyo<strong>the</strong>r choices produce better linear correlation.¤While <strong>the</strong> test suites involved are reasonablyst<strong>and</strong>ard, we <strong>for</strong>esee incorporating more of <strong>the</strong>benchmarks suites discussed in Section 2 intoour research. Ultimately, we would like to usethis technique as an aid to determine <strong>the</strong> suitabilityof individual programs within a benchmarksuite in terms of <strong>the</strong>ir overall bytecode profile.We believe that <strong>the</strong> work presented here provide asolid basis <strong>for</strong> this fur<strong>the</strong>r research.References: 1[1] E. Armstrong. Hotspot: A new breed of virtualmachine. <strong>Java</strong> World, March 1998.[2] S. Baylor, M. Devarakonda, S. Fink,E. Gluzberg, M. Kalantar, P. Muttineni,E. Barsness, R. Arora, R. Dimpsey, <strong>and</strong> S. J.Munroe. <strong>Java</strong> server benchmarks. IBM SystemsJournal, 39(1):57–81, 2000.[3] K. Bowers <strong>and</strong> D. Kaeli. Characterising <strong>the</strong>SPEC JVM98 benchmarks on <strong>the</strong> <strong>Java</strong> virtualmachine. Technical report, Nor<strong>the</strong>astern UniversityComputer Architecture Research Group,Dept. of Electrical <strong>and</strong> Computer Engineering,Boston Massachusetts 02115, USA, 1998.[4] K. Bowles. UCSD Pascal. Byte, 3:170–173,May 1978.1 All URLs last checked on November 27, 2002Published in “Recent Advances in Simulation, Computational Methods <strong>and</strong> Soft Computing”Edited by N.E. Mastorakis, 2002
[5] M. Bull, L. Smith, M. Wes<strong>the</strong>ad, D. Henty, <strong>and</strong>R. Davey. A methodology <strong>for</strong> benchmarking<strong>Java</strong> Gr<strong>and</strong>e applications. In ACM 1999 <strong>Java</strong>Gr<strong>and</strong>e Conference, pages 81–88, Palo Alto,CA, USA, June 1999.[6] M. Bull, L. Smith, M. Wes<strong>the</strong>ad, D. Henty, <strong>and</strong>R. Davey. Benchmarking <strong>Java</strong> Gr<strong>and</strong>e applications.In Second International Conference <strong>and</strong>Exhibition on <strong>the</strong> Practical Application of <strong>Java</strong>,Manchester, UK, April 2000.[7] C. Daly, J. Horgan, J. Power, <strong>and</strong> J. Waldron.Plat<strong>for</strong>m independent dynamic <strong>Java</strong> virtual machineanalysis: <strong>the</strong> <strong>Java</strong> Gr<strong>and</strong>e Forum BenchmarkSuite. In Joint ACM <strong>Java</strong> Gr<strong>and</strong>e - IS-COPE 2001 Conference, pages 106–115, Stan<strong>for</strong>d,CA, USA, June 2001.[8] J. Davidson, J. Rabung, <strong>and</strong> D. Whalley. <strong>Relating</strong>static <strong>and</strong> dynamic machine code measurements.IEEE Transactions on Computers,41(4):444–454, April 1992.[9] S. Dieckmann <strong>and</strong> U. Hölzle. A study of <strong>the</strong>allocation behaviour of <strong>the</strong> SPEC JVM98 <strong>Java</strong>benchmarks. In 13th European Conference onObject Oriented Programming, pages 92–115,Lisbon, Portugal, June 1999.[10] J. Gosling, B. Joy, <strong>and</strong> G. Steele. The <strong>Java</strong> LanguageSpecification. Addison Wesley, 1996.[11] C. Herder <strong>and</strong> J. Dujmović. Frequency analysis<strong>and</strong> timing of <strong>Java</strong> bytecodes. Technical ReportSFSU-CS-TR-00.02, San Francisco State University,Department of Computer Science, January15 2000.SPEC JVM98 benchmarks. In InternationalConference on Supercomputing, pages 22–33,Santa Fe, NM, USA, May 2000.[14] T. Lindholm <strong>and</strong> F. Yellin. The <strong>Java</strong> <strong>Virtual</strong> MachineSpecification. Addison Wesley, 1996.[15] J. Neffenger. The Volano report: Which <strong>Java</strong>plat<strong>for</strong>m is fastest, most scalable? <strong>Java</strong>World,March 1999.[16] Pendragon. Caffeinemark 3.0, May 131999. http://www.pendragon-software.com/-pendragon/cm3/.[17] R. Radhakrishnan, N. Vijaykrishnan, L. John,A. Sivasubramaniam, J. Rubio, <strong>and</strong> J. Sabarinathan.<strong>Java</strong> runtime systems: Characterization<strong>and</strong> architectural implications. IEEE Transactionson Computers, 50(2):131–146, February2001.[18] SPEC. SPEC releases SPEC JVM98,first industry-st<strong>and</strong>ard benchmark <strong>for</strong>measuring <strong>Java</strong> virtual machine per<strong>for</strong>mance.Press Release, August 19 1998.http://www.specbench.org/osg/jvm98/-press.html.[19] T. Wilkinson. KAFFE, a virtual machine to run<strong>Java</strong> code, July 2000. http://www.kaffe.org.[20] M. Wolczko. Benchmarking java with richards<strong>and</strong> deltablue, 2001. http://www.sun.com/-research/people/mario/java benchmarking/.[12] J. Horgan, J. Power, <strong>and</strong> J. Waldron. Measurement<strong>and</strong> analysis of runtime profiling data<strong>for</strong> <strong>Java</strong> programs. In First IEEE InternationalWorkshop on Source Code Analysis <strong>and</strong> Manipulation,pages 122–130, Florence, Italy, November10 2001.[13] T. Li, L. John, V. Narayanan, A. Sivasubramaniam,J. Sabarinathan, <strong>and</strong> A. Murthy. Usingcomplete system simulation to characterizePublished in “Recent Advances in Simulation, Computational Methods <strong>and</strong> Soft Computing”Edited by N.E. Mastorakis, 2002


