APPLICATIONS OF MATHEMATICS 12 June 1998 - QuestionBank.CA
APPLICATIONS OF MATHEMATICS 12 June 1998 - QuestionBank.CA
APPLICATIONS OF MATHEMATICS 12 June 1998 - QuestionBank.CA
Create successful ePaper yourself
Turn your PDF publications into a flip-book with our unique Google optimized e-Paper software.
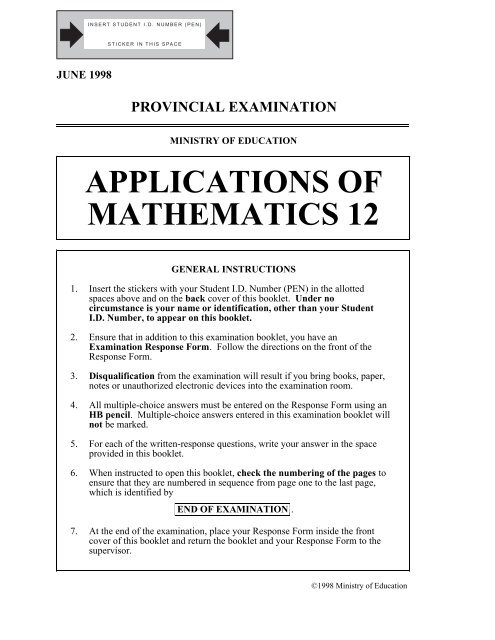
INSERT STUDENT I.D. NUMBER (PEN)STICKER IN THIS SPACEJUNE <strong>1998</strong>PROVINCIAL EXAMINATIONMINISTRY <strong>OF</strong> EDU<strong>CA</strong>TION<strong>APPLI<strong>CA</strong>TIONS</strong> <strong>OF</strong><strong>MATHEMATICS</strong> <strong>12</strong>GENERAL INSTRUCTIONS1. Insert the stickers with your Student I.D. Number (PEN) in the allottedspaces above and on the back cover of this booklet. Under nocircumstance is your name or identification, other than your StudentI.D. Number, to appear on this booklet.2. Ensure that in addition to this examination booklet, you have anExamination Response Form. Follow the directions on the front of theResponse Form.3. Disqualification from the examination will result if you bring books, paper,notes or unauthorized electronic devices into the examination room.4. All multiple-choice answers must be entered on the Response Form using anHB pencil. Multiple-choice answers entered in this examination booklet willnot be marked.5. For each of the written-response questions, write your answer in the spaceprovided in this booklet.6. When instructed to open this booklet, check the numbering of the pages toensure that they are numbered in sequence from page one to the last page,which is identified byEND <strong>OF</strong> EXAMINATION .7. At the end of the examination, place your Response Form inside the frontcover of this booklet and return the booklet and your Response Form to thesupervisor.©<strong>1998</strong> Ministry of Education
THIS PAGE INTENTIONALLY BLANK
THIS PAGE INTENTIONALLY BLANK
PART A: MULTIPLE CHOICEValue: 45 marksINSTRUCTIONS:Suggested Time: 75 minutesFor each question, select the best answer and record your choice on the ResponseForm provided. Using an HB pencil, completely fill in the circle that has the lettercorresponding to your answer.1. Determine a 23 in matrix A below.A. 3 × 4B. 4 × 3C. 2D. 4⎡ −1 0 5 4 ⎤A =⎢−2 −3 2 7⎥⎢⎥⎣⎢8 4 −1 4 ⎦⎥2. Consider the following matrices:⎡ 4 −2 1 ⎤A = ⎢ ⎥ and B =⎣ 7 3 2 ⎦⎡ 2 4 ⎤⎢ ⎥⎢ 3 −1 ⎥⎢ ⎥⎣ 0 7 ⎦Find the element in the second row and first column of the product AB.A. 2B. 23C. 25D. 39- 1 -OVER
3. Determine x, such that3⎡⎢⎢⎢⎣8 x ⎤⎥2 3 ⎥⎥1 −2 ⎦⎡ −1 −3x⎤⎢ ⎥+ 5 ⎢ 2 7 ⎥⎢ ⎥⎣ 8 9 ⎦=⎡ p 6 ⎤⎢ ⎥⎢ q r ⎥⎢ ⎥⎣ s t ⎦A. −3B. −2C. − 1 2D.134. A cashier makes a list of the coins that are in the till at the end of each day.PENNIES NICKELS DIMES QUARTERSSATURDAY 30 15 7 19SUNDAY 28 9 10 15Matrix N represents the number of coins, and Matrix V represents the value of each coin.⎡ 1 ⎤⎢ ⎥⎡ 30 15 7 19 ⎤⎢ 5 ⎥N = ⎢⎥ V =⎣ 28 9 10 15⎢⎦10⎥⎢ ⎥⎢⎣ 25 ⎥⎦Which of the following will give the amount of money in coins at the end of each day?A. N + VB. 100( N + V )C. NVD. VN- 2 -
5. Solve the following system for x:A. −2B. −1C. 1D. 22 x − y + 4z = 7x − 3y + z =−23x−2y+2z=−2Use the following information to answer questions 6 and 7.Last year in Burns Lake, among companies that purchase new vehicles every year, 76%of the purchases made were trucks and 24% were cars. A survey indicates that <strong>12</strong>% ofthose who bought trucks will buy cars next year, while 8% of the car buyers will switchto trucks.6. If this trend continues, what percent of the companies will purchase a car next year?A. 24%B. 28%C. 31%D. 33%7. If the same trend continues over the long term, what percent of these companies will purchasecars?A. 60%B. 63%C. 67%D. 69%- 3 -OVER
8. A schedule of base insurance costs for a certain car is as follows:Third party liability $950• increased liability ($1 000 000) $150• increased liability ($2 000 000) $250Collision ($200 deductible) $450Comprehensive ($100 deductible) $300What is the minimum cost to legally insure a car according to the fee schedule above?A. $750B. $950C. $1 250D. $1 850Use the following spreadsheet to answer question 9.<strong>12</strong>34ARent34B C DSupplies Salaries Utilities5 27 49. What value would appear in cell B3 if the formula “ = 2* ( A2+B2) ” is applied?A. 11B. 14C. 16D. 30- 4 -
Use the following spreadsheet to answer question 10.A B CDE1Payment #PaymentInterest PaymentPayment to PrincipleUnpaid Balance2500.003186.275.0042536410. The spreadsheet shows the beginning of an amortization table for the payments made on a $500purchase over six equal monthly payments with an interest rate of 1% per month. How much ofthe second payment goes toward the principle?A. $81.27B. $82.08C. $82.13D. $86.2711. Which of the following describes the sequence t n = 2 −n ?A. constantB. divergentC. alternatingD. convergent<strong>12</strong>. Determine the third term of the sequence defined by the recursive formula:A. 9B. 17C. 18D. 33t 1 = 5t n = 2t n−1 −1, n>1- 5 -OVER
Use the following diagram to answer question 13.FIGURE 1 FIGURE 2 FIGURE 313. The diagram shows a fractal pattern known as the Sierpinski Triangle. How many greytriangles will there be in the eighth figure?A. 729B. 2 187C. 3 280D. 6 561- 6 -
14. The diagram below shows the first three iterations in the generation of a fractal. Sets ofsuccessively smaller squares (shaded region) are removed as shown in the diagrams.Squares removed have sides that are 1 3of the length of the previous set.ORIGINALITERATION <strong>12</strong>7 cm 27 cmITERATION 2 ITERATION 327 cm 27 cmIf the original square has sides 27 cm long, determine the area, in cm 2 , of the fractal(white region) after the third iteration.A. 325B. 333C. 381D. 405- 7 -OVER
15. Which graph represents the sequence defined by t n = sin⎛⎝π 2 n ⎞⎠ , n ≥ 1 ?A.t nB.t nπ2πnπ2πnC.t nD.t n2 4n2 4nUse the following graph to answer question 16.PyQSRx16. Which point could not provide the optimal solution for the linear programming problemgraphed above?A. PB. QC. RD. S- 8 -
17. Which system of inequalities describes the graph below?y10y = 2 x − 3y = 4y = − 5 2 x + 610xA. y ≥ 4B. y ≥ 4y ≥ 2 x − 3y ≤ 2 x − 3y ≥− 5 2 x+6y ≤− 5 2 x+6C. y ≤ 4D. y ≤ 4y ≥ 2 x − 3y ≥ 2 x − 3y ≤− 5 2 x+6 y ≥− 5 2 x+6- 9 -OVER
18. Which graph illustrates a function y = a x where a > 0 ?A. yB. yxxC. yD. yxx19. Solve for x: 2 x 3 − x 2 = 8x − 4A. 0.5B. −2, 2C. −2, 0, 2D. −2, 0.5, 2- 10 -
20. A certain antibiotic reduces the number of bacteria in your system by 10% each day.If P = present level, P 0 = original level and t = time in days, which equation determinesthe present level of bacteria?A. P = P 0 − 0.1tB. P = P 0 ( 0.9t)C. P = P 0 ( 0.1) tD. P = P 0 ( 0.9) t21. Given the graph of y = f( x), how many positive x-intercepts would the functiony = f( x−1)−2 have?y4(1, 4)•–13xA. 0B. 2C. 3D. 4- 11 -OVER
Use the following graph to answer questions 22 and 23.yHeight(metres)804005 10 15 20 25 30Time (minutes)x22. What is the period of the graph?A. 10 minutesB. 15 minutesC. 40 metresD. 80 metres23. What is the amplitude of the graph?A. 5 minutesB. 10 minutesC. 40 metresD. 80 metres24. The volume V of air in the lungs during deep breathing can be expressed as a sinusoidalfunction with respect to time t. If one complete breath takes 10 seconds, and the volume of airin the lungs varies from 1 000 mL to 5 000 mL, which of the following equations best modelsthis situation?A. V = 3000 sin⎛⎝π 5 t ⎞⎠ + 2 000B. V = 2 000 sin⎛ ⎝π10 t ⎞⎠ + 3000C. V = 2 000 sin⎛⎝π 5 t ⎞⎠ + 3000D. V = 4 000 sin⎛⎝π 5 t ⎞⎠ + 3000- <strong>12</strong> -
25. The sinusoidal graph below shows how the alternating electric current supplied to our housesvaries over time. The period of one cycle is 160 s.Current(amperes)a8–8160tTime(seconds)If the current is at its maximum of 8.0 amperes at time t = 0 seconds, what would the currentbe at t = 2.01 s?A. −6.50 amperesB. −6. 47 amperesC. −4.70 amperesD. −2. 47 amperes26. In the right rectangular prism shown, AB = 3cm, AD = 4cm , and DH = 4cm.ADBCEHFGWhat is the length of EG in centimetres?A. 5B. 7C. 7D. 41- 13 -OVER
27. A backyard patio is designed as shown in the diagram.AGDBFCEIf ∠DCE = 70° and ABCD and DEFG are equal squares, find the measure of theobtuse angle, ∠ADG .A. 130°B. 140°C. 150°D. 160°28. Which statement describes the ratio of the circumference of a circle to its radius?A. 1: πB. π:1C. 1: 2πD. 2π:1- 14 -
29. An equilateral triangle is inscribed in a circle of radius 2.0 m. Find the length of a side ofthe triangle, accurate to the nearest tenth of a metre.A. 2.0B. 3.0C. 3.3D. 3.530. A circular hole 30 cm in diameter is cut in a sheet of plywood as shown in the diagram.A sphere with radius 17 cm is set in the hole.30 cmHow far below the top surface of the plywood will the sphere extend?A. 6 cmB. 7 cmC. 8 cmD. 9 cm- 15 -OVER
31. A flower garden is constructed in the shape of a segment of a circle as shown in the diagram.8 m24 mWhat is the radius of the circle used to construct the garden?A. <strong>12</strong>.0 mB. 13.0 mC. 14.4 mD. 17.0 m32. Given the diagram with ∠<strong>CA</strong>D = 20°, AB = 5cm and DO = 5cm, find ∠DCB.CBDOEAA. 80°B. 90°C. 100°D. 110°- 16 -
33. Which of the following scatter plots best illustrates the relationship between the distance aperson lives from school and their % mark in mathematics?A. yB. yMark in Mathematics (%)10050Mark in Mathematics (%)1005005 10Distance from School (km)x05 10Distance from School (km)xC. yD. yMark in Mathematics (%)10050Mark in Mathematics (%)1005005 10Distance from School (km)x05 10Distance from School (km)x- 17 -OVER
34. A high school math teacher compared his students’ final grades for a first year math course atBCIT with their SMS (Standard Ministry Score) for their Applications of Mathematics <strong>12</strong>Provincial Examination.Final Gradeat BCITSMS68 44088 56093 72083 52075 480Using this data, determine the correlation coefficient.A. 0.816B. 0.904C. 0.945D. 0.972Use the following graph to answer question 35.yQRSTµx35. Which of the standard normal curves above has the largest standard deviation?A. QB. RC. SD. T- 18 -
36. A factory produces spools of fishing line. The length of line on a spool is normally distributed,with a mean of 94.49 m and a standard deviation of 0.23 m. Calculate the z-score for a spoolcontaining 94.00 m of line.A. −2.13B. −0.48C. 0.48D. 2.1337. A certain type of seed has a 75% germination rate. If the seeds are planted in rows of 20, findthe standard deviation for the number of seeds that germinate in each row.A. 1.82B. 1.94C. 3.87D. 15.0038. Forty percent of the voters of a region are Liberals. If five voters are selected at random,determine the probability that all five are Liberals.A. 1%B. 2%C. 5%D. 8%39. Two coins lie on a table, each showing heads. One is a fair coin, the other has heads on bothsides. You are to select one of the coins and then flip it 3 times. What is the probability thatyou will flip 3 heads in a row?A.B.C.D.<strong>12</strong>9165834- 19 -OVER
40. A store takes a random sample of the prices for 64 ski outfits. The sample mean and standarddeviation are $850 and $200, respectively. Find a 95% confidence interval for µ, the meanprice of all ski outfits.A. 801
43. Two adjacent rectangles have a common side as shown in the diagram.5 mC1 mxB1 mADetermine an expression for the length of the segment BC.A. 5 2 + x 2B. ( 5 − x) 2 + x 2C. ( 5 − x) 2 +1D. ( x − 5) 2 −144. Simplify the following:( n −1)! − ( n−2)!( n−1)!A.B.C.D.−3n −11n −1nn −1n − 2n −1- 21 -OVER
45. Given the following circle with centre C, find the area of the shaded region.5 cmC4 cmA. 2.04 cm 2B. 4.09 cm 2C. 4.20 cm 2D. 6.08 cm 2 This is the end of the multiple-choice section.Answer the remaining questions directly in this examination booklet.- 22 -
PART B: WRITTEN RESPONSEValue: 25 marksINSTRUCTIONS:Suggested Time: 45 minutesRough-work space has been incorporated into the space allowed for answering eachquestion. You may not need all the space provided to answer each question. Whererequired, place the final answer for each question in the space provided.If, in a justification, you refer to information produced by the calculator, thisinformation must be presented clearly in the response. For example, if a graph isused in the solution of the problem, it is important to sketch the graph, showing itsgeneral shape and indicating the appropriate window dimensions.When using the calculator, you should provide a decimal answer that is correct to atleast two decimal places (unless otherwise indicated). Such rounding should occuronly in the final step of the solution.Full marks will NOT be given for the final answer only.- 23 -OVER
Use the following graph to answer question 1.y10REGION 1 REGION 2 REGION 35+++5 1015x1. In order to find the line of best fit for a set of data, the following three summary points weredetermined to represent the data set:( 6, 3)Region 1,( 9, 5)Region 2, and( <strong>12</strong>, 6)Region 3Find the equation of the median-median line.(2 marks)- 24 -
ANSWER:- 25 -OVER
2. Determine x such that 10 x = 400. (Accurate to 4 decimal places.) (2 marks)If a graph is used, sketch the graph, indicate appropriatewindow dimensions and explain clearly how your solution isderived from the graph.[ , ]xminxmax[ , ]yminymax- 26 -
ANSWER:- 27 -OVER
Use the following diagram to answer question 3.QuesnelPrince GeorgeVancouverKelowna3. The diagram above illustrates direct flights, between four cities, offered by a certain airline.Complete the following network matrix and determine all situations where a traveller can gofrom one city to a different city having exactly two routes with one stopover on each route.(3 marks)ToFromVQKP⎡⎢⎢⎢⎢⎢⎣⎢V Q K P⎤⎥⎥⎥⎥⎥⎦⎥- 28 -
ANSWER:- 29 -OVER
4. A wheelchair ramp is to be constructed in three sections, with a uniform rise throughout, asshown in the diagram. Over its entire distance, the ramp must rise 3 m. The horizontal distancecovered is 10 m.3 metresθ10 metresa) At what angle, θ, must the ramp be constructed from the horizontal? (Accurate to thenearest tenth of a degree.)(1 mark)ANSWER:- 30 -
) If the cost of constructing the ramp is $400 per lineal metre, determine the cost of the rampto the nearest dollar.(2 marks)ANSWER:- 31 -OVER
5. How much should a parent invest now, at 8% compounded quarterly, to accumulate $24 000 in18 years, for their child’s post-secondary education? (3 marks)- 32 -
ANSWER:- 33 -OVER
6. An engineering firm is hiring x engineers at $50 000 per year and y assistants at $30 000 peryear. The budget for these salaries is $1 200 000 per year. There must be at least <strong>12</strong> engineersand at least one assistant for each engineer.a) Determine a system of inequalities that must be satisfied by the numbers of engineers andassistants and plot these inequalities on the grid provided.(3 marks)y4030201010 20 30 40x- 34 -
) Determine the maximum number of engineers that can be hired. (1 mark)ANSWER:- 35 -OVER
7. Statistics Canada lists the value of RRSP holdings by Canadians (in millions of dollars) forvarious years as shown in the table below.YEAR MILLIONS <strong>OF</strong> $1970 1871980 3 3551985 7 7691990 13 6451994 16 072a) Determine the least squares linear regression line for this data. (1 mark)ANSWER:- 36 -
) Calculate the projected value of RRSP holdings by Canadians in the year 2000. (1 mark)ANSWER:- 37 -OVER
8. The number of salmon n caught in a stream over the past 15 years is as follows:NUMBER <strong>CA</strong>UGHT (n) YEARS500 ≤ n < 1 500 41 500 ≤ n < 2 500 82 500 ≤ n < 3 500 23 500 ≤ n < 4 500 1a) What is the mean of the number of salmon caught? (2 marks)ANSWER:- 38 -
) What is the standard deviation of the number of salmon caught? (1 mark)ANSWER:- 39 -OVER
9. The revenue R received by a company selling calculators is given by R = xp, where x is thenumber of calculators sold at price p in dollars. If x = 4 000 − 25 p, find the price p thatwould generate the maximum revenue.(3 marks)If a graph is used, sketch the graph, indicate appropriatewindow dimensions and explain clearly how your solution isderived from the graph.[ , ]xminxmax[ , ]yminymax- 40 -
ANSWER:END <strong>OF</strong> EXAMINATION- 41 -
THIS PAGE INTENTIONALLY BLANK
||||||||||||||||||||||||||||||||||||||||||||||||||||||||||Geometry:Triangle:Circle:Sphere:Cylinder:Cone:Volume of pyramid:Volume of prism:Probability and Statistics:n P r = Pn,rn C r = Cn,r( ) = n!( ) = nrx = 1 n Σ ( f i) ( x i )Area = 1 2 bh( n−r)!= 1 ab sin C2= 1 a 2 sin Bsin C2 sin AFORMULAE= ss−a ( )( s−b) ( s−c)wheres = a + b + c2A =πr 2 , C=2πr=πdA = 4πr 2 , V = 4 3 πr3A = 2πr 2 + 2πrh , V =πr 2 hA =πrs +πr 2 , V = 1 3 πr2 hV = 1 3 A b hV = A b h⎛⎝ ⎞ ⎠ = n!r! ( n−r)!σ= 1 n Σ( x i −x)2= 1 n Σx i 2 − x 2µ=npσ= npq( ) = n rbn,r;p⎛⎝ ⎞ ⎠ pr q n−rInterest:A = P⎛⎝1 + r nI = PrtMiscellaneous:sin Aaz = x− xσx −z α2⎞⎠nta 2 = b 2 + c 2 − 2bc cos A= sin Bb= sin Ccd = ( x 2 − x 1 ) 2 + ( y 2 − y 1 ) 2x = −b±S ∞ =a1 − rb2 −4ac2aσn
TABLE <strong>OF</strong> Z-SCORESZ = Z-ScoreAn entry in the table is the area under the curve between Z = 0 and a positivevalue of Z. Areas for negative values of Z are obtained by symmetry.0 ZZ 0.00 0.01 0.02 0.03 0.04 0.05 0.06 0.07 0.08 0.090.00.10.20.30.40.00000.03980.07930.11790.15540.00400.04380.08320.<strong>12</strong>170.15910.00800.04780.08710.<strong>12</strong>550.16280.0<strong>12</strong>00.05170.09100.<strong>12</strong>930.16640.01600.05570.09480.13310.17000.01990.05960.09870.13680.17360.02390.06360.10260.14060.17720.02790.06750.10640.14330.18080.03190.07140.11030.14800.18440.03590.07530.11410.15170.18790.50.60.70.80.90.19150.22570.25800.28810.31590.19500.22910.26110.29100.31860.19850.23240.26420.29390.32<strong>12</strong>0.20190.23570.26730.29670.32380.20540.23890.27030.29950.32640.20880.24220.27340.30230.32890.2<strong>12</strong>30.24540.27640.30510.33150.21570.24860.27940.30780.33400.21900.25170.28230.31060.33650.22240.25490.28520.31330.33891.01.11.21.31.40.34130.36420.38490.40320.41920.34380.36650.38690.40490.42070.34610.36860.38880.40660.42220.34850.37080.39070.40820.42360.35080.37290.39250.40990.42510.35310.37490.39440.41150.42650.35540.37700.39620.41310.42790.35770.37900.39800.41470.42920.35990.38100.39970.41620.43060.36210.38300.40150.41770.43191.51.61.71.81.90.43320.44520.45540.46410.47130.43450.44630.45640.46490.47190.43570.44740.45730.46560.47260.43700.44840.45820.46640.47320.43820.44950.45910.46710.47380.43940.45050.45990.46780.47440.44060.45150.46080.46860.47500.44180.45250.46160.46930.47560.44290.45350.46250.46990.47610.44410.45450.46330.47060.47672.02.<strong>12</strong>.22.32.40.47720.48210.48610.48930.49180.47780.48260.48640.48960.49200.47830.48300.48680.48980.49220.47880.48340.48710.49010.49250.47930.48380.48750.49040.49270.47980.48420.48780.49060.49290.48030.48460.48810.49090.49310.48080.48500.48840.49110.49320.48<strong>12</strong>0.48540.48870.49130.49340.48170.48570.48900.49160.49362.52.62.72.82.90.49380.49530.49650.49740.49810.49400.49550.49660.49750.49820.49410.49560.49670.49760.49820.49430.49570.49680.49770.49830.49450.49590.49690.49770.49840.49460.49600.49700.49780.49840.49480.49610.49710.49790.49850.49490.49620.49720.49790.49850.49510.49630.49730.49800.49860.49520.49640.49740.49810.49863.00.49870.49870.49870.49880.49880.49890.49890.49890.49900.4990ii
|||||||||||||||||||||||||||||||||||||||||||||||||||||||||||ROUGH WORK FOR GRAPHING(No marks will be given for work done on this page.)You may detach this page for convenient reference.Exercise care when tearing along perforations.iii
ROUGH WORK FOR GRAPHING(No marks will be given for work done on this page.)iv
|||||||||||||||||||||||||||||||||||||||||||||||||||||||||||ROUGH WORK FOR MULTIPLE-CHOICEYou may detach this page for convenient reference.Exercise care when tearing along perforations.v
ROUGH WORK FOR MULTIPLE-CHOICEvi
||||||||||||||||||||||||||||||||||||||||||||||||||||||||||||
INSERT STUDENT I.D. NUMBER (PEN)STICKER IN THIS SPACE<strong>APPLI<strong>CA</strong>TIONS</strong> <strong>OF</strong><strong>MATHEMATICS</strong> <strong>12</strong><strong>June</strong> <strong>1998</strong>Course Code = AMA
FOR <strong>OF</strong>FICE USE ONLY<strong>APPLI<strong>CA</strong>TIONS</strong> <strong>OF</strong><strong>MATHEMATICS</strong> <strong>12</strong><strong>June</strong> <strong>1998</strong>Score forQuestion 1:1. _____(2)Score forQuestion 2:2. _____(2)Score forQuestion 6b:8. _____(1)Score forQuestion 7a:9. _____(1)Course Code = AMAScore forQuestion 3:3. _____(3)Score forQuestion 7b:10. _____(1)Score forQuestion 4a:4. _____(1)Score forQuestion 8a:11. _____(2)Score forQuestion 4b:5. _____(2)Score forQuestion 8b:<strong>12</strong>. _____(1)Score forQuestion 5:6. _____(3)Score forQuestion 9:13. _____(3)Score forQuestion 6a:7. _____(3)


