Valuing Wetlands in Southern Ontario's Credit River Watershed
Valuing Wetlands in Southern Ontario's Credit River Watershed
Valuing Wetlands in Southern Ontario's Credit River Watershed

Create successful ePaper yourself
Turn your PDF publications into a flip-book with our unique Google optimized e-Paper software.
<strong>Valu<strong>in</strong>g</strong> Wetland Ecosystem Services <strong>in</strong> the <strong>Credit</strong> <strong>River</strong> <strong>Watershed</strong>, Ontario: Phase 1 ReportNgaio Hotte, Mike Kennedy and Van LantzMay 20092009 The Pemb<strong>in</strong>a Institute and <strong>Credit</strong> Valley ConservationThe Pemb<strong>in</strong>a InstituteBox 7558Drayton Valley, AlbertaCanada T7A 1S7Phone: 780-542-6272Email: <strong>in</strong>fo@pemb<strong>in</strong>a.org<strong>Credit</strong> Valley Conservation1255 Old Derry RoadMississauga, OntarioCanada L5N 6R4Phone: 905-670-1615 or 1-800-668-5557Fax: 905-670-2210Email: cvc@creditvalleyca.caAdditional copies of this publication may be downloaded from the Pemb<strong>in</strong>a Institute website(www.pemb<strong>in</strong>a.org) and <strong>Credit</strong> valley Conservation (www.creditvalleyca.ca)About the Pemb<strong>in</strong>a InstituteThe Pemb<strong>in</strong>a Institute is a national non-profit th<strong>in</strong>k tank that advances susta<strong>in</strong>able energysolutions through research, education, consult<strong>in</strong>g and advocacy. It promotes environmental,social and economic susta<strong>in</strong>ability <strong>in</strong> the public <strong>in</strong>terest bydevelop<strong>in</strong>g practical solutions for communities, <strong>in</strong>dividuals,governments and bus<strong>in</strong>esses. The Pemb<strong>in</strong>a Instituteprovides policy research leadership and education on climatechange, energy issues, green economics, energy efficiencyand conservation, renewable energy, and environmentalgovernance. For more <strong>in</strong>formation about the Pemb<strong>in</strong>a Institute, visit www.pemb<strong>in</strong>a.org orcontact <strong>in</strong>fo@pemb<strong>in</strong>a.org. Our engag<strong>in</strong>g monthly newsletter offers <strong>in</strong>sights <strong>in</strong>to the Pemb<strong>in</strong>aInstitute’s projects and activities, and highlights recent news and publications. Subscribe toPemb<strong>in</strong>a eNews: http://www.pemb<strong>in</strong>a.org/enews/subscribe.About <strong>Credit</strong> Valley Conservation<strong>Credit</strong> Valley Conservation (CVC) was formed on May 13, 1954, and hasbeen work<strong>in</strong>g for over 50 years to protect the natural environment. CVC isone of 36 conservation authorities operat<strong>in</strong>g <strong>in</strong> Ontario and is a partnershipof the municipalities with<strong>in</strong> the <strong>Credit</strong> <strong>River</strong> <strong>Watershed</strong>. CVC is a communitybasedenvironmental organization orig<strong>in</strong>ally formed by an Act of prov<strong>in</strong>cialgovernment and dedicated to conserv<strong>in</strong>g, restor<strong>in</strong>g, develop<strong>in</strong>g andmanag<strong>in</strong>g natural resources on a watershed basis. More <strong>in</strong>formation aboutCVC is available at www.creditvalleyca.ca.The Pemb<strong>in</strong>a Institute • <strong>Credit</strong> Valley Conservation ii <strong>Valu<strong>in</strong>g</strong> Wetland Ecosystem Services (Phase I) • 2009
About the AuthorsNgaio Hotte, B.Sc., at the time of this report, was a Researcher and Technical Analyst with thePemb<strong>in</strong>a Institute's Corporate Consult<strong>in</strong>g program and provided support for the GreenEconomics program. Ngaio has expertise on environmental legislation, has performed reviewsof corporate environmental management plans, researched stakeholder perspectives onenvironmental issues, and researched the conservation of ecological goods and services us<strong>in</strong>gmarket based <strong>in</strong>struments. Ngaio holds a Bachelor of Science degree from the University ofGuelph and a post-graduate diploma <strong>in</strong> environmental eng<strong>in</strong>eer<strong>in</strong>g applications from ConestogaCollege. Ngaio is a certified environmental practitioner-<strong>in</strong>-tra<strong>in</strong><strong>in</strong>g (CEPIT) and a professionalbiologist (P.Biol).Mike Kennedy, M.Sc., is a Senior Resource Economist with the Pemb<strong>in</strong>a Institute’s GreenEconomics and Policy program. Mike’s research work <strong>in</strong>volves provid<strong>in</strong>g policy advice togovernment, private corporations and other non-government organizations <strong>in</strong> Canada andabroad on policy issues related to natural resource valuation, ecological goods and serviceprovision, carbon pric<strong>in</strong>g, and tax policy for natural resource sectors. Mike holds a Master ofScience, with a concentration <strong>in</strong> natural resource and environmental economics, from theUniversity of NewBrunswick.Van Lantz, PhD, is currently an Associate Professor of Environmental and ResourceEconomics <strong>in</strong> the Faculty of Forestry & Environmental Management and the Department ofEconomics at the University of New Brunswick. He received his PhD <strong>in</strong> economics from SimonFraser University <strong>in</strong> British Columbia. His research is focused on the valuation of natural andenvironmental resource goods and services. Recent projects, publications, and presentationsrelate to the assessment of market and non-market benefits and costs of establish<strong>in</strong>g protectednatural areas, controll<strong>in</strong>g forest pest outbreaks, and implement<strong>in</strong>g climate change policies.The Pemb<strong>in</strong>a Institute • <strong>Credit</strong> Valley Conservation iii <strong>Valu<strong>in</strong>g</strong> Wetland Ecosystem Services (Phase I) • 2009
AcknowledgementsThe authors would like to acknowledge the Green Belt Foundation for their f<strong>in</strong>ancial support ofthis work. The authors would also like to acknowledge the valuable contribution of the projectsteer<strong>in</strong>g committee members and CVC staff, <strong>in</strong>clud<strong>in</strong>g:Kathy MacPherson – Friends of the Greenbelt FoundationOwen Steele – Ducks UnlimitedEdward Crummey – Ontario M<strong>in</strong>istry of Natural ResourcesEric Miller – Ontario M<strong>in</strong>istry of Natural ResourcesBob Morris – <strong>Credit</strong> Valley ConservationPaul Biscaia – <strong>Credit</strong> Valley ConservationJohn K<strong>in</strong>kead – <strong>Credit</strong> Valley ConservationMike Puddister – <strong>Credit</strong> Valley ConservationAviva Patel – <strong>Credit</strong> Valley ConservationJeff Wilson – <strong>Credit</strong> Valley ConservationTatiana Koveshnikova – <strong>Credit</strong> Valley ConservationThe Pemb<strong>in</strong>a Institute • <strong>Credit</strong> Valley Conservation iv <strong>Valu<strong>in</strong>g</strong> Wetland Ecosystem Services (Phase I) • 2009
<strong>Valu<strong>in</strong>g</strong> <strong>Wetlands</strong> <strong>in</strong> <strong>Southern</strong> Ontario’s<strong>Credit</strong> <strong>River</strong> <strong>Watershed</strong>Wetland Ecosystem Services Characterization andLiterature ReviewContents1. Introduction .........................................................................................................................12. Identify<strong>in</strong>g Wetland Ecological Services ..........................................................................32.1 Types of <strong>Wetlands</strong> .......................................................................................................................32.2 Ecological Services Provided by <strong>Wetlands</strong> .................................................................................43. Biophysical Characteristics of Wetland Ecological Services.........................................83.1 Biophysical Functions ..................................................................................................................83.2 L<strong>in</strong>k<strong>in</strong>g Wetland Services and Human Activities .......................................................................164. Wetland Valuation .............................................................................................................204.1 Wetland valuation methods .......................................................................................................204.2 Data requirements, advantages and disadvantages of non-market valuation methods ...........214.3 Non-market valuation studies and range of wetland value estimates .......................................244.4 Questions to consider when choos<strong>in</strong>g among valuation methods ............................................265. Research Plan for Phase 2 ...............................................................................................275.1 Research objectives: .................................................................................................................275.2 Priority wetland services to be valued: ......................................................................................275.3 Basel<strong>in</strong>e data availability: ..........................................................................................................275.4 The policy scenario to consider: ................................................................................................325.5 Applied research approaches to consider: ................................................................................33Appendix....................................................................................................................................35Endnotes....................................................................................................................................36The Pemb<strong>in</strong>a Institute • <strong>Credit</strong> Valley Conservation v <strong>Valu<strong>in</strong>g</strong> Wetland Ecosystem Services (Phase I) • 2009
ContentsList of FiguresFigure 1. Approach taken <strong>in</strong> our summary of the literature...........................................................2Figure 2. Total economic value framework for environmental valuation.......................................4Figure 3. Land use types with<strong>in</strong> the <strong>Credit</strong> <strong>River</strong> <strong>Watershed</strong>......................................................29Figure 4. Land cover surround<strong>in</strong>g wetlands <strong>in</strong> the <strong>Credit</strong> watershed..........................................31List of TablesTable 1. Classification of Canadian wetlands ...............................................................................3Table 2. Summary of direct use values of wetlands .....................................................................5Table 3. Summary of <strong>in</strong>direct use values of wetlands...................................................................5Table 4. Summary of option values of wetlands ...........................................................................7Table 5. Summary of existence values of wetlands......................................................................7Table 6 Estimates of carbon storage <strong>in</strong> <strong>Ontario's</strong> wetlands. .......................................................11Table 7. Summary of Biophysical Characteristics that Affect Wetland Ecological Services .......13Table 8. Impacts of human activities on ecological services <strong>in</strong> wetlands ...................................18Table 9. Selected valuation methods used to estimate the benefits of wetlands........................20Table 10. Data requirements, advantages, and disadvantages of non-market valuation methods............................................................................................................................................22Table 11. Selected non-market valuation studies and range of wetland ecosystem servicevalues..................................................................................................................................24Table 12. Average ecosystem service value estimates ..............................................................25Table 13. Wetland type and area with<strong>in</strong> the <strong>Credit</strong> <strong>River</strong> <strong>Watershed</strong> .........................................29The Pemb<strong>in</strong>a Institute • <strong>Credit</strong> Valley Conservation vi <strong>Valu<strong>in</strong>g</strong> Wetland Ecosystem Services (Phase I) • 2009
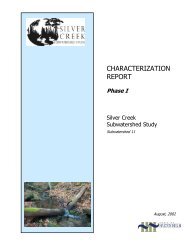
1. Introduction<strong>Wetlands</strong> are now recognized as the most productive natural areas <strong>in</strong> the world. 1 They areestimated to provide up to 40% of all ecosystem services worldwide, despite cover<strong>in</strong>g only 1.5%of the Earth’s surface. 2In spite of their significance, approximately 70% of Prairie and southern Ontario wetlands havebeen converted for alternative land uses s<strong>in</strong>ce European settlement. Agricultural reclamationrepresents 85% of Canada’s total wetland losses. 3 The <strong>Credit</strong> <strong>River</strong> Conservation Authorityestimates that approximately 75% of natural wetlands with<strong>in</strong> the <strong>Credit</strong> <strong>River</strong> watershed havebeen lost due to land use conversion. 4The south <strong>Credit</strong> <strong>River</strong> watershed’s relatively rapid shift from agricultural, pasture or forest landuse to an urban landscape is also creat<strong>in</strong>g issues related to surface and groundwater qualityand quantity, streamflow, erosion and wildlife habitat. 5 Effects of urbanization have <strong>in</strong>cluded<strong>in</strong>creased area of impervious soils, reduced amount of available wildlife habitat, decreasedsurface water <strong>in</strong>filtration and <strong>in</strong>creased soil erosion. <strong>Credit</strong> Valley Conservation (2005) alsonoted an overall decl<strong>in</strong>e <strong>in</strong> the amount of groundwater recharge dur<strong>in</strong>g the period from 2000 to2003. 6 Annual precipitation and streamflow decl<strong>in</strong>ed by approximately 7% and 17%,respectively, over the same time period. 7The <strong>Credit</strong> <strong>River</strong> receives treated wastewater effluent from four wastewater treatment facilitiesequipped with tertiary treatment. 8,9 Surface water <strong>in</strong> the <strong>Credit</strong> <strong>River</strong> consists of roughly 50%treated effluent <strong>in</strong> headwater areas. 10 Analysis of surface water quality data from 1995 to 2005revealed “good” to “fair” water quality <strong>in</strong> the <strong>Credit</strong> <strong>River</strong> and “marg<strong>in</strong>al” to “poor” water quality <strong>in</strong>its tributaries, due to decreased buffer<strong>in</strong>g capacity. 11 Communities of benthic <strong>in</strong>vertebrates atmonitor<strong>in</strong>g stations throughout the <strong>Credit</strong> <strong>River</strong> watershed were either “impaired” or “possiblyimpaired.” 12 These <strong>in</strong>vertebrates are used to <strong>in</strong>dicate ecosystem aquatic health. Monitor<strong>in</strong>g offish health completed at 36 field stations revealed 16 stations where health was “excellent” or“good,” 11 where health was “fair” and 10 where health was “poor.” 13This report details the 1 st of a 2-phase research project focused on valu<strong>in</strong>g wetland ecosystemservices <strong>in</strong> the <strong>Credit</strong> <strong>River</strong> <strong>Watershed</strong>, <strong>in</strong> Ontario. Below, we provide a summary of theliterature that has focused on: (i) identify<strong>in</strong>g/quantify<strong>in</strong>g wetland ecosystem services; (ii)assess<strong>in</strong>g the impact that human activities/actions have on these services; and (iii) estimat<strong>in</strong>gthe economic value provided by these services. We then determ<strong>in</strong>e the method that will beemployed <strong>in</strong> Phase 2 of this research that will assess the value of ecosystem services providedby the wetlands <strong>in</strong> the watershed.The specific approach taken <strong>in</strong> our review of the literature is to highlight the established l<strong>in</strong>ksthat exist between wetland ecological service <strong>in</strong>dicators and their associated <strong>in</strong>puts (i.e.,actions/activity <strong>in</strong>dicators that occur on the land base) and outcomes (i.e., economic value).Figure 1 illustrates these relationships.The Pemb<strong>in</strong>a Institute • <strong>Credit</strong> Valley Conservation 1 <strong>Valu<strong>in</strong>g</strong> Wetland Ecosystem Services (Phase I) • 2009
IntroductionInputs:Human Actions orActivitiesWetlandEcologicalServicesOutcomes:Economic ValueIndicatorsIndicatorsFigure 1. Approach taken <strong>in</strong> our summary of the literatureThe process of establish<strong>in</strong>g the l<strong>in</strong>ks <strong>in</strong> Figure 1 <strong>in</strong>volves the follow<strong>in</strong>g critical elements:Identification of key ecological services provided by wetlands (Example: Floodprotection - wetlands buffer outly<strong>in</strong>g areas from flood<strong>in</strong>g by slow<strong>in</strong>g and reta<strong>in</strong><strong>in</strong>g waterrun-off). Identification of <strong>in</strong>dicators that represent the key ecological services (Example:Frequency of flood events <strong>in</strong> the watershed). Assessment of current ecological service <strong>in</strong>dicator condition. This can be assessedquantitatively (Example: Flood<strong>in</strong>g events of 3 meters above peak water flow occur onceevery 5 years), or qualitatively (Example: Flood<strong>in</strong>g events occur often). Identification of the manner <strong>in</strong> which human actions/activities affect ecological service<strong>in</strong>dicators (Example: Establish<strong>in</strong>g forest cover on adjacent lands results <strong>in</strong> more regularand lower velocity water run-off which improve the wetlands ability to provide floodprotection). Identification of <strong>in</strong>dicators that represent the human actions/activities affect<strong>in</strong>g ecologicalservice <strong>in</strong>dicators (Example: Conversion of land-use from agriculture to forest with<strong>in</strong> 10hectares of the riparian area of the wetland). Assessment of the impact that the human action/activity <strong>in</strong>dicators have on wetlandecological service <strong>in</strong>dicators (Example: Conversion of agricultural land to forestlandwith<strong>in</strong> 10 hectares of the riparian area of the wetland causes flood<strong>in</strong>g events of 3 metersabove peak water flow to occur once <strong>in</strong> every 50 years <strong>in</strong>stead of ever 5 years). Assessment of the impact that the change <strong>in</strong> wetland ecological services have oneconomic values (Example: Reduc<strong>in</strong>g frequency of flood<strong>in</strong>g events from once every 5years to once every 50 years will cause a reduction <strong>in</strong> property damage of $1.5 million).Once the key ecological services, human actions, and economic value methods for wetlandanalysis are identified and l<strong>in</strong>ked, they will provide some <strong>in</strong>sight <strong>in</strong>to the required <strong>in</strong>puts andrange of outcomes that can be produced when valu<strong>in</strong>g wetlands.The Pemb<strong>in</strong>a Institute • <strong>Credit</strong> Valley Conservation 2 <strong>Valu<strong>in</strong>g</strong> Wetland Ecosystem Services (Phase I) • 2009
2. Identify<strong>in</strong>g WetlandEcological Services2.1 Types of <strong>Wetlands</strong>The Canadian Wetland Classification System (CWCS) categorizes wetlands <strong>in</strong>to classes basedon morphology and habitat characteristics 14 . The CWCS recognizes the follow<strong>in</strong>g five classes ofwetlands: (i) bogs; (ii) fens; (iii) swamps; (iv) marshes; and (v) shallow water. Table 1 describesthe characteristics of each wetland class.Table 1. Classification of Canadian wetlands(Source: Environment Canada, The Canadian Wetland Classification System 2009) 15Type of WetlandBogsFensSwampsMarshesDescriptionBogs are characterized by peat accumulation to a depth of 3-5 m. The water table islocated at or below the surface of the peat layer and is recharged by fog and snow.Consequently, bogs are low <strong>in</strong> m<strong>in</strong>erals. Bogs typically occur <strong>in</strong> polar and sub-arcticregions of northern Canada. They are commonly acidic (pH 4 to 4.8) due to thecreation of organic acids dur<strong>in</strong>g peat decomposition. Bogs can be treed or treeless,but are colonized by vegetation tolerant of humidity, acidity and nutrient-poorconditions. Flora may <strong>in</strong>clude wild flowers, such as orchids.Fens are also characterized by the presence of peat; however, they feature agreater number and diversity of marshy plants than bogs. The water table of a fenfluctuates at the surface; water seeps through the peat or flows through openchannels <strong>in</strong> the vegetation. The water table is fed by groundwater which hasleached through m<strong>in</strong>eral soil which release moderate amounts of nutrients <strong>in</strong>to thewater. The pH of fen water is site-specific but generally higher than that of bogs.Vegetation varies with water table depth and chemistry but commonly <strong>in</strong>cludesmoderately decomposed sedges, rushes, grasses and mosses. Shrubs or treesmay be present <strong>in</strong> drier areas. “Poor fens” have with low m<strong>in</strong>eral content <strong>in</strong> thewater table and are dom<strong>in</strong>ated by peat and shrubs; “rich fens” have higher m<strong>in</strong>eralcontent and are dom<strong>in</strong>ated by sedges and brown mosses.Swamps generally occur near rivers, lakes and other waterways and aredist<strong>in</strong>guished by the dom<strong>in</strong>ance of trees or tall shrubs. Swamps are drier thanmarshes and fens because of the presence of organic matter above the water table,but are likened to treed bogs. They may be permanently or seasonally flooded.Swamps can develop directly on m<strong>in</strong>eral soils or on peat. Swamps which developon top of sandy soils may develop a layer impermeable to water dra<strong>in</strong>age. Thereare three ma<strong>in</strong> types of swamps: shrub swamps, coniferous swamps and deciduousswamps. Mixed swamps show characteristics of more than one type of swamp.Swamps act as water reservoirs dur<strong>in</strong>g drought and are valued as habitat for adiversity of plant and wildlife species.Marshes are the most common wetlands <strong>in</strong> North America. They are wetter thanswamps and support fewer trees and tall shrubs. The fluctuat<strong>in</strong>g water table ofmarshes leads to periodic saturation by surface water. The root zone rema<strong>in</strong>s wetyear-round, except dur<strong>in</strong>g drought. Marshes may be permanent, semi-permanent orThe Pemb<strong>in</strong>a Institute • <strong>Credit</strong> Valley Conservation 3 <strong>Valu<strong>in</strong>g</strong> Wetland Ecosystem Services (Phase I) • 2009
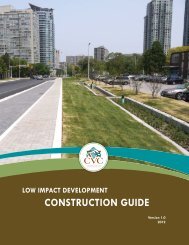
Identify<strong>in</strong>g Wetland Ecological ServicesShallow Watertemporary and can conta<strong>in</strong> fresh or sal<strong>in</strong>e water. The water table may be fed bylocal streams, precipitation, groundwater discharges and/or tidal action. Manyfreshwater marshes are alkal<strong>in</strong>e due to the presence of dissolved oxygen. Marshesoften consist of a mosaic of vegetation and mudflats, dom<strong>in</strong>ated by rushes, reeds,grasses and sedges, shrubs and other herbaceous species. Float<strong>in</strong>g-leaved andsubmergent plants, brown mosses and macroscopic algae may also be present.Marshes are a key source of food for wildlife.Shallow water wetlands occur <strong>in</strong> transitional areas between bogs, fens, marshes orswamps and waterbodies such as lakes. Nutrient and gas exchange, oxidation anddecomposition frequently occur <strong>in</strong> this type of wetland. Nutrient and m<strong>in</strong>eralcomposition are site-specific. Peat, organic and m<strong>in</strong>eral materials and marlaccumulate <strong>in</strong> slow-mov<strong>in</strong>g pools and provide a substrate for rooted, submergedand float<strong>in</strong>g vegetation and algae and aquatic mosses. Rooted emergentvegetation, such as trees, can occupy up to 1/4 total area, but are generallyrelegated to the periphery.Each of the wetland classes outl<strong>in</strong>ed <strong>in</strong> Table 1 provides a different set of EG&S for human use.Natural variation with<strong>in</strong> each wetland class will result <strong>in</strong> variations <strong>in</strong> EG&S provision even with<strong>in</strong>the classes themselves. More specifically, EG&S provision with<strong>in</strong> a wetland varies with anumber of biogeochemical factors such as season, temperature, precipitation, size, flow rate,flow volume, and many others. It is important to note that this study is based on general patternsof wetland function; accuracy and reliability of the results improve with data quality andavailability.2.2 Ecological Services Provided by <strong>Wetlands</strong>Ecosystem service valuation is often framed with<strong>in</strong> the concept of total economic value (TEV).In our context, TEV can be <strong>in</strong>terpreted as the total of all values derived from a wetland. Thisframework has been discussed extensively <strong>in</strong> the literature. 16,17 The TEV framework is illustrated<strong>in</strong> Figure 2.Figure 2. Total economic value framework for environmental valuation.Total Economic Value (TEV)Use valuesNon-use valuesDirect-use Indirect-use Option value Bequest value Existence valueAs Figure 2 depicts, the services afforded to society by ecosystems are categorized <strong>in</strong>to twoma<strong>in</strong> values: use values and non-use values. Use values reflect the benefits derived by humansfrom consum<strong>in</strong>g (either directly or <strong>in</strong>directly) or from the option of consum<strong>in</strong>g ecologicalservices. Non-use values, <strong>in</strong> contrast, are derived without consumption tak<strong>in</strong>g place. There arethree types of use values:The Pemb<strong>in</strong>a Institute • <strong>Credit</strong> Valley Conservation 4 <strong>Valu<strong>in</strong>g</strong> Wetland Ecosystem Services (Phase I) • 2009
Identify<strong>in</strong>g Wetland Ecological ServicesDirect use value – the value derived from the direct use of the ecosystem or resource,such as the value of water for dr<strong>in</strong>k<strong>in</strong>g.Indirect use value - the value derived from the <strong>in</strong>direct use of the ecosystem orresource, such as the value of a wetland <strong>in</strong> flood control. Option value - the value derived from preserv<strong>in</strong>g a use value of water today for theoption of us<strong>in</strong>g it <strong>in</strong> the future (e.g. preserv<strong>in</strong>g the flow of a stream today so that it maybe used <strong>in</strong> the future).The second component of TEV is non-use values. There are two types of non-use values 18(also referred to as <strong>in</strong>herent values):Bequest value - the satisfaction that <strong>in</strong>dividuals derive from the knowledge that water,at a particular supply or quality level, exists for future generations. Existence value - the satisfaction that <strong>in</strong>dividuals derive from the knowledge that water,at a particular supply or quality level, exists today even though they do not use it.Tables 2 to 5 provide a summary of the direct, <strong>in</strong>direct, option-use, and non-use ecologicalservice values that characterize wetlands. Each service is allocated to its particular economicvalue classification.Table 2. Summary of direct use values of wetlands 19EcologicalServiceRaw materialsRecreationInformationRange of ServicesFisheriesAgriculture ProductsHunt<strong>in</strong>g/ Fish<strong>in</strong>gBird watch<strong>in</strong>g/ Hik<strong>in</strong>gEducationTable 3. Summary of <strong>in</strong>direct use values of wetlandsEcologicalServiceNutrientRetentionRange of servicesPhosphorousattenuationNitrogen attenuationDescription<strong>Wetlands</strong> provide spawn<strong>in</strong>g and feed<strong>in</strong>g habitat for severalcommercial fish species <strong>in</strong> Canada. The <strong>Credit</strong> <strong>River</strong> alonehosts 45 fish species, <strong>in</strong>clud<strong>in</strong>g: brook, brown and ra<strong>in</strong>bowtrout; smallmouth and largemouth bass; northern pike andcarp.Agricultural uses for wetlands <strong>in</strong> Canada are generally limitedto cultivation of wild rice, cranberries and wild blueberries 20Agriculture has primarily focused on dra<strong>in</strong>age of wetlands foraccess to highly productive soils. Harvest<strong>in</strong>g of peat andhardwood also contribute hundreds of millions of dollars tothe Canadian economy each year 21Many wetlands provide known recreational benefits due totheir aesthetic qualities and high degree of biodiversity 22Due to their significant biodiversity, wetlands provide a uniqueopportunity for environmental education. The <strong>Credit</strong> ValleyConservation Authority runs educational programs throughoutthe year, with a focus on summer programs for youth.Description<strong>Wetlands</strong> play an important role <strong>in</strong> nitrogen, phosphorus andsulfur retention, particularly <strong>in</strong> agricultural areas. 23 Wetlandvegetation enhances microbial activity <strong>in</strong> soil and rootzones. 24 Plant matter, <strong>in</strong>clud<strong>in</strong>g root and leaf tissue,promotes growth of bacterial 'biofilms' which trap andmetabolize nutrients, such as nitrates and phosphates, andThe Pemb<strong>in</strong>a Institute • <strong>Credit</strong> Valley Conservation 5 <strong>Valu<strong>in</strong>g</strong> Wetland Ecosystem Services (Phase I) • 2009
Identify<strong>in</strong>g Wetland Ecological ServicesWaste treatmentFlood ControlGroundwaterRechargeClimateRegulationBiodiversityBiological controlPoll<strong>in</strong>ationPollution abatementWater RetentionErosion ControlGroundwaterRechargeCarbon StorageEvapo-transpirationPlant & Wildlifespecies diversityPest managementMa<strong>in</strong>ta<strong>in</strong><strong>in</strong>gpoll<strong>in</strong>at<strong>in</strong>g<strong>in</strong>vertebrate specieselevate dissolved oxygen levels. 25 Increased oxygenavailability enables more rapid decomposition of organicmatter, and further nutrient uptake, <strong>in</strong> wetlands than otherland uses.<strong>Wetlands</strong> improve water quality by trapp<strong>in</strong>g sediments,slow<strong>in</strong>g water flows and accumulat<strong>in</strong>g peat deposits.26Surface water is generally much cleaner after flow<strong>in</strong>gthrough a wetland. Wetland biophysical processes <strong>in</strong>clud<strong>in</strong>gdentrification, sedimentation and assimilation act to dim<strong>in</strong>ishnitrogen concentration <strong>in</strong> agricultural runoff.<strong>Wetlands</strong>, specifically floodpla<strong>in</strong> wetlands, often providecritical water storage dur<strong>in</strong>g extreme weather events,<strong>in</strong>clud<strong>in</strong>g both heavy ra<strong>in</strong>fall and drought. Peak flows arereduced and/or delayed by the presence of wetlands. Wateris released slowly by wetlands over a longer span of timethan other land uses. <strong>Wetlands</strong> thereby moderate waterbalance. In wetlands with high evapo-transpiration rates,downstream river flow may be significantly reduced dur<strong>in</strong>gdry periods. Evaporation from wetlands has been observedto be consistently higher than from non-wetland areas.Groundwater aquifers are often replenished throughwetlands, or vice versa. 27 However, wetlands which overlieimpermeable materials may have little or no <strong>in</strong>teraction withlocal groundwater aquifers. 28<strong>Wetlands</strong> play a key role <strong>in</strong> the global carbon cycle bysequester<strong>in</strong>g and releas<strong>in</strong>g significant amounts of carbon. 29Carbon is also stored <strong>in</strong> wetland sediments and carriedbetween ecosystems (i.e. from rivers to lakes) dur<strong>in</strong>g watermovement. 30<strong>Wetlands</strong> equalize the local climate, primarily throughmoderation of ra<strong>in</strong>fall and temperature. 31Protect native plant and wildlife species, provide habitat fornatural reproduction, and protect genetic diversity by act<strong>in</strong>gas gene banks.Natural biological control of pest populations and diseasesoccurs due to predation by other species with<strong>in</strong> wetlandhabitats. For example, young fish consume mosquito larvae,thereby controll<strong>in</strong>g the population of mosquitoes. Only ahealthy wetland ecosystem can support fish species, thusma<strong>in</strong>ta<strong>in</strong><strong>in</strong>g a healthy wetland ecosystem is essential tocontroll<strong>in</strong>g mosquito populations.<strong>Wetlands</strong> are critical habitat areas for poll<strong>in</strong>at<strong>in</strong>g species of<strong>in</strong>sects. Clean surface water is required for reproduction andearly survival of <strong>in</strong>vertebrate species. These <strong>in</strong>vertebratesbecome important poll<strong>in</strong>ators dur<strong>in</strong>g their adult phase.The Pemb<strong>in</strong>a Institute • <strong>Credit</strong> Valley Conservation 6 <strong>Valu<strong>in</strong>g</strong> Wetland Ecosystem Services (Phase I) • 2009
Identify<strong>in</strong>g Wetland Ecological ServicesTable 4. Summary of option values of wetlandsEcologicalServiceFutureValueFutureInformationValueUseRange of servicesFuture Direct UseFuture Indirect UseFuture EducationDescriptionAs long as wetlands are preserved, they offer future uses forhumans. <strong>Wetlands</strong> may be preserved to ensure that theirservices can be used <strong>in</strong> the future.Human knowledge of wetland values and characteristics is farfrom complete. By preserv<strong>in</strong>g wetlands, humans have theability to cont<strong>in</strong>ue learn<strong>in</strong>g about them and us<strong>in</strong>g them toteach others about their functions.Table 5. Summary of existence values of wetlandsEcologicalServiceBiodiversityProtectionCulturalAestheticsBequest valueDescriptionOne third of Canada’s Species At Risk rely on wetland habitat for survival. 32 InOntario alone, almost 90% of endangered species rely on wetlands for feed<strong>in</strong>g,reproduction or habitat. 33 This service will become <strong>in</strong>creas<strong>in</strong>gly important <strong>in</strong> thefuture.Wetland ecosystems figure prom<strong>in</strong>ently <strong>in</strong> our natural heritage. <strong>Wetlands</strong>’ lifesusta<strong>in</strong><strong>in</strong>gservices featured prom<strong>in</strong>ently <strong>in</strong> our ancestors’ survival and cont<strong>in</strong>ue toplay a vital role <strong>in</strong> our society. <strong>Wetlands</strong> also provide spiritual benefits by offer<strong>in</strong>g aplace of serenity and communion with nature.Canadian artists like Robert Bateman have depicted the aesthetic value of wetlands<strong>in</strong> numerous works of art. Indeed, entire Canadian art exhibits have been devoted tothe <strong>in</strong>spirational beauty of wetlands.Bequest value refers to the benefit humans derive from know<strong>in</strong>g that a wetlandresource is available for future generations. 34 Bequest values are similar to existencevalues, but are protected for future generations rather than peace of m<strong>in</strong>d <strong>in</strong> thepresent.Note that multiple wetland values often coexist. These values may be complimentary, and<strong>in</strong>crease similarly with alterations to biophysical wetland components. For example, a wetlandwith high biodiversity protection value may have high recreation value (i.e. to birdwatchers). Aswetland structural heterogeneity <strong>in</strong>creases, both biodiversity protection value and recreationvalue may <strong>in</strong>crease similarly.However, some wetland values may have an <strong>in</strong>verse relationship. For example, a wetland whichhas high nutrient retention value may have low biodiversity protection value. By act<strong>in</strong>g toimprove the nutrient retention value of the wetland, it is possible that the biodiversity protectionvalue may be negatively impacted.For this reason, it is necessary to prioritize wetland values when develop<strong>in</strong>g a managementstrategy. CVC will need to identify the values on which they wish to focus their conservationand/or restoration efforts <strong>in</strong> order to ensure that high priority values are ma<strong>in</strong>ta<strong>in</strong>ed orenhanced.The Pemb<strong>in</strong>a Institute • <strong>Credit</strong> Valley Conservation 7 <strong>Valu<strong>in</strong>g</strong> Wetland Ecosystem Services (Phase I) • 2009
3. BiophysicalCharacteristics ofWetland EcologicalServicesThe Millennium Ecosystem Assessment (2005) states that hydrological regime (flow rate,volume, and water velocity) and topography (size, aspect and shape) are often the mostimportant factors affect<strong>in</strong>g provision of wetland services. 35 Physicochemical conditions makeservices of each type of wetland unique. Hydrological conditions <strong>in</strong>fluence numerous abioticfactors, <strong>in</strong>clud<strong>in</strong>g nutrient availability, soil anerobiosis and sal<strong>in</strong>ity <strong>in</strong> both coastal and <strong>in</strong>landwetlands. 36 These factors determ<strong>in</strong>e the types of ecological communities present <strong>in</strong> a givenwetland. Ecological communities, <strong>in</strong> turn, <strong>in</strong>fluence wetland hydrology and physicochemicalcharacteristics.What is most clear is that past practices of land use, <strong>in</strong>clud<strong>in</strong>g wetland conversion to agricultureand urban use, has been the most pert<strong>in</strong>ent action that has degraded the function<strong>in</strong>g ofwetlands and subsequently the provision of wetland ecological services.3.1 Biophysical FunctionsTo assess the factors that <strong>in</strong>fluence a wetland’s ability to provide key ecological services, weconducted a review of biophysical studies focused on wetlands and environmental impacts. Theliterature review revealed six key biophysical wetland services which can be broadly categorizedas follows: (i) waste treatment; (ii) biodiversity; (iii) climate regulation; (iv) flood control; (v)recreation benefits; and (vi) aesthetic benefits. The follow<strong>in</strong>g describes each service <strong>in</strong> moredetail.3.1.1 Waste TreatmentZedler (2003) states that conserv<strong>in</strong>g downstream wetlands, where water quality is dim<strong>in</strong>isheddue to pollutant load<strong>in</strong>g, can maximize treatment benefits and has been observed to reducenitrate concentrations by up to 80%. 37L.-A. Hansson et. al. (2005) found a positive relationship between wetland depth andphosphorus retention and a negative relationship between phosphorus retention and wetlandsurface area. 38 They postulated that this was likely due to re-suspension of phosphate-boundsediment particles by the action of w<strong>in</strong>d <strong>in</strong> shallow wetlands with greater surface area. 39 Theyreported that wetlands designed to encourage phosphorus should be small and deep topromote particle sedimentation and that wetlands designed to encourage nitrogen retentionshould be constructed to have a larger surface area. 40 The researchers proposed that, <strong>in</strong> orderto balance these oppos<strong>in</strong>g design features and provide nitrate- and phosphate-removal benefits,large wetlands should be designed to feature both deep and shallow areas. Incorporat<strong>in</strong>gThe Pemb<strong>in</strong>a Institute • <strong>Credit</strong> Valley Conservation 8 <strong>Valu<strong>in</strong>g</strong> Wetland Ecosystem Services (Phase I) • 2009
Biophysical Characteristics of Wetland Ecological Servicesislands or gravel bars <strong>in</strong>to wetland design can promote growth of emergent and riparianvegetation to reduce w<strong>in</strong>d effects and flow speed. 41Moreno-Mateos et. al. (2008) <strong>in</strong>dicated that the ability of wetlands to improve water quality isrelated to a variety of parameters <strong>in</strong>clud<strong>in</strong>g, but not limited to: Vegetation cover or type; depth;water retention time; soil type; particle size; and regional climate. 42 They also determ<strong>in</strong>ed thatwetlands should occupy least 2.83% of agricultural catchments <strong>in</strong> order to ma<strong>in</strong>ta<strong>in</strong> good waterquality <strong>in</strong> areas with highly sal<strong>in</strong>e soils. 43 Specifically, wetlands characterized by densevegetation and flat bottoms were favoured to promote denitrification. 44 Zedler (2003) reports thata wetland’s capacity for denitrification is related to the amount of nitrogen <strong>in</strong> <strong>in</strong>flow<strong>in</strong>g water,water flow rate, the amount of solid organic matter, residence time and the availability of plantsurface area for proliferation of nitrogen-fix<strong>in</strong>g bacteria. 45 The effect of dilution <strong>in</strong> large wetlandsto <strong>in</strong>crease water quality was also noted, as was the benefit of protect<strong>in</strong>g several “scattered andnumerous wetlands”, as opposed to a few and large wetland complexes, <strong>in</strong> order to <strong>in</strong>creaselandscape complexity (patch density and heterogeneity). This was found to reduce the amountof total dissolved solids <strong>in</strong> surface water. 46 Zedler <strong>in</strong>dicates that wetlands <strong>in</strong> agriculturalwatersheds with areas as little as 1% of the total watershed area can effectively removenutrients. 47 <strong>Wetlands</strong> have been reported to remove approximately 77% of total nitrogen <strong>in</strong>surface <strong>in</strong>flows. 48The spatial arrangement of pollution sources and s<strong>in</strong>ks have a significant impact on the ability ofwetlands to act as a pollution s<strong>in</strong>k. 49 They report that the ability to mitigate the impacts of po<strong>in</strong>tand non-po<strong>in</strong>t source pollution <strong>in</strong>clud<strong>in</strong>g agricultural run-off, pesticides, fertilizers, oil, metals(e.g. copper, nickel, cadmium, z<strong>in</strong>c and lead) and polycyclic aromatic hydrocarbons issignificantly reduced the sources cover a land area exceed<strong>in</strong>g 65% of the watershed. 50Further, <strong>in</strong> order for wetlands to have an impact on overall watershed hydrology, they mustoccupy at least 2%–7% of the total watershed area. 513.1.2 BiodiversityThe term “biodiversity” encompasses three types of diversity: genetic diversity, species diversityand ecosystem diversity. 52 Genetic diversity is the genetic variability between <strong>in</strong>dividuals of thesame species. Species diversity refers to the number of different species with<strong>in</strong> an area.Ecosystem diversity encompasses the variety of habitats, communities and ecologicalprocesses with<strong>in</strong> an area.Increased genetic diversity creates <strong>in</strong>creased resilience of wildlife populations <strong>in</strong> the face ofhabitat changes or disease. For example, <strong>in</strong>creased genetic diversity can be what enablessome members of a wildlife population to survive an outbreak of disease, because some<strong>in</strong>dividuals are genetically resistant to its effects. Genetic variability can also reduce or mask theeffects of harmful genetic mutations.Increased species and ecosystem diversity lead to greater wildlife protection by ensur<strong>in</strong>g that agreater number of species can make use of an area. For example, if only three plant speciesare present <strong>in</strong> a given wetland, then only wildlife species that can consume those three plantspecies will be able to make use of that wetland for food. If, on the other hand, 23 plant speciesare present <strong>in</strong> another wetland, then a greater number of wildlife species will be able to use thewetland because that wetland provides a more diverse food source.Unfortunately, wetlands which effectively remove significant amounts of nutrients and sedimentsare not necessarily high-quality wildlife habitats because they are more likely to developmonocultures of hardy, nutrient-lov<strong>in</strong>g plant species such as cattails (Typha sp.). 53 Zedler(2003) reports that large wetlands are more valuable for preserv<strong>in</strong>g avian biodiversity thansmaller wetlands, especially when they are located next to large tracts of upland habitat;The Pemb<strong>in</strong>a Institute • <strong>Credit</strong> Valley Conservation 9 <strong>Valu<strong>in</strong>g</strong> Wetland Ecosystem Services (Phase I) • 2009
Biophysical Characteristics of Wetland Ecological Serviceshowever, biodiversity may be equalled <strong>in</strong> small wetlands with significant structural diversity,canopy layer<strong>in</strong>g or productivity. 54 Conversely, smaller wetland areas may act as refugia for rareplant species. 55 Zedler refers to the Nature Conservancy’s guidel<strong>in</strong>e that 15-25% of an areamust be conserved <strong>in</strong> order to protect biodiversity. 56 Further, the follow<strong>in</strong>g attributescharacterize ecosystem function<strong>in</strong>g relative to wetland biodiversity:Habitat connectivity and structural diversity are significant factors required to enhancebiodiversity. 57Periodic natural disturbance with<strong>in</strong> a normal disturbance pattern due to events such asflood<strong>in</strong>g is also required to ma<strong>in</strong>ta<strong>in</strong> biodiversity. 58 Fragments of natural habitats provide the best opportunity to stimulate biodiversity. 59 Restored wetlands commonly fail <strong>in</strong> the areas of water balance, revegetation, wildliferejection of habitat and <strong>in</strong>troduction of <strong>in</strong>vasive species, exacerbat<strong>in</strong>g vegetationdamage. 60Biophysical factors which impact species biodiversity vary with regional species compositionand the type of species us<strong>in</strong>g the wetland. With respect to duck populations, wetland value isrelated to availability, depth, temperature, quality and presence of open water; presence orabsence of vegetation; type and growth patterns (patchy vs. open) of vegetation; waterchemistry; soil type; and geographic or topographic location. 61 Colder surface waters may notbe hospitable to some duck species, whereas warmer surface water may not permit growth offood for ducks. Presence of some duck species which use trees for food or nest<strong>in</strong>g may be<strong>in</strong>fluenced by tree cover. 62 Nutrient load<strong>in</strong>g <strong>in</strong> wetlands often leads to <strong>in</strong>creased algal bloom,decreased <strong>in</strong>vertebrate populations, and subsequent decreases <strong>in</strong> duck populations.3.1.3 Climate RegulationS<strong>in</strong>ce uptake of carbon dioxide is required for plant growth, climate regulation is commonlyestimated <strong>in</strong> terms of total biomass with<strong>in</strong> a wetland. Carbon comprises roughly 50% of plantbiomass. Therefore, carbon storage is proportionate to the amount of plant biomass, which canbe calculated as the density of plant vegetation multiplied by wetland area and depth ofaccumulated decay<strong>in</strong>g vegetation or peat.Net Primary Production of wetlands, calculated as the amount of carbon stored <strong>in</strong> plantbiomass, is estimated to be 1,300 g C/m 2 per year for North American wetlands. 63 As well,submergent, float<strong>in</strong>g and emergent vegetation <strong>in</strong> freshwater marshes are estimated tosequester 1-1,000 g C/m 2 , 10-2,067 g C/m 2 and 155-6,180 g C/m 2 per year for North Americanwetlands, respectively. 64 This vegetative matter shifts to the detrital and soil carbon pools asvegetation senesces and decomposes.Table 6 outl<strong>in</strong>es the Ontario M<strong>in</strong>istry of Natural Resources (2003) estimates of carbon storage <strong>in</strong>Ontario’s wetlands.The Pemb<strong>in</strong>a Institute • <strong>Credit</strong> Valley Conservation 10 <strong>Valu<strong>in</strong>g</strong> Wetland Ecosystem Services (Phase I) • 2009
Biophysical Characteristics of Wetland Ecological ServicesTable 6 Estimates of carbon storage <strong>in</strong> <strong>Ontario's</strong> wetlands. 65Wetland Class Total Area (ha) Stored Carbon (g C)Bog 15,865 x 10 3 17.6 x 10 15 1.1 x 10 9Fen 9,961 x 10 3 11.0 x 10 15 1.8 x 10 9Swamp 307 x 10 3 3.4 x 10 15 57.3 x 10 9Marsh 209 x 10 3 2.3 x 10 15 84.2 x 10 9Open Water 178 x 10 3 2.0 x 10 15 98.9 x 10 91 Calculation based on total carbon divided by total area per wetland class.Carbon Storage perUnit Area (g C/ha) 13.1.4 Flood Control<strong>Credit</strong> Valley Conservation (2006) cites Governments of Canada and Ontario data which<strong>in</strong>dicates that wetlands must occupy at least 10% of a watershed <strong>in</strong> order to provide floodprotection. 66 Only 6% of the <strong>Credit</strong> Valley watershed is currently occupied by wetlands. 67Zedler (2003) touts the benefits of small wetlands located high <strong>in</strong> a watershed to dim<strong>in</strong>ish floodvolume and delay peak flows as well as the benefits of large wetlands located downstream forreduc<strong>in</strong>g total peak flow volume. 68 Flood mitigation also depends on each wetland’s <strong>in</strong>dividualevapo-transpiration and <strong>in</strong>filtration rates and residence time. 693.1.5 Recreation BenefitsRecreational users of wetlands frequent these areas for a variety of reasons, of which fish<strong>in</strong>g,hik<strong>in</strong>g and birdwatch<strong>in</strong>g are common. Manuel (2003) reported that recreational benefits arecommonly closely l<strong>in</strong>ked with the presence and characteristics of wetland wildlife. 70 S<strong>in</strong>ce fishand wildlife are <strong>in</strong>volved <strong>in</strong> two of these uses, it stands to reason that biodiversity is a key factor<strong>in</strong>fluenc<strong>in</strong>g wetland recreational use. A wetland’s recreational value is <strong>in</strong>fluenced by factorssuch as the condition of fish and wildlife habitat, water quality, abundance of fish populations,upland game hunt<strong>in</strong>g prospects, biodiversity, and perceived “wilderness” 71 . Recreational usersmust also be able to access the site, so <strong>in</strong>frastructure (e.g. roads) <strong>in</strong> the vic<strong>in</strong>ity is a factor<strong>in</strong>fluenc<strong>in</strong>g recreational use.3.1.6 Aesthetic BenefitsAesthetic qualities (or viewscapes) can vary substantially from one <strong>in</strong>dividual to another.Wetland aesthetics are typically associated with residential landowners who may derive somebenefit from view<strong>in</strong>g the wetland. Presence of open water, wetland shape and total wetlandsurface area are known to <strong>in</strong>fluence aesthetics. Manuel (2003) described a positive relationshipbetween aesthetic value and factors such as openness, wildness, habitat diversity, andperceptions of oddness or mystery. 72 Species diversity with<strong>in</strong> wetlands is associated withaesthetic appeal; resale value of residential properties is correlated with plant and wildlifediversity. 73 The Wiscons<strong>in</strong> Department of Natural Resources (2008) recognizes wetlandsThe Pemb<strong>in</strong>a Institute • <strong>Credit</strong> Valley Conservation 11 <strong>Valu<strong>in</strong>g</strong> Wetland Ecosystem Services (Phase I) • 2009
Biophysical Characteristics of Wetland Ecological Serviceslocated with<strong>in</strong> or near urban sett<strong>in</strong>gs as be<strong>in</strong>g particularly valuable for the aesthetic andeducational services. Open water, diverse vegetation, and lack of pollution also contribute to thevalue of specific wetlands for recreational and educational purposes and general quality of life.3.1.7 Summary of Biophysical Functions of <strong>Wetlands</strong>Table 7 provides a summary of the biophysical functions of wetlands.The Pemb<strong>in</strong>a Institute • <strong>Credit</strong> Valley Conservation 12 <strong>Valu<strong>in</strong>g</strong> Wetland Ecosystem Services (Phase I) • 2009
Biophysical Characteristics of Wetland Ecological ServicesTable 7. Summary of Biophysical Characteristics that Affect Wetland Ecological ServicesEcological service (ES) Indicator of Service Biophysical Factors that <strong>in</strong>fluence ES CommentsWaste TreatmentNO 3 - concentration <strong>in</strong>wetland outflow Organic matter content of wetland 74 ; Cont<strong>in</strong>uity of wetland saturation 75 Retention time 76 Wetland area 77 Shorel<strong>in</strong>e complexity 78 Inflow nitrogen concentration 79 Hydraulic load<strong>in</strong>g 80 Wetland shape 81 Macrophyte cover and biodiversity 82 Plant surface area 83 Cont<strong>in</strong>uous saturation is required for nitrogenattenuation Large amounts of organic matter are needed fornitrate ions to b<strong>in</strong>d Longer retention time improves nitrateattenuation – water should be permitted to<strong>in</strong>filtrate soils Wetland area has a positive relationship withnitrogen attenuation Shorel<strong>in</strong>e complexity has a negative relationshipwith nitrogen retention dur<strong>in</strong>g summer High macrophyte cover and biodiversity hasbeen shown to improve nutrient attenuation 84 Plant surface area is required for microbialgrowth and subsequent nutrient attenuationPO 4-3concentration <strong>in</strong>wetland outflow Rate of absorption to soil and organicmatter 85 Rate of uptake by macrophytes andmicrobes 86 Species richness 87 Dissolved oxygen 88 Water temperature 89 Wetland depth Plant surface area 90 Retention time 91 Increased amounts of organic matter providemore surface area for ions to sorb Macrophytes and microbes remove phosphateions from sorbed sites and metabolize them 92 Low dissolved oxygen and high temperatureshave been l<strong>in</strong>ked to phosphate release fromsediments 93 Deeper wetlands have been shown to reta<strong>in</strong>more phosphorus 94 Plant surface area is required for microbialgrowth and subsequent nutrient attenuation Longer retention time encourages greaterprecipitation of sediment- or particle-bound ionsThe Pemb<strong>in</strong>a Institute • <strong>Credit</strong> Valley Conservation 13 <strong>Valu<strong>in</strong>g</strong> Wetland Ecosystem Services (Phase I) • 2009
Biophysical Characteristics of Wetland Ecological ServicesTotal E.coli (ppm) Infiltration 95 Retention time 96 Predation by microbes andmacrophytes 97 Wetland surface area 98 Plant surface area Longer retention time encourages greaterprecipitation of sediment- or particle-boundbacteria Larger microbes or macrophytes consumebacteria Increased surface area enables <strong>in</strong>activation ofbacteria by UV light Greater plant surface area provides moreopportunity for bacteria to sorbBiodiversityNative Species richness Shorel<strong>in</strong>e complexity 99 Wetland surface area 100 Wetland maturity 101 Nutrient <strong>in</strong>flow 102 Proximity to roads 103 Density of forest cover 104 Diversity of plant cover 105 Presence of open water 106 Large, undeveloped tracts of land 107 Shorel<strong>in</strong>e complexity and surface area have apositive relationship with species richness At least four years are required to reachmaximum benthic species biodiversity;biodiversity of larger wildlife species takeslonger to develop 108 High nutrient concentrations <strong>in</strong> <strong>in</strong>flow have beenshown to decrease biodiversity Negative correlation between density of roadson adjacent lands and species richness Strong positive correlation between forestdensity on adjacent lands and species richnessClimate Regulation Total carbon stored (t C) Wetland area (ha) Peat depth Rate of growth of biomass Amount of carbon stored is directly proportionalto wetland area and peat depth 109 Carbon storage is positively related to growth ofplant biomass 110Flood controlWater storage capacity(m 3 ) Soil pore space Soil organic material Saturated water content Natural water content Water is stored <strong>in</strong> soil pores; more porous soilwill store more water Soil organic matter <strong>in</strong>creases soil pore space Flood mitigation potential is equal to thedifference between saturated water content andThe Pemb<strong>in</strong>a Institute • <strong>Credit</strong> Valley Conservation 14 <strong>Valu<strong>in</strong>g</strong> Wetland Ecosystem Services (Phase I) • 2009
Biophysical Characteristics of Wetland Ecological Services Soil bulk densitynatural water content Soil thickness Wetland area Water density Return period The equation relat<strong>in</strong>g these factors is available<strong>in</strong> M<strong>in</strong>g et. al. Flood protection is more effective for floods withshorter return periods (i.e. 25 years) 111 Cont<strong>in</strong>uity of wetland saturation 112 Organic matter content of wetland 113 Retention time 114 Wetland area 115 Recreational uses of wetlands <strong>in</strong>clude hik<strong>in</strong>g,fish<strong>in</strong>g, hunt<strong>in</strong>g and birdwatch<strong>in</strong>g These recreational uses are strongly tied tobiodiversityRecreation benefitsNumber of recreationalvisitors/year Shorel<strong>in</strong>e complexity 116 Inflow nitrogen concentration 117 Hydraulic load<strong>in</strong>g 118 Wetland shape 119 Macrophyte cover and biodiversity 120 Plant surface area 121Aesthetic benefitsNumber of residentialproperties with wetlandview Same as above (for recreationbenefits). Aesthetic value is generally captured throughrevealed preference approach (hedonic pric<strong>in</strong>gand travel cost method) and stated preference(cont<strong>in</strong>gent valuation and choice model<strong>in</strong>g). In either approach, most studies <strong>in</strong>herentlyassume that natural and man-made wetlandswill factor positively <strong>in</strong> people’s preferencesThe Pemb<strong>in</strong>a Institute • <strong>Credit</strong> Valley Conservation 15 <strong>Valu<strong>in</strong>g</strong> Wetland Ecosystem Services (Phase I) • 2009
Biophysical Characteristics of Wetland Ecological Services3.2 L<strong>in</strong>k<strong>in</strong>g Wetland Services and Human ActivitiesSevere anthropogenic disturbance of an aquatic ecosystem may lead to an abrupt and possiblyvery substantial disruption <strong>in</strong> the supply of one or more ecological services. 122This break can be caused by a variety of human activities, <strong>in</strong>clud<strong>in</strong>g nutrient load<strong>in</strong>g or land useconversion. A literature review of anthropogenic impacts on wetland function revealed that theseimpacts can be broadly categorized as follows: Pollution Land Use Change Climate Change Vegetation CompositionIn this section the focus is on actions related to wetlands that currently exist. Further, what weare seek<strong>in</strong>g to determ<strong>in</strong>e are the human actions that are currently <strong>in</strong>fluenc<strong>in</strong>g the provision ofecological services from <strong>in</strong>tact wetlands.3.2.1 Impacts of Pollution on <strong>Wetlands</strong>Pollution is one of the lead<strong>in</strong>g factors that <strong>in</strong>fluence the ability of wetlands to perform ecosystemfunctions. Kennedy and Mayer (2002) cite that a critical threshold for phosphorus load<strong>in</strong>g is 1mg P/m 2 /year for North American wetlands. 123 Above this threshold, uptake and removal ofnutrients by wetland plants is severely impeded. Excessive phosphorus load<strong>in</strong>g is known tocause colonization of waterways by algae and other aquatic plants, lead<strong>in</strong>g to eutrophication,depleted dissolved oxygen and subsequent impairment of a variety of ecological services.Moreno-Mateos et. al. stated that the spatial arrangement of pollution sources and s<strong>in</strong>ks have asignificant impact on the ability of wetlands to act as a pollution s<strong>in</strong>k. 124 They report that theability to mitigate the impacts of po<strong>in</strong>t and non-po<strong>in</strong>t source pollution <strong>in</strong>clud<strong>in</strong>g agricultural runoff,pesticides, fertilizers, oil, metals (e.g. copper, nickel, cadmium, z<strong>in</strong>c and lead) and polycyclicaromatic hydrocarbons is significantly reduced when the sources cover a land area exceed<strong>in</strong>g65% of the watershed. 1253.2.2 Impacts of Land Use Change on <strong>Wetlands</strong>Anthropogenic disturbance of the biophysical structures present <strong>in</strong> wetlands negatively impactsbiophysical function. The magnitude of the impact is related to the extent and duration of thedisturbance. For example, when a wetland is dra<strong>in</strong>ed for agriculture, the damage is extensiveand long-term. Wetland ecosystem functions are replaced by ecosystem functions of the newland use (e.g. agricultural).Land clear<strong>in</strong>g and result<strong>in</strong>g sedimentation can <strong>in</strong>crease turbidity and biological oxygen demandand impede wetland function. Currently, the Conservation Authorities Act mandates a 120 mbuffer around wetlands to prevent impact to ecological function; however, exemptions can bemade for agricultural or other land uses. 126The impacts of surround<strong>in</strong>g land-use conversion on wetland function are difficult to predict.Brauman et. al. (2007) reported that <strong>in</strong> general, impacts to hydrologic processes with<strong>in</strong>watersheds are not measurable until at least 20% of land area has been altered; however,noticeable impacts have first appeared <strong>in</strong> watersheds with as little as 15% or as much as 50%conversion. 127 Brauman et. al. also suggest that <strong>in</strong> order for wetlands to have an impact onoverall watershed hydrology, they must occupy at least 2%–7% of the total watershed area. 128The Pemb<strong>in</strong>a Institute • <strong>Credit</strong> Valley Conservation 16 <strong>Valu<strong>in</strong>g</strong> Wetland Ecosystem Services (Phase I) • 2009
Biophysical Characteristics of Wetland Ecological ServicesKennedy & Mayer (2002) referenced a previous study which identified a negative correlationbetween the density of paved roads with<strong>in</strong> 2 km of a wetland and species richness of all taxaexcept mammals. 129 Dams and other man-made developments can also impact wetlandfunction by reduc<strong>in</strong>g <strong>in</strong>flows, reduc<strong>in</strong>g water volume and <strong>in</strong>hibit<strong>in</strong>g periodic flood<strong>in</strong>g. 130 Zedler(2003) postulates that when more than 80-90% of a watershed’s natural wetlands have beendra<strong>in</strong>ed, the risk of flood<strong>in</strong>g and eutrophication of local water bodies <strong>in</strong>creases significantly. 1313.2.3 Climate Change Impacts on <strong>Wetlands</strong>Climate change will also impact wetland function by reduc<strong>in</strong>g the water table <strong>in</strong> dry areas,lead<strong>in</strong>g to <strong>in</strong>creased carbon dioxide production, lower methane fluxes and lower dissolvedoxygen fluxes. 132 Methane is a much more potent and harmful greenhouse gas than carbondioxide. <strong>Wetlands</strong> currently balance methane production with carbon dioxide storage toneutralize climate impacts. 133 This balance is likely to shift towards greater methane release andlower carbon dioxide storage as a result of climate change. Evidence of climate change hasbeen consistently recorded at meteorological stations with<strong>in</strong> the <strong>Credit</strong> Valley watershed overthe past 30 years. Annual temperature <strong>in</strong>creases have ranged from 0.03°C to 0.09°C. 134Natural Resources Canada (2008) predicts the follow<strong>in</strong>g impacts to ecosystems <strong>in</strong> Ontario’sGreat Lakes Region due to climate change: 135Introduction and proliferation of algae and <strong>in</strong>vasive species due to warmer conditions;Impacts to commercial and recreational fisheries due to changes <strong>in</strong> water temperature(e.g., disappearance of cool- and cold-water fish species, such as lake trout); andReduced water levels <strong>in</strong> Great Lakes coastal wetlands, lead<strong>in</strong>g to shorel<strong>in</strong>edestabilization and reduction of biodiversity <strong>in</strong> historical migratory stag<strong>in</strong>g areas.3.2.4 Vegetation Composition Impacts on <strong>Wetlands</strong>Invasion of exotic species can alter ecosystem function when native wetland plants are replacedby <strong>in</strong>vasive sedges, grasses or rushes. 136 One example is the <strong>in</strong>troduction and subsequentproliferation of purple loosestrife (Lythrum salicaria) which displaces native wetland plants <strong>in</strong><strong>Southern</strong> Ontario.Un<strong>in</strong>tentional <strong>in</strong>troduction of exotic or <strong>in</strong>vasive species by recreational users can also havesignificant negative impacts on wetland function. Seeds can be carried <strong>in</strong>to a wetland area <strong>in</strong>mud stuck to shoes, bicycles or recreational vehicles. Once <strong>in</strong>troduced, these species can takedisplace native vegetation, creat<strong>in</strong>g monocultures or coloniz<strong>in</strong>g waterways.Despite good <strong>in</strong>tentions, wetland restoration efforts can also have negative impacts on wetlandvegetation composition. Restored wetlands commonly fail <strong>in</strong> the areas of water balance,revegetation, wildlife rejection of habitat and <strong>in</strong>troduction of <strong>in</strong>vasive species, lead<strong>in</strong>g to furthervegetation damage. 1373.2.5 Summary of Human Impacts on <strong>Wetlands</strong>Table 8 summarizes the human impacts on wetland ecological services.The Pemb<strong>in</strong>a Institute • <strong>Credit</strong> Valley Conservation 17 <strong>Valu<strong>in</strong>g</strong> Wetland Ecosystem Services (Phase I) • 2009
Biophysical Characteristics of Wetland Ecological ServicesTable 8. Impacts of human activities on ecological services <strong>in</strong> wetlands. aEcological Service Service Indicator Action/Activity Activity Indicator DescriptionWaste Treatment/WaterpurificationNitrate concentration(ppm)Phosphorousconcentration (ppm)Total choliforms(ppm)Heavy metalsPCBsFertilizer runoff fromadjacent land useFertilizer runoff fromadjacent land useDomestic runoff fromuse of soaps andfertilizersLivestock waste runofffrom adjacent land useRunoff of pet fecesfrom domestic animals(e.g. dogs)Industrial spills orrunoff from adjacentland useIndustrial spills orrunoff from adjacentland useRate of nitrate load<strong>in</strong>g (ppm) fromapplication of fertilizer <strong>in</strong> adjacentagriculture operationsRate of phosphorus load<strong>in</strong>g(ppm) from adjacent agricultureoperationsRate of choliform load<strong>in</strong>g fromlivestock waste (ppm) fromadjacent agriculture operations.Rate of metals load<strong>in</strong>g from<strong>in</strong>dustrial sourcesRate of PCB load<strong>in</strong>g from<strong>in</strong>dustrial sourcesRate of load<strong>in</strong>g by fecalcholiformsUse of fertilizers foragriculture, domestic runoffand the runoff of feces fromdomestic sources andlivestock operations can<strong>in</strong>troduce excess levels ofnitrates, phosphorous andcholiforms (e.g. E. coli).Runoff of heavy metals andPCBs from <strong>in</strong>dustrial sourcescan pollute waters and lead tobioaccumulation and wildlifemortality.Flood controlWater storage(m 3 /ha)Increase/decrease <strong>in</strong>wetland riparian bufferon adjacent landPercentage wetland riparianbuffer <strong>in</strong> riparian buffersConvert<strong>in</strong>g forest cover toagriculture or developed landresults <strong>in</strong> a decrease <strong>in</strong> waterstorage capacity and <strong>in</strong>crease<strong>in</strong> velocity of surface runoffenter<strong>in</strong>g wetlands. This thatcan overwhelm the wetlands’ability to prevent flood<strong>in</strong>g.BiodiversityNatural speciesrichness (species/ha)Climate changeRate of ext<strong>in</strong>ction due to climatechange (number of species)As climate change occursmore rapidly than somespecies can adapt, thosespecies will face ext<strong>in</strong>ction.The Pemb<strong>in</strong>a Institute • <strong>Credit</strong> Valley Conservation 18 <strong>Valu<strong>in</strong>g</strong> Wetland Ecosystem Services (Phase I) • 2009
Biophysical Characteristics of Wetland Ecological ServicesClimate RegulationRecreation benefitsAesthetic benefitsCarbon stored(tonnes/ha)Number of recreationvisits per yearNumber (and/orproximity) ofresidential propertieswith a view of thewetland.Increase/decrease <strong>in</strong>exotic/native speciespopulationsIncrease/decrease <strong>in</strong>biomass of wetlandvegetationFacilities (treed trails,boardwalks, look-outs,swimm<strong>in</strong>g access, etc)that exist.Percentage of openwater <strong>in</strong> the wetlandPole-ward migration of species(km/decade). 138Change <strong>in</strong> proportion of exoticplant species (for fibre oraesthetics).Percentage vegetation cover (bytype) <strong>in</strong> wetlandKm of trails created, # of lookoutsbuilt, budget for areama<strong>in</strong>tenance and new facilities,etc.Increase wetland health anddecrease colonization by weedyvegetationAs soil temperatures becomeprogressively warmer, plantrange expansion (due tomicro-site climatic variation)will result <strong>in</strong> traditional speciesbe<strong>in</strong>g overtaken by southernneighbour<strong>in</strong>g species.Due to eng<strong>in</strong>eered or naturaladvantages, <strong>in</strong>troduced outcompetesome native species.Convert<strong>in</strong>g wetlands to otherland uses will result <strong>in</strong> therelease of soil and peat carbondue to decomposition ofvegetation and reducedcarbon sequestration <strong>in</strong> plantbiomass.Increas<strong>in</strong>g the quality of therecreational resource (e.g. byadd<strong>in</strong>g new trails or improv<strong>in</strong>gexist<strong>in</strong>g ones) will lead to<strong>in</strong>creased use of the resourceThe cost of residentialproperties will be greater nearwetlands with a greaterpercentage of open watera Some human activities can affect more than one service. For <strong>in</strong>stance, wetland riparian buffer changes will affect not only flood<strong>in</strong>g services, but also biodiversity,waste treatment, etc. Also the size of the wetland (i.e., loss or creation) will affect this bundle of services as well. In this respect, some actions directed towardpositively enhanc<strong>in</strong>g wetland services could be undertaken to enhance not just one, but many services, result<strong>in</strong>g <strong>in</strong> a bundl<strong>in</strong>g effect.The Pemb<strong>in</strong>a Institute • <strong>Credit</strong> Valley Conservation 19 <strong>Valu<strong>in</strong>g</strong> Wetland Ecosystem Services (Phase I) • 2009
4. Wetland Valuation4.1 Wetland valuation methodsThere are a large number of methods that can be used to value ecological services. Seven ofthese have been typically used by researchers <strong>in</strong> the context of valu<strong>in</strong>g wetlands, and <strong>in</strong>clude:(i) the production function method; (ii) expenditure-based methods; (iii) the travel cost method;(iv) the hedonic price method; (v) the cont<strong>in</strong>gent valuation method; (vi) the choice experimentmethod; and (vii) the benefits transfer method. Table 9 provides an overview of these methods.Table 9. Selected valuation methods used to estimate the benefits of wetlandsValuation MethodProduction functionmethod (PFM)Expenditure-basedmethods (EBM)Hedonic PriceMethod (HPM)Travel cost method(TCM)Cont<strong>in</strong>gent valuationmethod (CVM)Choice experimentmethod (CE)Benefits transfermethod (BT)Description<strong>Wetlands</strong> are treated as <strong>in</strong>puts <strong>in</strong>to theproduction of services. Changes <strong>in</strong> wetlandcharacteristics affect productivity, and impact thevalue of these services<strong>Wetlands</strong> are treated as a provider of ecosystemservices that can be ma<strong>in</strong>ta<strong>in</strong>ed, replaced, orsubstituted-for through <strong>in</strong>creased expenditures.<strong>Wetlands</strong> are treated as a factor <strong>in</strong>fluenc<strong>in</strong>g thecharacteristics of residential properties to <strong>in</strong>fer aWTP for the property.<strong>Wetlands</strong> are treated as a factor <strong>in</strong>fluenc<strong>in</strong>g thenumber of trips made by recreationists toparticular sites and the costs of those trips to<strong>in</strong>fer a WTP for the site.<strong>Wetlands</strong> are treated as a commodity <strong>in</strong> ahypothetical market and households are directlyasked how much they are will<strong>in</strong>g to pay for animprovement <strong>in</strong> the commodity.<strong>Wetlands</strong> are treated as hav<strong>in</strong>g a number ofenvironmental attributes and households aredirectly asked to make choices among alternativehypothetical projects hav<strong>in</strong>g differentimprovements <strong>in</strong> attribute levels.<strong>Wetlands</strong> are assumed to have similar valuesacross sites, and benefit estimates from one ormore previous study sites are transferred to thepolicy site of <strong>in</strong>terest. Benefits can be based on<strong>in</strong>dividual value, average value, or function(meta-analysis) transfers.Ecosystem Service ValuesConsideredDirect-use and <strong>in</strong>direct-use:fisheries, ground waterrechargeDirect and <strong>in</strong>direct-use: wastetreatment, nutrient retention,water retention, groundwaterrecharge, erosion control,climate regulationDirect and <strong>in</strong>direct-use:aesthetics; flood control,ground water rechargeDirect-use: Recreationservices like hunt<strong>in</strong>g/fish<strong>in</strong>g,bird watch<strong>in</strong>g, hik<strong>in</strong>gDirect, <strong>in</strong>direct, and non-use:Aggregate value of bundledservices (focus on non-use)Direct, <strong>in</strong>direct, and non-use:Individual value for eachservice (focus on non-use)Direct, <strong>in</strong>direct, and non-use:Individual value for eachserviceThe Pemb<strong>in</strong>a Institute • <strong>Credit</strong> Valley Conservation 20 <strong>Valu<strong>in</strong>g</strong> Wetland Ecosystem Services (Phase I) • 2009
Wetland ValuationAs shown <strong>in</strong> Table 9, a number of non-market valuation methods tend to focus on direct and<strong>in</strong>direct-use values (i.e., PFM, EBM, HPM, TCM). Of these methods, some focus further onparticular user-groups (i.e., HPM focuses on residential landowner values, and TCM focuses onrecreationist values). Other methods (i.e., CVM, CE, BT) tend to assess a wider array of values.4.2 Data requirements, advantages and disadvantages ofnon-market valuation methodsEach non-market valuation method has a unique set of data collection and statistical analysisrequirements. These are summarized <strong>in</strong> Table 10, along with some advantages anddisadvantages associated with each method.As shown <strong>in</strong> Table 10, all methods require the collection of both biophysical and economic data.The level or degree to which the biophysical data must be ref<strong>in</strong>ed, however, ranges betweenand even with<strong>in</strong> methods. For example, while the EBM typically requires researchers to def<strong>in</strong>equantitative wetland <strong>in</strong>dicators (e.g., nitrate absorption (ppm)) to establish the absorptionrequired by a restored or substitute process, the CVM and CE methods allows researchers todef<strong>in</strong>e wetland <strong>in</strong>dicators either quantitatively (e.g., nitrate absorption (ppm)) or qualitatively(e.g., low, medium, or high water quality) to help develop a hypothetical wetland improvementprogram. Obviously, the more precise the <strong>in</strong>dicator measures are, the easier it is to: (i) establishthe specific manner <strong>in</strong> which wetland improvements can be facilitated on the ground; and (ii)compare the benefits of the improvements with the costs of specific improvement projects.With regard to economic data collection, Table 10 reveals that a number of non-marketvaluation methods use market prices to help elicit a value for wetlands (i.e., PFM, EBM, HPM),and as such tend to be less controversial than other methods that do not. However, asmentioned previously, these methods do not capture the full benefits of wetlands s<strong>in</strong>ce they donot account for all the values and/or groups <strong>in</strong> society. This would tend to cause a downwardbias <strong>in</strong> the valuation procedures. On the other hand, for the EBM <strong>in</strong> particular, the approachmay not even <strong>in</strong>corporate social values if valuation is based on the cost of replacement orsubstitution, and may tend to cause an upward bias <strong>in</strong> that valuation procedure.Those methods that do attempt to capture the full social benefits of wetlands (i.e., CVM, CE,BT) are often the ones that do not use market prices, specifically because they <strong>in</strong>corporate nonusevalues for which there are no market prices to refer to.The Pemb<strong>in</strong>a Institute • <strong>Credit</strong> Valley Conservation 21 <strong>Valu<strong>in</strong>g</strong> Wetland Ecosystem Services (Phase I) • 2009
Wetland ValuationTable 10. Data requirements, advantages, and disadvantages of non-market valuation methodsValuationMethodProductionfunctionmethod (PFM)Expenditurebasedmethods(EBM)Hedonic PriceMethod (HPM)Travel costmethod (TCM)Data requirements and statistical analysis Collect data on biophysical characteristics(<strong>in</strong>clud<strong>in</strong>g wetland characteristics such as nutrientretention, groundwater recharge) affect<strong>in</strong>g theproduction of an ecological good/service that hasa price <strong>in</strong> the market. Use regression analysis to estimate how a change<strong>in</strong> a wetland characteristic affects the productivityof the good/service. Estimate the total value of the change <strong>in</strong> thegood/service us<strong>in</strong>g market prices. Collect data on the ecological services providedby a wetland (e.g., waste treatment, nutrientretention, flood control). Estimate the market expenditures required to: (i)ma<strong>in</strong>ta<strong>in</strong> services <strong>in</strong> exist<strong>in</strong>g wetland (i.e., avoideddamage cost method); (ii) replace/restoredegraded services <strong>in</strong> exist<strong>in</strong>g wetland (i.e.,replacement cost method), or (iii) substitute-for thelost services us<strong>in</strong>g the next best alternativeprocess (i.e., substitute cost method). Use the <strong>in</strong>creased expenditures as anapproximate value of the wetland. Collect data on residential property sale pricesalong with structural, neighborhood, and wetlandcharacteristics (e.g., proximity to site, waterfiltration, flood control) adjacent to each property. Use regression analysis to estimate how a change<strong>in</strong> a characteristic affects sale price of a property. Aggregate to all properties affected to estimate thechange <strong>in</strong> total aesthetic benefits from a change <strong>in</strong>the wetland characteristic. Survey visitors to two or more wetland sites,ask<strong>in</strong>g them about their region of orig<strong>in</strong>, mode oftransportation, duration of stay, etc. Collect data on biophysical characteristics of eachwetland (e.g. water filtration, nutrient retention,public access, boardwalks). Use regression analysis to estimate how a change<strong>in</strong> travel costs affects the number of visits to eachsite (i.e., establish a demand curve for each site). Then estimate how a change <strong>in</strong> a wetlandcharacteristic affects that demand curve for aparticular policy site and the total recreationbenefits generated.Advantages/Disadvantages The use of market pricesmakes this method lesscontroversial than others. Focuses only on one director <strong>in</strong>direct value service ata time (not total benefit). Difficult to establish aquantitative l<strong>in</strong>k betweenwetlands and productivity. The use of market pricesmakes this method lesscontroversial than others. Focuses only on one director <strong>in</strong>direct value service ata time (not total benefit). Does not estimate a truemeasure of social benefits<strong>in</strong>ce we cannot tell if the<strong>in</strong>creased expenditure ismore or less than the socialvalue of the service. The use of market pricesmakes this method lesscontroversial than others. Focuses only on propertyowner benefits from the site(not total benefit). Data for property price andstructural/neighborhoodcharacteristics may not beavailable. Data collection viasurvey<strong>in</strong>g visitors may besubject to bias. Focuses only onrecreationist benefits fromthe site (not total benefit).The Pemb<strong>in</strong>a Institute • <strong>Credit</strong> Valley Conservation 22 <strong>Valu<strong>in</strong>g</strong> Wetland Ecosystem Services (Phase I) • 2009
Wetland ValuationCont<strong>in</strong>gentvaluationmethod (CVM)Choiceexperimentmethod (CE)Benefitstransfermethod (BT) Select a number of important wetlandcharacteristics to value (e.g., waste treatment,flood control, biodiversity, aesthetics), quantify orqualify exist<strong>in</strong>g levels, and design a hypotheticalprogram that would improve these characteristicsto specific levels. Survey households and ask them to state theirmaximum WTP for the program. Use regression analysis to exam<strong>in</strong>e the data forpotential bias (protest responses, etc), andestimate an average household will<strong>in</strong>gness-to-payvalue for the bundled services from the sample. Apply the average value to the population affectedto estimate total benefits of wetland improvement. Select a number of important wetland attributes tovalue (e.g., nutrient retention, flood control,biodiversity, aesthetics), quantify or qualifyexist<strong>in</strong>g levels, and assign each two or moreimprovement levels. Design a set of programs with unique levels ofwetland attributes and costs to implement. Thenuse a survey to ask households to choosebetween programs <strong>in</strong> a repeated pair-wisefashion. Use regression analysis to exam<strong>in</strong>e the data forconstruct validity (i.e., potential bias from protestresponses, etc), and estimate an averagehousehold will<strong>in</strong>gness-to-pay value for eachattribute and level from the sample. Apply the average value for each attribute to thepopulation affected to estimate total benefit of thespecific improvement <strong>in</strong> each attribute. Individual value transfers: the WTP value for apolicy site is approximated us<strong>in</strong>g a value produced<strong>in</strong> previous study for another study site. Average value transfers: the WTP value for apolicy site is approximated us<strong>in</strong>g a group averagevalue of previous studies for other study sites. Benefit function (meta-analysis) transfers: theWTP value for a policy site is approximated byus<strong>in</strong>g a large number of previous study sites alongwith regression analysis to establish the factorsthat affect the WTP value (via a function), andthen apply<strong>in</strong>g the characteristics of the policy site<strong>in</strong>to the function. Data collection may sufferfrom hypothetical bias, etc. One of the few valuationtechniques that canestimate non-use values(as part of a total value of abundled set of services). Data collection may sufferfrom hypothetical bias, etc. One of the few valuationtechniques that canestimate non-use values. Has two advantages overCVM: (i) can estimate<strong>in</strong>dividual ecosystemservice values; and (ii)respondents are givenchoices (i.e., choose aprogram with a cost) thatbetter reflect decisionmak<strong>in</strong>g<strong>in</strong> the real world. <strong>Wetlands</strong> tend to have sitespecificcharacteristics thatdiffer significantly from onesite to the next. Theliterature <strong>in</strong>dicates thatoften a large transfer biasemerges when us<strong>in</strong>g thismethod. 139 Primary valuation (sitespecific)studies arepreferred over this method.The Pemb<strong>in</strong>a Institute • <strong>Credit</strong> Valley Conservation 23 <strong>Valu<strong>in</strong>g</strong> Wetland Ecosystem Services (Phase I) • 2009
Wetland Valuation4.3 Non-market valuation studies and range of wetland valueestimatesThere have been well over 200 published, primary wetland valuation studies conducted over thepast 30 years. These studies have produced a wide array of values, depend<strong>in</strong>g largely on thelocation, estimation method, ecosystem services considered, and unit of value assessed. Table11 provides a selection of these studies and their f<strong>in</strong>d<strong>in</strong>gs. A list of references for the studies<strong>in</strong>cluded <strong>in</strong> this table can be found <strong>in</strong> Appendix A.Table 11. Selected non-market valuation studies and range of wetland ecosystem service valuesValuationMethodProductionfunction method(PFM)Expenditurebasedmethods(EBM)Hedonic PriceMethod (HPM)Studies aEcosystem servicesconsideredRange of Estimated ValuesBell (1997); Freeman (1991) Fisheries $0.10 to $135.44 (1969-93$US) per hectare per yearKazmierczak (2001);Chichilnisky and Heal (1998)Breaux et al. (1995)K<strong>in</strong>g and Bohlen (1994)Lupi et al (1991); Mahan etal. (2000)Water filtration (substitutecost method)Wastewater treatment(replacement cost method)Bundled services(replacement cost method)Aesthetics, flood control,ground water recharge$1.15 to $1,087.67 (1996-01$US) per hectare per year$2,522 to $3,899 (1992 $US)per hectare per year$4,000 to $124,000 (1997$US) per acre$19 (1989 $US) to $24 (1994$US) per hectare per yearvan Vuuren and Roy (1993) Hunt<strong>in</strong>g and fish<strong>in</strong>g $271 to $2,952 (1989 $CDN)Travel costper hectare per yearmethod (TCM) Cooper and Loomis (1991) Waterfowl hunt<strong>in</strong>g $55.41 (1989 $US) perhunter per season.Hammitt et al. (2001) Wetland preservation $21 to $65 (1993 $US) perperson per yearCont<strong>in</strong>gentvaluationmethod (CVM) Pate and Loomis (1997) Salmon fish<strong>in</strong>g and waterqualityChoiceexperimentmethod (CE)Birol et al. (2006)Carlsson et. al. (2003)BiodiversityOpen water surface areaResearch & educationRe-tra<strong>in</strong><strong>in</strong>g of localsProvide walk<strong>in</strong>g tracks and<strong>in</strong>formation signsa See the Appendix for the list of references <strong>in</strong> this table.$27.52 to $87 (1989 $US) perhectare per year€ 7.7 to €15.62 (2006) perperson per year€ 8.45 to €11.02 (2006) perperson per year€ 3.9 to €10.79 (2006) perperson per year€ 0.12 to € 0.15 (2006) perperson per yearBiodiversity $504.58-$673.72 (2002$SEK) per personHabitat for fish$348.48 (2002 $SEK) perperson$648.06 (2002 $SEK) perpersonThe Pemb<strong>in</strong>a Institute • <strong>Credit</strong> Valley Conservation 24 <strong>Valu<strong>in</strong>g</strong> Wetland Ecosystem Services (Phase I) • 2009
Wetland ValuationA number of researchers have surveyed the literature on non-market valuation estimates ofwetland ecological services. 140,141,142,143,144 Of these, Brander et al. (2006) provides the most <strong>in</strong>depthand recent survey, cover<strong>in</strong>g over 190 non-market and market wetland valuation studies(with 215 value observations) around the world. Approximately one half of the studies coveredwere conducted <strong>in</strong> North America (111 observations), over one half were for fresh watermarshes (124 observations), and just over one half used production function/market pricemethods (110 observations). Table 12 provides a summary of the average wetland ecosystemservice value estimates reported.Table 12. Average ecosystem service value estimates(converted to 1995 $US per hectare per year), as reported by Brander et al. (2006) aEcosystem service# of valueobservationsMedianvalueMeanvalueWildlife habitat 67 $85 $3,000Recreational hunt<strong>in</strong>g 50 $70 $2,500Amenity 48 $65 $8,500Recreational fish<strong>in</strong>g 36 $55 $3,500Raw Materials 32 $50 $450Water quality 25 $45 $8,500Flood protection 26 $40 $5,500Water supply 18 $30 $2,000Fuelwood 18 $30 $80Biodiversity 13 $20 $11,500aEstimates are rounded (to the nearest $5 for median values, and the nearest $10/$50/$100 for mean values depend<strong>in</strong>g on the unitof measure) s<strong>in</strong>ce actual estimates reported by Brander et al. (2006) were presented only <strong>in</strong> a graphical format (i.e., a bar chart).Table 12 reveals a large variance between median and mean value estimates, <strong>in</strong>dicat<strong>in</strong>g thatthe distribution of values is skewed with a long tail of higher-end values. Brander et al. (2006)emphasize the mean and median values of wetland ecosystem values vary considerably bycont<strong>in</strong>ent, wetland type, and valuation method used. For <strong>in</strong>stance, average wetland values arehighest: (i) <strong>in</strong> Europe and North America; (ii) <strong>in</strong> unvegetated sediment and fresh water wetlands;and (iii) us<strong>in</strong>g the CVM, HPM, and EBM (specifically replacement cost) methods. 145 Also ofimportance were the socio-economic characteristics of the population surround<strong>in</strong>g the wetlandsunder consideration. Specifically, there was: (i) a positive relationship found between per capita<strong>in</strong>come of the relevant population and the estimated wetland value per hectare per year; and (ii)a positive relationship found between population density and the estimated wetland value perhectare per year. F<strong>in</strong>ally, the size of the wetland was found to be negatively related to the valueper hectare per year, <strong>in</strong>dicat<strong>in</strong>g a perceived scarcity premium with smaller wetlands.Overall, Brander et al. (2006) urges caution <strong>in</strong> us<strong>in</strong>g the results of previous literature for benefitstransfer, particularly <strong>in</strong> the case where policy site characteristics are not well represented <strong>in</strong> theunderly<strong>in</strong>g valuation studies.The Pemb<strong>in</strong>a Institute • <strong>Credit</strong> Valley Conservation 25 <strong>Valu<strong>in</strong>g</strong> Wetland Ecosystem Services (Phase I) • 2009
Wetland Valuation4.4 Questions to consider when choos<strong>in</strong>g among valuationmethodsAs discussed previously, wetlands provide a wide range of ecosystem service benefits tosociety. Economists have developed a wide range of methods that can be used to quantifythese benefits <strong>in</strong> monetary terms. Each method has its dist<strong>in</strong>ct advantages and disadvantages.The applicability of each method depends on a number of factors:1. What is the desired wetland service(s) to be valued?a. An <strong>in</strong>dividual service?b. A series of key <strong>in</strong>dividual services?c. A bundle of services?2. What is the desired type of value to be considered?a. A direct-use value?b. An <strong>in</strong>direct-use value?c. A non-use value?d. Some group<strong>in</strong>g of values?3. What data is available (or can be collected given budget constra<strong>in</strong>ts)?a. Biophysical data? What are the current levels of ecosystem service <strong>in</strong>dicators(quantitative or qualitative measures)? How are <strong>in</strong>dicators expected to change <strong>in</strong>the future (current trends)?b. Economic data? What is known about the value of services produced? Anyservices (or products) traded <strong>in</strong> the market?4. What are the policy scenarios (human actions/activities) under consideration?a. Are there specific actions/activities def<strong>in</strong>ed? If so, what are the expected impactsof the actions/activities on the ecological services considered?Once the above questions have been answered, it will narrow down the choice of valuationmethod that best applies to the case at hand.The Pemb<strong>in</strong>a Institute • <strong>Credit</strong> Valley Conservation 26 <strong>Valu<strong>in</strong>g</strong> Wetland Ecosystem Services (Phase I) • 2009
5. Research Plan for Phase 2After extensive discussions with CVC research team members, the research objectives, priorities,basel<strong>in</strong>e data availability, and the policy scenario for Phase 2 were elicited. Based on this <strong>in</strong>formation,two applied research approaches are outl<strong>in</strong>ed. One of these approaches will be selected <strong>in</strong>consultation with the project management committee to proceed. The follow<strong>in</strong>g summarizes thecomponents of the research plan.5.1 Research objectives:The general objectives of the CVC Wetland Valuation Project are to:1. Provide primary valuation data from the <strong>Credit</strong> <strong>River</strong> <strong>Watershed</strong> and demonstrate howvaluation <strong>in</strong>formation can and should be used <strong>in</strong> decision-mak<strong>in</strong>g (i.e. to education and buildawareness on the use of environmental valuation).2. Provide <strong>in</strong>sight <strong>in</strong>to benefits associated with CVC’s wetland restoration strategy <strong>in</strong> such a waythat the valuation can aid decision mak<strong>in</strong>g <strong>in</strong> regards to carry<strong>in</strong>g out the restoration strategy.Concern<strong>in</strong>g Objective 1, it is important to emphasize that economic valuation is ultimately concernedwith the allocation of resources to improve human welfare. With this <strong>in</strong> m<strong>in</strong>d, the contexts <strong>in</strong> which thevaluation of wetland services can provide useful or necessary <strong>in</strong>formation are:Inform<strong>in</strong>g policy decisions <strong>in</strong> which trade-offs are be<strong>in</strong>g considered between compet<strong>in</strong>galternatives (e.g., consider<strong>in</strong>g a policy that <strong>in</strong>volves choos<strong>in</strong>g the provision of one ecosystemservice, such as biodiversity, over another, such as agricultural output)Provid<strong>in</strong>g damage estimates as a result of pollution or other negative environmental impactsIt was agreed upon that the first context above (i.e., <strong>in</strong>form<strong>in</strong>g policy decisions <strong>in</strong> which trade-offs arebe<strong>in</strong>g considered) was most relevant to the current research project, s<strong>in</strong>ce, as identified <strong>in</strong> Objective 2,the CVC is most <strong>in</strong>terested <strong>in</strong> valu<strong>in</strong>g services associated with their wetland restoration strategy.5.2 Priority wetland services to be valued:The top priority wetland services to be valued <strong>in</strong>clude: (i) water quality improvements (e.g.,phosphorous, nitrogen, choliform, heavy metals, and PCBs); (ii) flood control improvement (e.g., waterstorage); (iii) biodiversity improvements (e.g., flora, fauna); (iv) recreational improvements (e.g.,recreational fish<strong>in</strong>g, bird watch<strong>in</strong>g, hik<strong>in</strong>g) and (v) carbon sequestration. These services can be valuedas a bundle. However, it is important to also consider the feasibility of identify<strong>in</strong>g <strong>in</strong>dividual values foreach.5.3 Basel<strong>in</strong>e data availability:In terms of bio-physical data collected to-date, CVC has been monitor<strong>in</strong>g wetland conditions <strong>in</strong> thewatershed s<strong>in</strong>ce 2005 as part of their <strong>in</strong>tegrated watershed monitor<strong>in</strong>g program. The data collected forthe wetland component of this program is designed to answer the question “Is the health of wetlandsdeteriorat<strong>in</strong>g <strong>in</strong> the <strong>Credit</strong> <strong>Watershed</strong>?” and “Have trends <strong>in</strong> wetland health <strong>in</strong>dicators changed beyondnormal variation (from basel<strong>in</strong>e conditions) to signal a decl<strong>in</strong>e <strong>in</strong> ecosystem health?” In order toanswer these questions, four wetland <strong>in</strong>dicators are measured on a regular basis at 19 monitor<strong>in</strong>gplots throughout the watershed, <strong>in</strong>clud<strong>in</strong>g:The Pemb<strong>in</strong>a Institute • <strong>Credit</strong> Valley Conservation 27 <strong>Valu<strong>in</strong>g</strong> Wetland Ecosystem Services (Phase I) • 2009
Research Plan for Phase 2- Woody vegetation: species present (tree, shrub, woody v<strong>in</strong>e), and percent cover- Ground vegetation: species present (forb, grass, sedge, rush, fern, herbaceous v<strong>in</strong>e), and percentcover- Floristic quality: Floristic Quality Index (FQI) based on data from woody and ground vegetation,and Mean Wetness Index- Amphibians (frogs and toads): frog Species, and call level codeThe data collected to date is still be<strong>in</strong>g processed but as an example, the top 5 most commonregenerat<strong>in</strong>g species for all wetland sites for 2008 were:Red-osier DogwoodSpeckled AlderAmerican ElmChokecherryCommon BuckthornNarrow-leaved Meadow-sweetWild Black Currant67211514141414In addition to these community and species scale <strong>in</strong>dicators, the follow<strong>in</strong>g landscape scale <strong>in</strong>dicatorsare also measured:5.3.1 Wetland land cover area<strong>Wetlands</strong> comprise 6% of the total land cover <strong>in</strong> the <strong>Credit</strong> <strong>River</strong> <strong>Watershed</strong>, which is belowEnvironment Canada guidel<strong>in</strong>es recommend<strong>in</strong>g greater than 10% of a watershed be wetland habitat.The vast majority of wetlands are swamps, represent<strong>in</strong>g 81% of all wetlands, 18% are marshes andthe rema<strong>in</strong><strong>in</strong>g 1% are bogs. The upper and middle portions of the watershed conta<strong>in</strong> similar wetlandcovers of 9% and 8% respectively; the lower watershed has the least wetland cover at 1% of regionalarea. The wetlands of the watershed, specifically <strong>in</strong> the upper and middle portions, exist primarily aswetland complexes 2 .2Wetland complexes are a group of wetlands that function as a unit <strong>in</strong> both biological and hydrological processes; impacts on <strong>in</strong>dividualwetlands affect the entire complex (Ontario Wetland Evaluation System 1993).The Pemb<strong>in</strong>a Institute • <strong>Credit</strong> Valley Conservation 28 <strong>Valu<strong>in</strong>g</strong> Wetland Ecosystem Services (Phase I) • 2009
Research Plan for Phase 2Table 13. Wetland type and area with<strong>in</strong> the <strong>Credit</strong> <strong>River</strong> <strong>Watershed</strong>Wetland TypeExist<strong>in</strong>g Area (<strong>in</strong> ha)Bogs 4SwampsShrub Swamps 827Coniferous Swamps 1,774Deciduous Swamps 1,352Mixed Swamps 878Marshes 1,061Total 5,896Figure 3. Land use types with<strong>in</strong> the <strong>Credit</strong> <strong>River</strong> <strong>Watershed</strong>.The Pemb<strong>in</strong>a Institute • <strong>Credit</strong> Valley Conservation 29 <strong>Valu<strong>in</strong>g</strong> Wetland Ecosystem Services (Phase I) • 2009
Research Plan for Phase 25.3.2 Size and distribution<strong>Wetlands</strong> <strong>in</strong> the watershed tend to be small and overall there is a lack of relatively larger wetlands. Ofthe 1075 wetlands, the majority are less than 4 ha <strong>in</strong> size, with the mean and median size be<strong>in</strong>g 5 haand 1.4 ha, respectively. Only one wetland <strong>in</strong> the watershed is greater than 200 ha.5.3.3 Distance between habitatsWetland to wetlandOn average a wetland is134 m away from the next nearest wetland, with half the wetlands less than50m apart and a maximum distance of 4km between wetlands. <strong>Wetlands</strong> lands <strong>in</strong> the upperwatershed were <strong>in</strong> closer proximity to each other wetlands <strong>in</strong> the middle and lower watershed.The mean distance between wetlands <strong>in</strong> comb<strong>in</strong>ation with observed spatial distribution reveals thatwetlands are also spatially clustered <strong>in</strong> localized areas <strong>in</strong> the <strong>Credit</strong> watershed. This cluster<strong>in</strong>g isprimarily due of physiography of the landscape (eg: mora<strong>in</strong>es or melt water channels) form<strong>in</strong>g largeprov<strong>in</strong>cially significant wetland complexes that are protected from development.Wetland to forestForests are on average 314m away from wetlands <strong>in</strong> the watershed, with half of the wetlands lessthan 22m away from a forest and a maximum distance of 4.2km between a forest and wetland. Forestwetland proximity is critical to wildlife species that require both habitats for different parts of their lifecycle.Wetland to successional<strong>Wetlands</strong> are on average 43m from Successional communities, with half of the wetlands adjacent toSuccessional communities, and a maximum distance of 920m between a wetland and Successionalcommunity.5.3.4 Land cover surround<strong>in</strong>g wetlandsAs shown <strong>in</strong> Figure 4, with<strong>in</strong> a 2km radius, wetlands are primarily adjacent to agriculture (39%),followed by Successional communities (20%).The Pemb<strong>in</strong>a Institute • <strong>Credit</strong> Valley Conservation 30 <strong>Valu<strong>in</strong>g</strong> Wetland Ecosystem Services (Phase I) • 2009
Research Plan for Phase 2Figure 4. Land cover surround<strong>in</strong>g wetlands <strong>in</strong> the <strong>Credit</strong> watershedThese results suggest the majority of wetlands are not situated with<strong>in</strong> natural landscapes and areadjacent to land-uses which generally impose negative edge effects or barriers. However, forests andagricultural land can offer ecological functions for wildlife movement. <strong>Wetlands</strong> were surrounded byless urban development than forests, primarily because <strong>in</strong> highly urbanized areas, such as the lowerwatershed, there are very few wetlands rema<strong>in</strong><strong>in</strong>g. Agriculture and successional communities werethe dom<strong>in</strong>ant land cover surround<strong>in</strong>g wetlands.5.3.5 Exist<strong>in</strong>g Data Relat<strong>in</strong>g to Wetland Ecosystem ServicesGenerally speak<strong>in</strong>g CVC collects extensive amounts of biophysical data for various purposes. Mak<strong>in</strong>guse of this data for the purposes of valu<strong>in</strong>g wetland restoration will be difficult and likely limited tohelp<strong>in</strong>g describe the current state of biophysical conditions of watershed. Mak<strong>in</strong>g concrete l<strong>in</strong>ksbetween the existence of wetlands and provision of ecological services will not be possible withoutextensive monitor<strong>in</strong>g designed to specifically measure such l<strong>in</strong>kages. However, exist<strong>in</strong>g <strong>in</strong>formationwas briefly surveyed with<strong>in</strong> the context of a key ecological wetland services.- Flood protectiono CVC has identified 22 flood damage centres throughout the watershedo Exist<strong>in</strong>g hydrologic modell<strong>in</strong>g has forecasted that peak flow rates at the damage centreswould <strong>in</strong>crease under anticipated future land use conditionso Correlat<strong>in</strong>g changes <strong>in</strong> wetland area (result<strong>in</strong>g from wetland restoration) would requirefurther hydrologic modell<strong>in</strong>g.o Monetary damages for each flood damage centre have been assessed by flood returnperiod based on flood depth – damage cost curves- Provision of biodiversityo Measures of wetland biodiversity do exist, as mentioned above. The measures aredesigned to answer the follow<strong>in</strong>g questions:• Is the species richness of native woody plants <strong>in</strong> wetlands chang<strong>in</strong>g?• Is the species richness of exotic woody plants <strong>in</strong> wetlands chang<strong>in</strong>g?• Is the species richness of native ground vegetation <strong>in</strong> wetlands chang<strong>in</strong>g?• Is the species richness of exotic ground vegetation <strong>in</strong> wetlands chang<strong>in</strong>g?• Is the proportion of sites occupied by each from species chang<strong>in</strong>g?The Pemb<strong>in</strong>a Institute • <strong>Credit</strong> Valley Conservation 31 <strong>Valu<strong>in</strong>g</strong> Wetland Ecosystem Services (Phase I) • 2009
Research Plan for Phase 2o These measures provide an <strong>in</strong>dication of changes <strong>in</strong> wetland biodiversity at the specificwetland plots- Improved water qualityo Biophysical data collected (not specific to wetlands) <strong>in</strong>clude phosphorous, nitrogen,choliform, heavy metals, PCBs, and water storage.o Mak<strong>in</strong>g statistical l<strong>in</strong>ks between this data and the quantity of wetlands acrosssubwatershed is be<strong>in</strong>g considered. However, such <strong>in</strong>formation will not be available untilwell <strong>in</strong>to 2010.- Recreationo There has been little socio-economic data collected by CVC to monitor public use of thewatershed/wetlands for recreational fish<strong>in</strong>g, bird watch<strong>in</strong>g, hik<strong>in</strong>g, etc.o Rough estimates of recreational fish<strong>in</strong>g exist for the watershed as a whole (an estimated30,154 angler days per year). Data of wetlands specific usage does not exist.5.4 The policy scenario to consider:In 2005, together with Toronto and Region Conservation, CVC commissioned Gartner Lee Limited(GLL) to identify potential areas suitable for wetland restoration throughout their comb<strong>in</strong>ed jurisdiction(CVC and TRCA): “Identification of Sites for Wetland Creation <strong>in</strong> the TRCA and CVCA” The areaswere identified us<strong>in</strong>g conceptual and spatial modell<strong>in</strong>g and analysis us<strong>in</strong>g geographic <strong>in</strong>formationsystem software. The models considered exist<strong>in</strong>g land use, topography, surficial geology, elevation ofthe water table, and proximity to exist<strong>in</strong>g dra<strong>in</strong>age features. This exercise identified 244 potentialrestoration areas cover<strong>in</strong>g a total of 1733 ha of land (or about 1% of the watershed). If all areas wererestored this would represent a 30% <strong>in</strong>crease over exist<strong>in</strong>g wetlands. The largest area identified wasnearly 230 ha <strong>in</strong> size and spans numerous land parcels each with a different land owner. Coord<strong>in</strong>at<strong>in</strong>gthis scale of wetland restoration across multiple properties highlights just some of the difficulties <strong>in</strong>implementation.The study by GLL was conducted at a landscape scale predicated by the scale of data available foruse <strong>in</strong> the model. The purpose of the study was not to specifically identify wetland restoration sites butto exam<strong>in</strong>e landscape level opportunities from which CVC could drill down and identify specificachievable opportunities. Given, the scale of the data used <strong>in</strong> the model<strong>in</strong>g and is known of the typesof wetland communities that likely existed <strong>in</strong> the watershed, some of the area with<strong>in</strong> the polygonsidentified are not likely suitable for wetland recreation or restoration projects.CVC is currently work<strong>in</strong>g with Dougan & Associates, Snell & Cecile Environmental Research andPhillips Eng<strong>in</strong>eer<strong>in</strong>g Ltd to move forward with the GLL study and develop a CVC Wetland RestorationStrategy. The strategy is beg<strong>in</strong>n<strong>in</strong>g with a GIS analysis of areas where wetlands could feasibly berecreated/restored and potential opportunities to protect exist<strong>in</strong>g wetlands from the anticipated effectsof climate change. This analysis will <strong>in</strong>corporate the GLL identified areas but will also <strong>in</strong>clude otherareas.Prelim<strong>in</strong>ary draft results of the GIS analysis of the CVC Wetland Restoration Strategy identifies 3,763ha or 4% of the watershed as potential wetland restoration areas. As with the Gartner Lee Limitedstudy further <strong>in</strong>vestigations are required to verify these opportunities at the site level. It is anticipatedthat site level <strong>in</strong>vestigations will be completed over the course of several field seasons; dictated bypriorities for resource allocation and data availability.Another issue perta<strong>in</strong>s to policy implementation. While we can target priority areas for wetlandrestoration based on hydrologic and ecological suitability, if those areas exist on private property it canbe very difficult to restore wetlands without a will<strong>in</strong>g land owner. In the <strong>Credit</strong> <strong>River</strong> <strong>Watershed</strong> thevast majority of land is privately owned, mak<strong>in</strong>g this a significant barrier to restor<strong>in</strong>g wetlands.Assess<strong>in</strong>g the compensation that landowners would demand for implement<strong>in</strong>g this policy, asdiscussed later, could comprise a Phase 3 of this research project.The Pemb<strong>in</strong>a Institute • <strong>Credit</strong> Valley Conservation 32 <strong>Valu<strong>in</strong>g</strong> Wetland Ecosystem Services (Phase I) • 2009
Research Plan for Phase 25.5 Applied research approaches to consider:The above <strong>in</strong>formation provides a foundation for help<strong>in</strong>g to target a select few applied researchapproaches that could be used to achieve the objectives set out <strong>in</strong> Section 5.1. The most importantpo<strong>in</strong>t to emphasize up-front is that the CVC would like to value a number of ecological services(possibly as a bundle), <strong>in</strong>clud<strong>in</strong>g direct-use (recreation), <strong>in</strong>direct-use (water quality, flood control), andnon-use (biodiversity) components. The best approach to use to value all these services collectively isa stated preference (i.e., cont<strong>in</strong>gent valuation or choice experiment) method. Other methods aredesigned to capture the value of very specific services (see Table 10). Given the desire to value arange of services (<strong>in</strong>clud<strong>in</strong>g non-use values), the stated preference methods provide the bestapproach.The Pemb<strong>in</strong>a Institute • <strong>Credit</strong> Valley Conservation 33 <strong>Valu<strong>in</strong>g</strong> Wetland Ecosystem Services (Phase I) • 2009
Research Plan for Phase 2The Pemb<strong>in</strong>a Institute • <strong>Credit</strong> Valley Conservation 34 <strong>Valu<strong>in</strong>g</strong> Wetland Ecosystem Services (Phase I) • 2009
AppendixValuation Studies Referenced <strong>in</strong> Table 10F. Bell, “The economic valuation of saltwater marsh support<strong>in</strong>g mar<strong>in</strong>e recreational fish<strong>in</strong>g <strong>in</strong> thesoutheastern United States”, Ecological Economics (1997) 21:243-254.E. Birol; K. Karousakis; and P. Koundouri, “Us<strong>in</strong>g a choice experiment to account for preferenceheterogeneity <strong>in</strong> wetland attributes: the case of Cheimaditida wetland <strong>in</strong> Greece”, EcologicalEconomics (2006) 60:145-156.A. Breaux; S. Farber; and J. Day, “Us<strong>in</strong>g natural coastal wetlands systems for wastewatertreatment: an economic benefit analysis”, Journal of Environmental Management (1995)44:285-291.F. Carlsson; P. Frykblom; and C. Liljenstolpe, “<strong>Valu<strong>in</strong>g</strong> wetland attributes: an application ofchoice experiments”, Ecological Economics (2003) 47:95-103.G. Chichilnisky and G. Heal, “Economic returns from the biosphere”, Nature (1998) 391:629-630.J. Cooper and J. Loomis, “Economic value of wildlife resources <strong>in</strong> the San Joaqu<strong>in</strong> Valley:hunt<strong>in</strong>g and view<strong>in</strong>g values”. P. 447-463. In A. D<strong>in</strong>ar and D. Zilberman (eds.) TheEconomics and Management of Water and Dra<strong>in</strong>age <strong>in</strong> Agriculture (Kluwer AcademicPublishers, Dordrecht, The Netherlands).A. Freeman III, “<strong>Valu<strong>in</strong>g</strong> environmental resources under alternative management regimes”,Ecological Economics (1991) 3: 247-256.J. Hammitt; J. –T. Liu; and J. –L. Liu, “Cont<strong>in</strong>gent valuation of Taiwanese wetlands”,Environmental and Development Economics (2001) 6: 259-268.R. Kazmierczak, “Economic l<strong>in</strong>kages between coastal wetlands and hunt<strong>in</strong>g and fish<strong>in</strong>g: areview of value estimates reported <strong>in</strong> the published literature”, (Baton Rouge, LA: LouisianaState University Agricultural Center, Staff Paper 2001-03, 2001).D. K<strong>in</strong>g and C. Hohlen, “Mak<strong>in</strong>g sense of wetland restoration costs”, (College Park, MA:University of Maryland, Center for Environmental Science, 1994).F. Lupi; T. Graham-Tomasi; and S. Taff, “A hedonic approach to urban wetland valuation”, Tw<strong>in</strong>Cities, MN: Department of Agricultural and Applied Economics Staff Paper P91-8, Universityof M<strong>in</strong>nesota, 1991).B. Mahan; S. Polasky; and R. Adams, “<strong>Valu<strong>in</strong>g</strong> Urban <strong>Wetlands</strong>: A Property Price Approach”,Land Economics (2000) 76 (1): 100-113.J. Pate and J. Loomis, “The effect of distance on will<strong>in</strong>gness to pay values: a case study ofwetlands and salmon <strong>in</strong> California”, Ecological Economics (1997) 20: 199-207.W. van Vuuren and P. Roy, “Private and social returns from wetland preservation versus thosefrom agriculture”, Ecological Economics (1993) 8: 289-305.The Pemb<strong>in</strong>a Institute • <strong>Credit</strong> Valley Conservation 35 <strong>Valu<strong>in</strong>g</strong> Wetland Ecosystem Services (Phase I) • 2009
Endnotes1US EPA, Restor<strong>in</strong>g and creat<strong>in</strong>g wetlands: A plann<strong>in</strong>g guide for the central states region,http://www.epa.gov/owow/wetlands/landasst.html (accessed February 23, 2009).2Joy B. Zedler, “<strong>Wetlands</strong> at your service: reduc<strong>in</strong>g impacts of agriculture at the watershed scale”, Frontiers of Ecology andEnvironment (2003) 1(2):66.3Gav<strong>in</strong> Kennedy and Tatiana Mayer, “Natural and constructed wetlands <strong>in</strong> Canada: an overview”, Water Quality Research Journalof Canada (2002) 37(2):2.4<strong>Credit</strong> Valley Conservation Authority. 2006. Conservation Authority Flood<strong>in</strong>g, Erosion, Shorel<strong>in</strong>e and <strong>Wetlands</strong> Regulation.http://www.creditvalleycons.com/bullet<strong>in</strong>/downloads/genregbackgrounder.pdf (accessed January 26, 2009). Pg. 1.5<strong>Credit</strong> Valley Conservation. 2005. P. 7.6<strong>Credit</strong> Valley Conservation. 2005. P. 10.7<strong>Credit</strong> Valley Conservation. 2005. P. 10.8<strong>Credit</strong> Valley Conservation. 2005. P. 16.9<strong>Credit</strong> Valley Conservation. 2007. P. 9.10<strong>Credit</strong> Valley Conservation. 2005. P. 16.11<strong>Credit</strong> Valley Conservation. 2005. P. 16.12<strong>Credit</strong> Valley Conservation. 2005. P. 1613<strong>Credit</strong> Valley Conservation. 2005. P. 20.14Environment Canada, The Canadian Wetland Classification System, Government of Canada,http://www.qc.ec.gc.ca/faune/atlasterreshumides/html/classification_e.html (accessed January 8, 2009).15Ibid.16Mark Anielski and Sara Wilson. “Count<strong>in</strong>g Canada’s Natural Capital: Assess<strong>in</strong>g the value of Canada’s Boreal Ecosystems” (ThePemb<strong>in</strong>a Institute, Drayton Valley AB, 2003).17Eric Plottu and Beatrice Plottu, “The concept of Total Economic Value of environment: A reconsideration with<strong>in</strong> a hierarchicalrationality”, Ecological Economics (2007) 61:52-61.18The total economic value framework recognized by Australia’s National Oceanic Atmospheric Adm<strong>in</strong>istration recognizes twoadditional non-use values that <strong>in</strong>clude: quasi-option values and vicarious use values. See NOAA.19Adapted from Tracy Boyer & Stephen Polasky, <strong>Valu<strong>in</strong>g</strong> Urban <strong>Wetlands</strong>: A Review of Non-Market Valuation Studies, <strong>Wetlands</strong>(2004) 24(4), 747; Bardecki 1998, 5; and De Groot et. al. 2002, 396-397.20Gav<strong>in</strong> Kennedy and Tatiana Mayer, “Natural and Constructed <strong>Wetlands</strong> <strong>in</strong> Canada: An Overview”, Water Quality and ResourcesJournal of Canada (2002) 37(2):304.21Ibid, 305.22Millennium Ecosystem Assessment, 34.23David Moreno-Mateos; Ülo Mander; Francisco A. Comín; César Pedrocchi; and Evelyn Uuemaa, “Relationships betweenLandscape Pattern, Wetland Characteristics, and Water Quality <strong>in</strong> Agricultural Catchments”, Journal of Environmental Quality(2008) 37:2171.24Kennedy & Mayer, 301.25Kennedy & Mayer, 301.26Gren et. al., 57.27Millennium Ecosystem Assessment, 30.28Millennium Ecosystem Assessment, 37.29Millennium Ecosystem Assessment, 34.30Millennium Ecosystem Assessment, 34.31Enrique Bucher; Gonzalo Castro and V<strong>in</strong>io Floris, Freshwater Ecosystem Conservation: Towards a Comprehensive WaterResources Management Strategy, (Wash<strong>in</strong>gton, D.C.: Inter-American Development Bank, 1997) Pg. 7.http://www.iadb.org/sds/doc/1079eng.pdf (accessed January 26, 2009).32Kennedy & Mayer, 303.33Kennedy & Mayer, 303.The Pemb<strong>in</strong>a Institute • <strong>Credit</strong> Valley Conservation 36 <strong>Valu<strong>in</strong>g</strong> Wetland Ecosystem Services (Phase I) • 2009
Endnotes34Oglthorpe & Miliadou, 756.35Millennium Ecosystem Assessment, 36.36Millennium Ecosystem Assessment, 36.37Zedler, 66.38L.-A. Hansson et. al., 712.39Ibid.40Ibid.41Ibid.42Moreno-Mateos et. al., 2171.43Moreno-Mateos et. al., 2178.44Ibid.45Zedler, 68.46Moreno-Mateos et. al., 2179.47Zedler, 68.48Ibid.49Moreno-Mateos et. al., 2170.50Moreno-Mateos et. al., 2171.51Brauman, et. al., 80.52Ecological Society of America, Biodiversity (Wash<strong>in</strong>gton, DC: Ecological Society of America, 1997)http://www.esa.org/education_diversity/pdfDocs/biodiversity.pdf (accessed April 24, 2009).53Zedler, 68.54Zedler, 66.55Ibid.56Zedler, 67.57Zedler, 68.58Ibid.59Ibid.60Ibid.61Robert E. Stewart, Jr., “Technical Aspects of <strong>Wetlands</strong>: <strong>Wetlands</strong> as Bird Habitat”, National Water Summary on WetlandResources United States Geological Survey Water Supply Paper 2425 (United States Geological Survey, 2007)http://water.usgs.gov/nwsum/WSP2425/birdhabitat.html (accessed April 24, 2009).62Ibid.63K. Ramesh Reddy and R.D. DeLaune, Biogeochemistry of <strong>Wetlands</strong>: Science and Applications, (CRC Press, 2008), 115.64Ibid.65Ontario M<strong>in</strong>istry of Natural Resources, Research Information Note #1: Climate Change (December 2003),http://www.mnr.gov.on.ca/198261.pdf (accessed April 28, 2009).66<strong>Credit</strong> Valley Conservation Authority, 1.67Ibid.68Zedler. 2003. 67.69Ibid.70Patricia M. Manuel, “Cultural Perceptions of Small Urban <strong>Wetlands</strong>: Cases from the Halifax Regional Municipality, Nova Scotia,Canada”, <strong>Wetlands</strong> (2003) 23(4):922.71Nevada Division of Water Plann<strong>in</strong>g, Nevada State Water Plan (Carson City, NV: Department of Conservation and NaturalResources, 1996) http://water.nv.gov/WaterPlann<strong>in</strong>g/wat-plan/PDFs/pt3-3a.pdf (accessed March 19, 2009).72Manuel, 922.73Meristem Land & Science, “A new era of value for wetlands”, (October 2007)http://www.meristem.com/cropScience/spcr08a_05.html (accessed April 28, 2009).74Keddy et. al., 41.75Casey and Kla<strong>in</strong>e. 2001. Nutrient Attenuation by a Riparian Wetland dur<strong>in</strong>g Natural and Artificial Runoff Events. Journal ofEnvironmental Quality 30(5):1729.76Ibid.The Pemb<strong>in</strong>a Institute • <strong>Credit</strong> Valley Conservation 37 <strong>Valu<strong>in</strong>g</strong> Wetland Ecosystem Services (Phase I) • 2009
Endnotes77Hansson, Lars-Anders; Christer Brönmark; P. Anders Nilsson; and Kasjsa Åbjörnsson. 2005. Conflict<strong>in</strong>g demands on wetlandecosystem services: nutrient retention, biodiversity or both? Freshwater Biology 50:711.78Ibid.79Ibid.80Ibid.81Ibid.82Ibid.83A. K. Knox, R. A. Dahlgren, K. W. Tate, and E. R. Atwill, “Efficacy of Natural <strong>Wetlands</strong> to Reta<strong>in</strong> Nutrient, Sediment and MicrobialPollutants”, Journal of Environmental Quality (2008) 37:1837.84L.-A. Hansson et. al., 711.85Casey & Kla<strong>in</strong>e, 1729.86Ibid.87L.-A. Hansson et. al., 706.88L.-A. Hansson et. al., 711.89Ibid.90A.K. Knox; R. A. Dahlgren; K. W. Tate; and E. R. Atwill, “Efficacy of Natural <strong>Wetlands</strong> to Reta<strong>in</strong> Nutrient, Sediment and MicrobialPollutants”, Journal of Environmental Quality (2008) 37:1837.91Knox et. al., 1843.92Casey & Kla<strong>in</strong>e, 1730.93L.-A. Hansson et. al., 712.94Ibid.95Knox et. al., 1844.96Knox et. al., 1843.97Knox et. al., 1844.98Ibid.99L.-A. Hansson et. al., 711.100Ibid.101Ibid .102Ibid.103C. Scott F<strong>in</strong>dlay and Jeff Houlahan, “Anthropogenic Correlates of Species Richness <strong>in</strong> Southeastern Ontario <strong>Wetlands</strong>”,Conservation Biology (1996) 11(4):1000.104Ibid.105Wiscons<strong>in</strong> Department of Natural Resources, “Wetland Functional Values”, http://dnr.wi.gov/wetlands/function.html (accessedMarch 19, 2009).106Ibid.107Ibid.108L.-A. Hansson et. al., 711.109Å. Jansson and P. Nohrstedt, “Carbon s<strong>in</strong>ks and human freshwater dependence <strong>in</strong> Stockholm County”, Ecological Economics(2001) 39:364.110Marie-Claude Bonneville; Ian B. Strachan; Elyn R. Humphreys; and Nigel T. Roulet, “Net ecosystem CO2 exchange <strong>in</strong> atemperate cattail marsh <strong>in</strong> relation to biophysical properties”, Agricultural and Forest Meteorology (2008) 148:69.111S. Shultz and J. Leitch, “The feasibility of restor<strong>in</strong>g previously dra<strong>in</strong>ed wetlands to reduce flood damage”, Journal of Soil andWater Conservation (2003) 58(1):21-29.112Casey and Kla<strong>in</strong>e, 1729.113Ibid.114Ibid.115Lars-Anders Hansson; Christer Brönmark; P. Anders Nilsson; and Kasjsa Åbjörnsson, “Conflict<strong>in</strong>g demands on wetlandecosystem services: nutrient retention, biodiversity or both?” Freshwater Biology (2005) 50:711.116Ibid.117IbidThe Pemb<strong>in</strong>a Institute • <strong>Credit</strong> Valley Conservation 38 <strong>Valu<strong>in</strong>g</strong> Wetland Ecosystem Services (Phase I) • 2009
Endnotes118Ibid119Ibid120Ibid121A. K. Knox et. al., 1837.122National Research Council, 137.123Kennedy & Mayer, 302.124Moreno-Mateos et. al., 2170.125Moreno-Mateos et. al., 2171.126<strong>Credit</strong> Valley Conservation Authority, 2.127Brauman, et. al., 80.128Ibid.129Kennedy & Mayer. 2002. 307.130Ibid.131Zedler, 66.132Kennedy & Mayer, 308.133Ibid.134<strong>Credit</strong> Valley Conservation, 6.135Q. Chiotti and B. Lavender, “Ontario; From Impacts to Adaptation: Canada <strong>in</strong> a Chang<strong>in</strong>g Climate 2007”, (Ottawa, ON:Government of Canada, 2008) Pg. 227-274.136Kennedy & Mayer, 307.137Zedler, 68.138R.H.A. van Grunsven, “Plants on the move: Plant-soil <strong>in</strong>teractions <strong>in</strong> poleward shift<strong>in</strong>g plant species”. PhD thesis, Wagen<strong>in</strong>genUniversity (2008), ISBN 978-90-8585-251-3139L. Brander; J. Raymond; and J. Vermaat, “The empirics of wetland valuation: a comprehensive summary and a meta-analysis ofthe literature”, Environmental and Resource Economics (2006) 33: 223-250.140R. Brouwer; I. Langford; I. Batemand; T. Crowards; and R. Turner, “A meta-analysis of wetland cont<strong>in</strong>gent valuation studies”,Regional Environmental Change (1999) 1:47-57.141R. Woodward and Y.-S. Wui, “The economic value of wetland services: a meta-analysis”, Ecological Economics (2001) 37: 257-270.142R. Turner; J. van den Bergh; and R. Brouwer, “Manag<strong>in</strong>g <strong>Wetlands</strong>: An Ecological Economics Approach” (U.K.: Edward ElgarPublish<strong>in</strong>g, 2003).143T. Boyer and S. Polasky, “<strong>Valu<strong>in</strong>g</strong> urban wetlands: a review of non-market valuation studies”, <strong>Wetlands</strong> (2004) 24(4): 744-755.144Brander et al., 2006.145It should be noted here that the CE method was not <strong>in</strong>cluded <strong>in</strong> the analysis as it has only recently been applied to wetlands.The Pemb<strong>in</strong>a Institute • <strong>Credit</strong> Valley Conservation 39 <strong>Valu<strong>in</strong>g</strong> Wetland Ecosystem Services (Phase I) • 2009