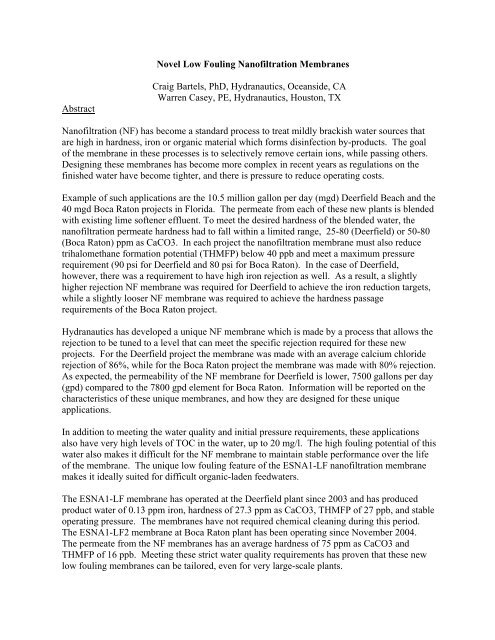
Novel Low Fouling Nanofiltration Membranes Craig Bartels, PhD ...
Novel Low Fouling Nanofiltration Membranes Craig Bartels, PhD ...
Novel Low Fouling Nanofiltration Membranes Craig Bartels, PhD ...

You also want an ePaper? Increase the reach of your titles
YUMPU automatically turns print PDFs into web optimized ePapers that Google loves.
Commercial Use of <strong>Nanofiltration</strong>37 mgd Mery sur Oise NF Plant (Desal 192 (2006) 303–314)Organic RemovalTDS PassagePesticide RemovalPartial Ca Removal9 mgd Boynton Beach NF Plant (AMTA 2005)Partial Ca Removal7 mgd Irvine Ranch Deep Aquafer2
New <strong>Nanofiltration</strong> Application Trends• Larger Plant Sizes: 10 – 40 mgd• Specific Permeate Hardness Target• High Organic Levels = High <strong>Fouling</strong>Potential• Disinfection By-Products Limits• <strong>Low</strong> Pressure Operation• Timing of Execution3
New <strong>Low</strong> <strong>Fouling</strong> NF <strong>Membranes</strong>with Variable Hardness RejectionControlled hardness removal - eliminating the need forhybrid membrane designs (LF, LF2, LF3 versions)Significantly reduces operating costs by lowering powerconsumption, while providing a non-aggressive low TDSpermeate waterGreatly reduces fouling potential caused from naturalorganic matter<strong>Low</strong>est cost per gallon produced – feed pressures of lessthan 100 psi saves energy cost4
Membrane Surface PropertiesSmooth TopographyESNA1-LF Surface• Surface roughness hasbeen decreased tominimize sites for debristrappingESPA3 Surface5
Membrane Surface Properties:Reduced Surface Charge100-10ζ Potential-20-30-40ESNA1-LFESNA1LFC1Surface charge similar to LFC1-502 3 4 5 6 7 8 9 10pH• <strong>Low</strong>er surface charge minimizes interaction with surfactants6
ESNA1-LF Salt Rejection(Surface water @ 13 gfd, 25 C)100.0%97.9%99.4%98.5%96.2% 96.4%95.0%Rejection (%)90.0%85.0%83.8%89.9%85.6%80.0%75.0%Na Ca Mg Fe Cl SO4 SiO2 TOCFeed Component Type7
ESNA1-LF2: Salt Rejection(Surface Water @ 13 gfd, 25 C)100%97.9%95%93.5%95.0%92.5%Rejection (%)90%85%83.0%80%77.2%75%Na Ca Fe Cl HCO3 SO4Ion8
Typical Florida Feed Waters10
Boca Raton Water Samples11
Deerfield Treatment ProcessHolding TankWell5 um Cart Filters 769 gpm 322 gpmWaste2145 gpm 1375 gpm 447 gpmProductAntiscalantWater25 C Acid RO System 1823 gpm482 ppm TDS ESNA1-LF Total250 ppm Hardness 85% Recovery 10.5 mgd285 ppm HCO3 5 Trains, 2 Stages1.5 ppm Fe 48 Vess x 24 Vess x 7 Elem20 ppm TOC 13 gfd Flux13
City of Deerfield Beach, FL14RO System Design:10.5 MGD of PermeateESNA1-LF Membrane5 trains48-24 array of 7M tubes85% recovery13.0 gfd.Pretreatment:AcidAntiscalantCartridge filtration.Operation:Start-up November 2003Steady PerformanceNo cleaning in two years
Deerfield Beach Separation Objective15
Deerfield Plant DataESNA1-LF Performance Trend* Estimated from Conductivity16
3/24/0612.0011.0010.009.008.007.006.005.004.003.002.001.000.00Deerfield Plant DataESNA1-LF Performance TrendSalt PassageSkid 1 Stage 1Normalized DataESNA1-LF Train 13/19/045/2/046/25/048/21/0410/26/0412/1/041/7/052/8/053/11/054/13/055/12/056/14/057/22/059/1/0510/22/0512/28/052/21/061712/03/03%
3/24/06Deerfield Plant DataESNA1-LF Performance Trend12.0011.0010.009.008.007.006.005.004.003.002.001.000.00Salt PassageSkid 1 Stage 2ESNA1-LFNormalized DataTrain 112/03/033/19/045/2/046/25/048/21/0410/27/0412/1/041/7/052/8/053/11/054/13/055/12/056/14/057/22/059/1/0510/22/0512/28/052/21/06Day18%
3/24/06Deerfield Plant DataESNA1-LF Performance TrendPerm FlowSkid 1 Stage 1Normalized DataESNA1-LF Train 11400.001200.001000.00800.00600.00400.00200.000.0012/03/033/19/045/2/046/25/048/21/0410/26/0412/1/041/7/052/8/053/11/054/13/055/12/056/14/057/22/059/1/0510/22/0512/28/052/21/0619gpm
3/24/06700650600550500450400350300250200150100500Deerfield Plant DataESNA1-LF Performance TrendPerm FlowSkid 1 Stage 2ESNA1-LFNormalized DataTrain 13/19/045/2/046/25/048/21/0410/27/0412/1/041/7/052/8/053/11/054/13/055/12/056/14/057/22/059/1/0510/22/0512/28/052/21/06Day2012/03/03gpm
3/24/0650.0045.0040.0035.0030.0025.0020.0015.0010.00Deerfield Plant DataESNA1-LF Performance TrendDifferential Pres.Skid 1 Stage 1Normalized DataESNA1-LF Train 15/2/046/25/048/21/0410/26/0412/1/041/7/052/8/053/11/054/13/055/12/056/14/057/22/059/1/0510/22/0512/28/052/21/06Day2112/03/033/19/04psi
Boca Raton Treatment ProcessHolding TankWellMediaFilter5 um Cart Filters 1136 gpm 450 gpmWasteLSI = 1.93003 gpm 1867 gpm 686 gpmProductWater25 C RO System 2553 gpm466 ppm TDS No Antiscalant ESNA1-LF2 Total265 ppm Hardness NO Acid 85% Recovery 40 mgd265 ppm HCO3 10 Trains, 2 Stages0.3 ppm Fe 72 Vess x 36 Vess x 7 Elem12 ppm TOC 12.2 gfd Flux22
City of Boca Raton, FLRO System DesignESNA1-LF2 (93% hrdnss rej)36.8 MGD permeate10 1 st /2 nd Stage Trains72-36 array of 7M tubes85% recovery12.2 gfdESNA-LF3 (98% hrdnss rej)3.2 MGD permeate2 each 3 rd Stage Trains36-18 array of 7M tubes50% recovery10.7 gfdPretreatmentMulti-mediafiltersCartridge filtersNo antiscalantNo acid addition23
Boca Raton Separation Objective24
Boca Raton Plant DataESNA1-LF2/3 Performance TrendSalt PassageBoca Raton Unit 7 Stage 120Normalized Salt Passage (%)%1816141210864209-Nov-04 17-Feb-05 28-May-05 5-Sep-05 14-Dec-05 24-Mar-06 2-Jul-06Date25
Boca Raton Plant DataESNA1-LF2/3 Performance TrendSalt PassageBoca Raton Unit 7 Stage 224Normalized Salt Passage (%)%2118151296309-Nov-04 17-Feb-05 28-May-05 5-Sep-05 14-Dec-05 24-Mar-06 2-Jul-06Date26
Boca Raton Plant DataESNA1-LF2/3 Performance TrendPerm Flow Norm.Boca Raton Unit 7 Stage 1Normalized System Flow (gpm)gpm26002400220020001800160014001200100080060040020009-Nov-04 17-Feb-05 28-May-05 5-Sep-05 14-Dec-05 24-Mar-06 2-Jul-06Date27
Boca Raton Plant DataESNA1-LF2/3 Performance TrendPerm Flow Norm.Boca Raton Unit 7 Stage 2Normalized System gpm Flow (gpm)5505004504003503002502001501005009-Nov-04 17-Feb-05 28-May-05 5-Sep-05 14-Dec-05 24-Mar-06 2-Jul-06Date28
Boca Raton Plant DataESNA1-LF2/3 Performance TrendDifferential Pres. Norm.Boca Raton Unit 7 Stage 140Normalized Press Drop (psi)psi38363432302826242220189-Nov-04 17-Feb-05 28-May-05 5-Sep-05 14-Dec-05 24-Mar-06 2-Jul-06Date29
Boca Raton Plant DataESNA1-LF2/3 Performance TrendDifferential Pres. Norm.Boca Raton Unit 7 Stage 226Normalized Press psi Drop (psi)24222018161412109-Nov-04 17-Feb-05 28-May-05 5-Sep-05 14-Dec-05 24-Mar-06 2-Jul-06Date30
Analysis of Fouled Membranefrom Lead ElementEDAX of MembraneSurface covered withfoulant.SEM of MembraneSurface covered withfoulant. 3000XIonCaPOFeSiCNAtomic %8.25.929.80.80.3242.78.7Ca3(PO4)28.25.52231
Boca Raton Plant DataPerformance Results32
Conclusions• <strong>Novel</strong> NF membrane chemistry allowscontrolled variation of the hardnessrejection• Modification of the surface results in asmoother, less charged surface whichreduces fouling• High rejection of NOM materialsresults in low disinfection by-productsand meets Federal standards33