344Straumal, Gornakova, Fabrichnaya, Kriegel, Mazilk<strong>in</strong>, Baretzky, Gusak and Dobatk<strong>in</strong>In Figure 4 and Figure 5 the temperature dependences <strong>of</strong>heat flow (DSC curves) are shown for the as-cast and HPTtreated<strong>Zr</strong>-<strong>Nb</strong> alloys. In the as-cast CG <strong>Zr</strong>-2.5 mass% <strong>Nb</strong>alloy (Figure 4a) two heat effects are clearly visible. Thefirst one is due to monotectic reaction ˛<strong>Zr</strong> C ˇ<strong>Nb</strong> $ ˇ<strong>Zr</strong>(onset at 623.1 ı C) and the second one is due to change <strong>of</strong>the ˛<strong>Zr</strong> C ˇ<strong>Zr</strong> two phase area <strong>in</strong>to s<strong>in</strong>gle ˇ<strong>Zr</strong> phase field(e.g. Figure 3) around 820 ı C. These temperatures are veryclose to the respective ones <strong>in</strong> the equilibrium <strong>Zr</strong>-<strong>Nb</strong> phasediagram (Figure 3). The onset at 491.8 ı C can be expla<strong>in</strong>edby the transformation <strong>of</strong> reta<strong>in</strong>ed ˇ<strong>Zr</strong> which is visible <strong>in</strong>the XRD-spectrum <strong>of</strong> as-cast CG alloys [87] <strong>in</strong>to equilibriumassemblage ˇ<strong>Nb</strong> C ˛<strong>Zr</strong>, which further transforms toˇ<strong>Zr</strong> C ˛<strong>Zr</strong> (622.1 ı C) up to complete transformation to ˇ<strong>Zr</strong>start<strong>in</strong>g at 748.2 ı C and show<strong>in</strong>g deep m<strong>in</strong>imum at 820 ı C.The transformation <strong>of</strong> ˇ<strong>Zr</strong> to ˛<strong>Zr</strong> C ˇ<strong>Zr</strong> is <strong>in</strong>dicated oncool<strong>in</strong>g curve (on-set 784.9 ı C). The temperature <strong>of</strong> transformationon heat<strong>in</strong>g is close to temperature <strong>of</strong> reversetransformation on cool<strong>in</strong>g. This confirms that both transformationsare diffusion controlled. The DSC curve for the ascast <strong>Zr</strong>-8 mass% <strong>Nb</strong> alloy looks different (Figure 4b).Thenon-equilibrium phase ˇ<strong>Zr</strong> found <strong>in</strong> as-cast <strong>Zr</strong>-8 mass%<strong>Nb</strong> alloy transforms <strong>in</strong>to ˛<strong>Zr</strong> phase at 441.0 ı C, the follow<strong>in</strong>gtransformation <strong>of</strong> ˛<strong>Zr</strong> <strong>in</strong>to ˇ<strong>Zr</strong> occurs as martensiticat 514.4 ı C. This is <strong>in</strong> agreement with calculated martensitictransformation shown by dashed l<strong>in</strong>e at Figure 3. Atfurther heat<strong>in</strong>g martensite ˇ<strong>Zr</strong> cont<strong>in</strong>uously transforms <strong>in</strong>toequilibrium assemblage ˛<strong>Zr</strong>Cˇ<strong>Zr</strong> which f<strong>in</strong>ally transforms<strong>in</strong>to stable ˇ<strong>Zr</strong> at 728.9 ı C correspond<strong>in</strong>g to deep m<strong>in</strong>imumat DSC curve. Only one exothermic effect was observedon cool<strong>in</strong>g at temperature (onset 523.6 ı C) which is muchlower than m<strong>in</strong>imum on heat<strong>in</strong>g. This exothermic effectcan be attributed to diffusionless transformation <strong>of</strong> ˇ<strong>Zr</strong> to˛<strong>Zr</strong>. The temperature <strong>of</strong> this effect is <strong>in</strong> a good agreementwith calculated temperature <strong>of</strong> diffusionless transformation.It should be mentioned that both as-cast samples<strong>Zr</strong>-2.5 mass% <strong>Nb</strong> and <strong>Zr</strong>-8 mass% <strong>Nb</strong> reproduce their behaviordur<strong>in</strong>g second heat<strong>in</strong>g and cool<strong>in</strong>g.The curves for the HPT-treated samples are quite different.First, the reaction with a very pronounced heat effectstarts at 491.1 ı C <strong>in</strong> the <strong>Zr</strong>-2.5 mass% <strong>Nb</strong> alloy (Figure 4c)and at 441.7 ı C <strong>in</strong> the <strong>Zr</strong>-8 mass% <strong>Nb</strong> alloy (Figure 5b).This reaction does not proceed <strong>in</strong> the repeated DSC-run(Figures 6a and 5c), if the HPT-treated samples are cooleddown after first DSC-run and heated aga<strong>in</strong>. Therefore, theseonset can be attributed with transformation <strong>of</strong> metastable!<strong>Zr</strong> <strong>in</strong>to ˛<strong>Zr</strong> one. It has to be underl<strong>in</strong>ed that not onlythe amount <strong>of</strong> !<strong>Zr</strong> is lower <strong>in</strong> the <strong>Zr</strong>-8 mass% <strong>Nb</strong> alloy(compare spectra <strong>in</strong> Figure 2), but also it transforms to ˛<strong>Zr</strong>phase at lower temperature. The second feature <strong>in</strong> alloy<strong>Zr</strong>-2.5 mass% <strong>Nb</strong> at 567.0 ı C can be expla<strong>in</strong>ed by the transformation<strong>of</strong> metastable ˇ<strong>Zr</strong> found <strong>in</strong> HPT treated alloy <strong>in</strong>to˛<strong>Zr</strong> phase. The second heat effect for <strong>Zr</strong>-8 mass% <strong>Nb</strong> alloycan be expla<strong>in</strong>ed by diffusionless transformation <strong>of</strong> ˛<strong>Zr</strong>to ˇ<strong>Zr</strong>. The calculated dashed l<strong>in</strong>e <strong>in</strong> Figure 3 is for thethe martensitic ˛ $ ˇ transformation can be used to <strong>in</strong>terpretthe DSC curves <strong>of</strong> HPT-treated alloys. It should bementioned that all transformations at temperatures below620 ı C occur by diffusionless mechanism. The diffusioncontrolledtransformation from ˛<strong>Zr</strong> <strong>in</strong>to ˇ<strong>Zr</strong> through thetwo-phase ˛ C ˇ region (e.g. Figure 3) is not visible <strong>in</strong> theDSC curves for both HPT-treated alloys. Probably equilibriumassemblage ˛ C ˇ are cont<strong>in</strong>uously form<strong>in</strong>g dur<strong>in</strong>gheat<strong>in</strong>g <strong>of</strong> martensite ˛<strong>Zr</strong> or ˇ<strong>Zr</strong> which further transformsto stable s<strong>in</strong>gle phase ˇ<strong>Zr</strong>. It should be mentioned, it isknown the ˛ $ ˇ transition <strong>in</strong> <strong>Zr</strong> and Ti alloys can proceedas diffusionless martensitic one [88, 89]. The martensite˛<strong>Zr</strong> <strong>in</strong> <strong>Zr</strong>-2.5 mass% <strong>Nb</strong> alloy cont<strong>in</strong>uously transforms toequilibrium ˛<strong>Zr</strong>Cˇ<strong>Zr</strong> assemblage which f<strong>in</strong>ally transformsto stable s<strong>in</strong>gle ˇ<strong>Zr</strong> phase show<strong>in</strong>g the deep m<strong>in</strong>ima <strong>in</strong> DSCcurves at 750 ı C <strong>in</strong> the <strong>Zr</strong>-2.5 mass% <strong>Nb</strong> alloy. Martensiteˇ<strong>Zr</strong> <strong>in</strong> the <strong>Zr</strong>-8 mass% <strong>Nb</strong> alloy cont<strong>in</strong>uously transforms toequilibrium ˛<strong>Zr</strong>Cˇ<strong>Zr</strong> assemblage which f<strong>in</strong>ally transforms<strong>in</strong>to stable ˇ<strong>Zr</strong> at 710 ı C. The gra<strong>in</strong> size effect on presenceor absence <strong>of</strong> martensitic transformation has been observed<strong>in</strong> precipitates <strong>in</strong> <strong>Zr</strong>-1 mass% <strong>Nb</strong> alloy [89]. Therefore,we can suppose that the clear change from diffusional tomartensitic transformations <strong>in</strong> the HPT-treated <strong>Zr</strong>-<strong>Nb</strong> alloys<strong>in</strong> comparison with as-cast alloys could be due to the SPDdrivengra<strong>in</strong> ref<strong>in</strong>ement.4 DiscussionUsually, the high applied pressure decreases the diffusivityand gra<strong>in</strong> boundary mobility [90, 91]. However, the atommovements caused by strong external forces can drive bothaccelerated diffusion and phase transformations <strong>in</strong> the material[85]. Historically, such unusual behavior was firstobserved <strong>in</strong> the materials under severe irradiation [1]. G.Mart<strong>in</strong> proposed the simplified mean-field description <strong>of</strong>solid solutions subjected to irradiation-<strong>in</strong>duced atomic mix<strong>in</strong>g[1]. His ma<strong>in</strong> idea was that the forced mix<strong>in</strong>g <strong>in</strong>ducedby irradiation emulates the <strong>in</strong>crease <strong>of</strong> entropy and changesthe thermodynamic potentials <strong>in</strong> the alloy. In a simple case<strong>of</strong> regular solution <strong>in</strong> the Bragg–Williams approximation alaw <strong>of</strong> correspond<strong>in</strong>g states was formulated: The equilibriumconfiguration <strong>of</strong> the solid under irradiation flux ' attemperature T is identical to the configuration at ' D 0anda certa<strong>in</strong> effective temperatureT eff D T.1C /: (1)If the irradiation-driven movements <strong>of</strong> atoms are similar<strong>in</strong> amplitude to conventional diffusion jumps, they can bedescribed by the “ballistic” diffusion coefficient D ball and D D ball =D b ,whereD b is conventional bulk diffusioncoefficient, possibly <strong>in</strong>creased due to the non-equilibriumdefect concentration [1]. It means that one can use the equilibriumphase diagram for the description <strong>of</strong> the system un-Bereitgestellt von | Karlsruher Institut für Technologie (KIT)Angemeldet | 141.52.94.125Heruntergeladen am | 12.11.12 15:54
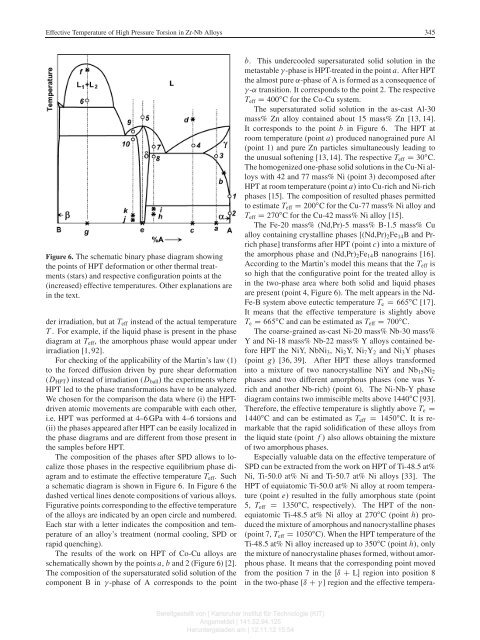
<strong>Effective</strong> <strong>Temperature</strong> <strong>of</strong> <strong>High</strong> <strong>Pressure</strong> <strong>Torsion</strong> <strong>in</strong> <strong>Zr</strong>-<strong>Nb</strong> <strong>Alloys</strong>345Figure 6. The schematic b<strong>in</strong>ary phase diagram show<strong>in</strong>gthe po<strong>in</strong>ts <strong>of</strong> HPT deformation or other thermal treatments(stars) and respective configuration po<strong>in</strong>ts at the(<strong>in</strong>creased) effective temperatures. Other explanations are<strong>in</strong> the text.der irradiation, but at T eff <strong>in</strong>stead <strong>of</strong> the actual temperatureT . For example, if the liquid phase is present <strong>in</strong> the phasediagram at T eff , the amorphous phase would appear underirradiation [1, 92].For check<strong>in</strong>g <strong>of</strong> the applicability <strong>of</strong> the Mart<strong>in</strong>’s law (1)to the forced diffusion driven by pure shear deformation(D HPT / <strong>in</strong>stead <strong>of</strong> irradiation (D ball / the experiments whereHPT led to the phase transformations have to be analyzed.We chosen for the comparison the data where (i) the HPTdrivenatomic movements are comparable with each other,i.e. HPT was performed at 4–6 GPa with 4–6 torsions and(ii) the phases appeared after HPT can be easily localized <strong>in</strong>the phase diagrams and are different from those present <strong>in</strong>the samples before HPT.The composition <strong>of</strong> the phases after SPD allows to localizethose phases <strong>in</strong> the respective equilibrium phase diagramand to estimate the effective temperature T eff .Sucha schematic diagram is shown <strong>in</strong> Figure 6. In Figure 6 thedashed vertical l<strong>in</strong>es denote compositions <strong>of</strong> various alloys.Figurative po<strong>in</strong>ts correspond<strong>in</strong>g to the effective temperature<strong>of</strong> the alloys are <strong>in</strong>dicated by an open circle and numbered.Each star with a letter <strong>in</strong>dicates the composition and temperature<strong>of</strong> an alloy’s treatment (normal cool<strong>in</strong>g, SPD orrapid quench<strong>in</strong>g).The results <strong>of</strong> the work on HPT <strong>of</strong> Co-Cu alloys areschematically shown by the po<strong>in</strong>ts a, b and 2 (Figure 6) [2].The composition <strong>of</strong> the supersaturated solid solution <strong>of</strong> thecomponent B <strong>in</strong> -phase <strong>of</strong> A corresponds to the po<strong>in</strong>tb. This undercooled supersaturated solid solution <strong>in</strong> themetastable -phase is HPT-treated <strong>in</strong> the po<strong>in</strong>t a. AfterHPTthe almost pure ˛-phase <strong>of</strong> A is formed as a consequence <strong>of</strong>-˛ transition. It corresponds to the po<strong>in</strong>t 2. The respectiveT eff D 400 ı C for the Co-Cu system.The supersaturated solid solution <strong>in</strong> the as-cast Al-30mass% Zn alloy conta<strong>in</strong>ed about 15 mass% Zn [13, 14].It corresponds to the po<strong>in</strong>t b <strong>in</strong> Figure 6. The HPT atroom temperature (po<strong>in</strong>t a/ produced nanogra<strong>in</strong>ed pure Al(po<strong>in</strong>t 1) and pure Zn particles simultaneously lead<strong>in</strong>g tothe unusual s<strong>of</strong>ten<strong>in</strong>g [13, 14]. The respective T eff D 30 ı C.The homogenized one-phase solid solutions <strong>in</strong> the Cu-Ni alloyswith 42 and 77 mass% Ni (po<strong>in</strong>t 3) decomposed afterHPT at room temperature (po<strong>in</strong>t a/ <strong>in</strong>to Cu-rich and Ni-richphases [15]. The composition <strong>of</strong> resulted phases permittedto estimate T eff D 200 ı C for the Cu-77 mass% Ni alloy andT eff D 270 ı C for the Cu-42 mass% Ni alloy [15].The Fe-20 mass% (Nd,Pr)-5 mass% B-1.5 mass% Cualloy conta<strong>in</strong><strong>in</strong>g crystall<strong>in</strong>e phases [(Nd,Pr) 2 Fe 14 BandPrrichphase] transforms after HPT (po<strong>in</strong>t c/ <strong>in</strong>to a mixture <strong>of</strong>the amorphous phase and (Nd,Pr) 2 Fe 14 B nanogra<strong>in</strong>s [16].Accord<strong>in</strong>g to the Mart<strong>in</strong>’s model this means that the T eff isso high that the configurative po<strong>in</strong>t for the treated alloy is<strong>in</strong> the two-phase area where both solid and liquid phasesare present (po<strong>in</strong>t 4, Figure 6). The melt appears <strong>in</strong> the Nd-Fe-B system above eutectic temperature T e D 665 ı C [17].It means that the effective temperature is slightly aboveT e D 665 ı C and can be estimated as T eff D 700 ı C.The coarse-gra<strong>in</strong>ed as-cast Ni-20 mass% <strong>Nb</strong>-30 mass%Y and Ni-18 mass% <strong>Nb</strong>-22 mass% Y alloys conta<strong>in</strong>ed beforeHPT the NiY, <strong>Nb</strong>Ni 3 ,Ni 2 Y, Ni 7 Y 2 and Ni 3 Y phases(po<strong>in</strong>t g/ [36, 39]. After HPT these alloys transformed<strong>in</strong>to a mixture <strong>of</strong> two nanocrystall<strong>in</strong>e NiY and <strong>Nb</strong> 15 Ni 2phases and two different amorphous phases (one was Y-rich and another <strong>Nb</strong>-rich) (po<strong>in</strong>t 6). The Ni-<strong>Nb</strong>-Y phasediagram conta<strong>in</strong>s two immiscible melts above 1440 ı C [93].Therefore, the effective temperature is slightly above T e D1440 ı C and can be estimated as T eff D 1450 ı C. It is remarkablethat the rapid solidification <strong>of</strong> these alloys fromthe liquid state (po<strong>in</strong>t f/also allows obta<strong>in</strong><strong>in</strong>g the mixture<strong>of</strong> two amorphous phases.Especially valuable data on the effective temperature <strong>of</strong>SPD can be extracted from the work on HPT <strong>of</strong> Ti-48.5 at%Ni, Ti-50.0 at% Ni and Ti-50.7 at% Ni alloys [33]. TheHPT <strong>of</strong> equiatomic Ti-50.0 at% Ni alloy at room temperature(po<strong>in</strong>t e/ resulted <strong>in</strong> the fully amorphous state (po<strong>in</strong>t5, T eff D 1350 ı C, respectively). The HPT <strong>of</strong> the nonequiatomicTi-48.5 at% Ni alloy at 270 ı C (po<strong>in</strong>t h/ producedthe mixture <strong>of</strong> amorphous and nanocrystall<strong>in</strong>e phases(po<strong>in</strong>t 7, T eff D 1050 ı C). When the HPT temperature <strong>of</strong> theTi-48.5 at% Ni alloy <strong>in</strong>creased up to 350 ı C (po<strong>in</strong>t h/, onlythe mixture <strong>of</strong> nanocrystal<strong>in</strong>e phases formed, without amorphousphase. It means that the correspond<strong>in</strong>g po<strong>in</strong>t movedfrom the position 7 <strong>in</strong> the Œı C L region <strong>in</strong>to position 8<strong>in</strong> the two-phase [ı C ] region and the effective tempera-Bereitgestellt von | Karlsruher Institut für Technologie (KIT)Angemeldet | 141.52.94.125Heruntergeladen am | 12.11.12 15:54