allan variance estimated by phase noise measurements - PTTI
allan variance estimated by phase noise measurements - PTTI
allan variance estimated by phase noise measurements - PTTI

You also want an ePaper? Increase the reach of your titles
YUMPU automatically turns print PDFs into web optimized ePapers that Google loves.
36 th Annual Precise Time and Time Interval (<strong>PTTI</strong>) Meeting<br />
III. RESULTS AND CALCULATIONS<br />
Realizing how each individual <strong>noise</strong> process behaves in the conversion using these two methods, we try<br />
to convert the real <strong>phase</strong> <strong>noise</strong> measurement data into ADEV. Here we take the <strong>noise</strong> floor of our<br />
measurement system to be an example. A 5 MHz reference signal is split with a reactive splitter to<br />
provide a pair of input signals. These signals are connected to the LO and RF ports of a double-balanced<br />
mixer. A delay line unit is required here to put the two signals into quadrature (90° out of <strong>phase</strong>) before<br />
entering the mixer. The output of the mixer is low pass filtered, amplified, and then fed into a FFT<br />
spectrum analyzer.<br />
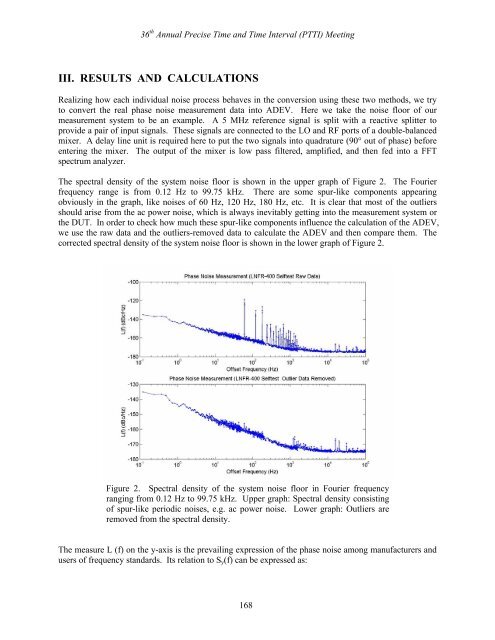
The spectral density of the system <strong>noise</strong> floor is shown in the upper graph of Figure 2. The Fourier<br />
frequency range is from 0.12 Hz to 99.75 kHz. There are some spur-like components appearing<br />
obviously in the graph, like <strong>noise</strong>s of 60 Hz, 120 Hz, 180 Hz, etc. It is clear that most of the outliers<br />
should arise from the ac power <strong>noise</strong>, which is always inevitably getting into the measurement system or<br />
the DUT. In order to check how much these spur-like components influence the calculation of the ADEV,<br />
we use the raw data and the outliers-removed data to calculate the ADEV and then compare them. The<br />
corrected spectral density of the system <strong>noise</strong> floor is shown in the lower graph of Figure 2.<br />
Figure 2. Spectral density of the system <strong>noise</strong> floor in Fourier frequency<br />
ranging from 0.12 Hz to 99.75 kHz. Upper graph: Spectral density consisting<br />
of spur-like periodic <strong>noise</strong>s, e.g. ac power <strong>noise</strong>. Lower graph: Outliers are<br />
removed from the spectral density.<br />
The measure L (f) on the y-axis is the prevailing expression of the <strong>phase</strong> <strong>noise</strong> among manufacturers and<br />
users of frequency standards. Its relation to Sy(f) can be expressed as:<br />
168