STD Surveillance Network Report - Virginia Department of Health
STD Surveillance Network Report - Virginia Department of Health
STD Surveillance Network Report - Virginia Department of Health

You also want an ePaper? Increase the reach of your titles
YUMPU automatically turns print PDFs into web optimized ePapers that Google loves.
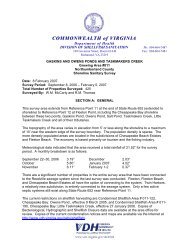
V i r g i n i a D e p a r t m e n t o f H e a l t h , O f f i c e o f E p i d e m i o l o g yD i v i s i o n o f D i s e a s e P r e v e n t i o n<strong>STD</strong> <strong>Surveillance</strong> <strong>Network</strong> OverviewA u g u s t 2 0 1 3<strong>STD</strong> <strong>Surveillance</strong> <strong>Network</strong> <strong>Report</strong>Traditionally, sexually transmitted disease (<strong>STD</strong>) surveillanceactivities involve collecting basic information onthe age, sex, race/ethnicity, and county <strong>of</strong> residence <strong>of</strong>cases. However, in order to improve the design <strong>of</strong> publichealth programs for the prevention and control <strong>of</strong><strong>STD</strong>s such as gonorrhea, more detailed information isneeded on a broad cross-section <strong>of</strong> patients.In response to such surveillance needs, the Centers forDisease Control and Prevention (CDC) established the<strong>STD</strong> <strong>Surveillance</strong> <strong>Network</strong> (SSuN). SSuN is intended tobe a dynamic, flexible <strong>STD</strong> surveillance network composed<strong>of</strong> local enhanced <strong>STD</strong> surveillance systems followingcommon protocols. The purpose <strong>of</strong> SSuN is to fillcritical gaps in national surveillance as well as improvethe capacity <strong>of</strong> national, state, and local <strong>STD</strong> programsto detect, monitor, and respond rapidly to trends in<strong>STD</strong>s through enhanced collection, reporting, analysis,visualization, and interpretation <strong>of</strong> disease information.In the first funding cycle <strong>of</strong> SSuN (10/2005-9/2008), 5geographically diverse health departments participatedin enhanced gonorrhea surveillance in order to bettercharacterize the epidemiology <strong>of</strong> gonorrhea. In the sec-ond cycle <strong>of</strong> SSuN (10/2008-9/2013), the scope <strong>of</strong> theproject was expanded to include all <strong>STD</strong>s, and 12 sitesacross the United States now participate in these enhancedsurveillance activities. The SSuN project areascurrently encompass 42 <strong>STD</strong> clinics, 115 counties, and 6laboratories. Data collected as part <strong>of</strong> SSuN now captureapproximately 20% <strong>of</strong> the total gonorrhea casesdiagnosed annually in the United States.SSuN has two main components: <strong>STD</strong> clinic surveillanceand Neisseria gonorrhoeae (NG) population surveillance.The former involves collecting enhanced informationon patients presenting to <strong>STD</strong> clinics, while thelatter involves interviewing a random sample <strong>of</strong> patientsdiagnosed with gonorrhea in the general population.The data captured as part <strong>of</strong> SSuN include informationnot only on <strong>STD</strong> diagnoses, but also on patientdemographics and high-risk behaviors.In 2012, three <strong>Virginia</strong> localities participated in theSSuN project: Richmond City, Chesterfield County, andHenrico County. Enhanced surveillance data is capturedfor approximately 6,000 <strong>STD</strong> clinic visits and over 1,000cases <strong>of</strong> gonorrhea each year in these three localities.<strong>Report</strong> Contents<strong>STD</strong>s in Richmond 2SSuN Management 3Map 1. SSuN Cycle II Participating Project Areas and Labs, 2009-13SSuN Cycle 2 Participating Project Areas (n=12)and Labs (n=6), 2009 – 2013Washington<strong>STD</strong> Clinic <strong>Surveillance</strong> 4Demographics 5<strong>STD</strong> Diagnoses 8San FranciscoColoradoChicagoConnecticutNew York CityPhiladelphiaBaltimore<strong>Virginia</strong>Population <strong>Surveillance</strong> 11Interviewed Cases 13SSuN Update 15Los Angeles/CASSuN Participating AreasSSuN Laboratory SitesLouisianaAlabamaP a g e 1
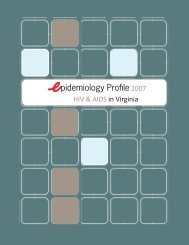
<strong>STD</strong> <strong>Surveillance</strong> <strong>Network</strong> <strong>Report</strong> 2012Map 1. 5-Year Average Gonorrhea Rates by Census Tract, 2007-2011Managing SSuN Activities in <strong>Virginia</strong>SSuN project activities in <strong>Virginia</strong> are coordinated by<strong>Health</strong> Informatics and Integrated <strong>Surveillance</strong> Systems(HIISS) staff within the Division <strong>of</strong> Disease Prevention(DDP) at the <strong>Virginia</strong> <strong>Department</strong> <strong>of</strong> <strong>Health</strong>’sCentral Office.SSuN <strong>STD</strong> Clinic data collection activities involve collaborationwith the health department <strong>STD</strong> clinics inthe three participating <strong>Virginia</strong> health districts. Clinicalstaff at these local <strong>STD</strong> clinics distribute selfadministeredinterview forms during the registrationprocess to all patients visiting the clinic.These completed interview forms are then sent to thecentral <strong>of</strong>fice for data entry into the SSuN data system.Data quality assurance and management activitiesalso occur at the central <strong>of</strong>fice, including the integration<strong>of</strong> patient interview data with information on<strong>STD</strong> diagnoses and treatment from other <strong>STD</strong> andHIV/AIDS surveillance data systems.For SSuN NG population surveillance activities, HIISSstaff attempt to contact gonorrhea patients via phoneto conduct interviews. These interviews include questionssimilar to those on the paper-based interviewforms collected from <strong>STD</strong> clinics. Up to 10 attemptsare made to contact each patient, and interviews areconducted within 60 days <strong>of</strong> the gonorrhea diagnosis.The SSuN grant funds a full-time <strong>STD</strong> epidemiologistto coordinate SSuN activities in <strong>Virginia</strong>. In addition,masters <strong>of</strong> public health (MPH) students are <strong>of</strong>tenhired to assist with additional data collection activitiessuch as conducting phone interviews with patientsdiagnosed with gonorrhea. These students also assistwith data analyses and reports.P a g e 3
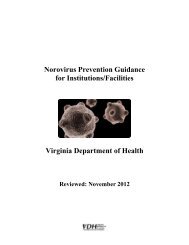
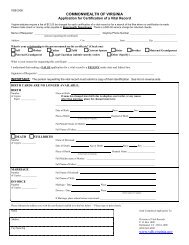
Count <strong>of</strong> Clinic Visits<strong>STD</strong> <strong>Surveillance</strong> <strong>Network</strong> <strong>Report</strong> 2012<strong>STD</strong> Clinic <strong>Surveillance</strong> Data SummaryInterviews were captured for 26,266 patient visits tothe three participating <strong>STD</strong> clinics during the 4 yearperiod between January 1, 2009 and December 31,2012 (out <strong>of</strong> 35,414 total clinic visits).All patients presenting to these <strong>STD</strong> clinics were askedto complete a SSuN interview form during the registrationprocess. This interview form captures informationon patient demographics, risk behaviors, and <strong>STD</strong>history. Data from these interviews were latermerged with patient diagnoses and treatment informationfrom other <strong>STD</strong> reporting systems.On average, 126 interviews were collected per weekfrom 2009-2012, representing 74% <strong>of</strong> all clinic visits.The Richmond City <strong>STD</strong> clinic had the largest volume<strong>of</strong> patient visits, followed by Chesterfield and HenricoCounty clinics (Figure 2).The majority <strong>of</strong> patients who were interviewed in2012 attended <strong>STD</strong> clinics within their own localities<strong>of</strong> residence, however there was considerable crossoverbetween neighboring areas (Table 1). For example,approximately 38% <strong>of</strong> Richmond City <strong>STD</strong> Clinicpatients were residents <strong>of</strong> another locality.Figure 2. Summary <strong>of</strong> <strong>STD</strong> Clinic Visits by Quarter and Facility, 2009-20122,8002,6002,4002,2002,0001,8001,6001,4001,2001,0008006004002000HenricoChesterfieldRichmondYear-QuarterTable 1. Patient Locality <strong>of</strong> Residence by <strong>STD</strong> Clinic, 2012 (Interviewed Patients Only)OverallRichmond Henrico ChesterfieldLocality <strong>of</strong> Residence Count Percent Count Percent Count Percent Count PercentRichmond City 3,102 49.2% 2,886 61.6% 93 13.9% 123 12.8%Henrico County 1,594 25.3% 1,053 22.5% 524 78.4% 17 1.8%Chesterfield County 1,178 18.7% 428 9.1% 19 2.8% 731 76.2%Hanover County 72 1.1% 57 1.2% 13 1.9% 2 0.2%Petersburg City 57 0.9% 32 0.7% 0 0.0% 25 2.6%Hopewell City 32 0.5% 18 0.4% 1 0.1% 13 1.4%Colonial Heights City 16 0.3% 5 0.1% 0 0.0% 11 1.1%Other Locality 204 3.2% 158 3.4% 16 2.4% 30 3.1%Out <strong>of</strong> State 41 0.6% 33 0.7% 2 0.3% 6 0.6%Unknown 14 0.2% 13 0.3% 0 0.0% 1 0.1%Totals 6,310 4,683 668 959P a g e 4
<strong>STD</strong> <strong>Surveillance</strong> <strong>Network</strong> <strong>Report</strong> 2012Table 2. Characteristics <strong>of</strong> Patients Attending Richmond Area <strong>STD</strong> Clinics, 2009-2012Characteristic N % N % N % N %GenderMale 12,995 49.5 10,059 52.0 1,344 41.7 1,592 43.2Female 13,234 50.4 9,263 47.9 1,877 58.2 2,094 56.8Transgender 37 0.1 33 0.2 3 0.1 1 0.0Race/EthnicityAgeBlack, non-Hispanic 20,397 77.7 15,895 82.1 2,477 76.8 2,025 54.9White, non-Hispanic 3,424 13.0 2,060 10.6 447 13.9 917 24.9Hispanic/Latino 1,998 7.6 1,067 5.5 245 7.6 679 18.4Other, non-Hispanic 429 1.6 318 1.6 48 1.5 63 1.7Unknown 18 0.1 15 0.1 0 0.0 3 0.1Less than 15 years 2 0.0 0 0.0 1 0.0 1 0.015-19 years 493 1.9 308 1.6 75 2.3 110 3.020-24 years 7,343 28.0 5,357 27.7 889 27.6 1,097 29.825-29 years 7,586 28.9 5,613 29.0 886 27.5 1,087 29.530-34 years 4,132 15.7 2,936 15.2 519 16.1 677 18.435-44 years 3,823 14.6 2,776 14.3 569 17.6 478 13.045+ years 2,887 11.0 2,365 12.2 285 8.8 237 6.4EducationLess than HS/GED 3,667 14.0 2,643 13.7 456 14.1 568 15.4High school/GED 10,029 38.2 7,360 38.0 1,310 40.6 1,359 36.9Some college 9,057 34.5 6,627 34.2 1,124 34.9 1,306 35.44+ years college 2,716 10.3 2,105 10.9 305 9.5 306 8.3Unknown 797 3.0 620 3.2 29 0.9 148 4.0EmploymentEmployed 13,671 52.0 9,857 50.9 1,860 57.7 1,954 53.0Unemployed 8,942 34.0 6,683 34.5 1,084 33.6 1,175 31.9Other* 1,920 7.3 1,471 7.6 179 5.6 270 7.3Unknown 1,733 6.6 1,344 6.9 101 3.1 288 7.8Student StatusFull-time student 4,755 18.1 3,505 18.1 561 17.4 689 18.7Part-time student 2,245 8.5 1,656 8.6 280 8.7 309 8.4Not a student 18,014 68.6 13,241 68.4 2,292 71.1 2,481 67.3Unknown 1,252 4.8 953 4.9 91 2.8 208 5.6Totals 26,266 19,355 3,224 3,687* Includes retired, homemaker, and unable to w orkOverall Richmond HenricoChesterfieldTechnical Note: The data shown above represent patient visits to participating <strong>STD</strong> clinics, but do not necessarily represent unique patients.That is, individual patients may have attended participating <strong>STD</strong> clinics multiple times during the study period.P a g e 6
<strong>STD</strong> <strong>Surveillance</strong> <strong>Network</strong> <strong>Report</strong> 2012Table 3. Testing and Vaccination History <strong>of</strong> <strong>STD</strong> Clinic Patients, 2009-2012Overall Richmond Henrico ChesterfieldN % N % N % N %Ever tested for HIVYes 20,567 78.3 15,463 79.9 2,576 79.9 2,528 68.6No 4,859 18.5 3,272 16.9 614 19.0 973 26.4Unknown/Missing 840 3.2 620 3.2 34 1.1 186 5.0HPV Vaccination Status (females only)Not vaccinated 8,500 64.2 5,898 63.7 1,314 70.0 1,288 61.5Partially vaccinated 886 6.7 635 6.9 98 5.2 153 7.3Fully vaccinated 1,417 10.7 988 10.7 192 10.2 237 11.3Unsure 1,543 11.7 1,170 12.6 109 5.8 264 12.6Missing 888 6.7 572 6.2 164 8.7 152 7.3Pat ient Gender and Sex <strong>of</strong> Pa rtnersOverall, the majority <strong>of</strong> <strong>STD</strong> clinic patients (83% <strong>of</strong>men and 86% <strong>of</strong> women) reported either being heterosexualor having sex exclusively with partners <strong>of</strong>the opposite sex in the 3 months prior to their clinicvisit. Among men, 8% reported being homosexual orhaving sex with other men (MSM) in the previous 3months, while an additional 3.3% reported being bisexualor having sex with both men and women. Menattending the Richmond City <strong>STD</strong> clinic were morelikely to be MSM or bisexual than attendees <strong>of</strong> theHenrico or Chesterfield county clinics.Approximately 8% <strong>of</strong> women reported bisexual orientationor having sex with both men and women in theprevious 3 months, while 2% reported having sex exclusivelywith other women.Table 4. Gender <strong>of</strong> Sex Partners among <strong>STD</strong> Clinic Patients, 2009-2012Gender andOverall Richmond Henrico ChesterfieldSex <strong>of</strong> Partners* N % N % N % N %Men who have sex with…men 995 7.7 848 8.4 91 6.8 56 3.5women 10,819 83.3 8,195 81.5 1,218 90.6 1,406 88.3both men and women 428 3.3 373 3.7 29 2.2 26 1.6unknown sex <strong>of</strong> partners 753 5.8 643 6.4 6 0.4 104 6.5Total Men 12,995 10,059 1,344 1,592Women who have sex with…men 11,421 86.3 7,890 85.2 1,731 92.2 1,800 86.0women 262 2.0 203 2.2 26 1.4 33 1.6both men and women 1,019 7.7 784 8.5 109 5.8 126 6.0unknown sex <strong>of</strong> partners 532 4.0 386 4.2 11 0.6 135 6.4Total Women 13,234 9,263 1,877 2,094* Transgender individuals invidiauls not shown n (N = 37).P a g e 7
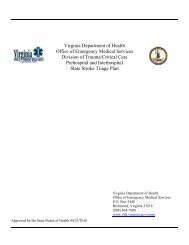
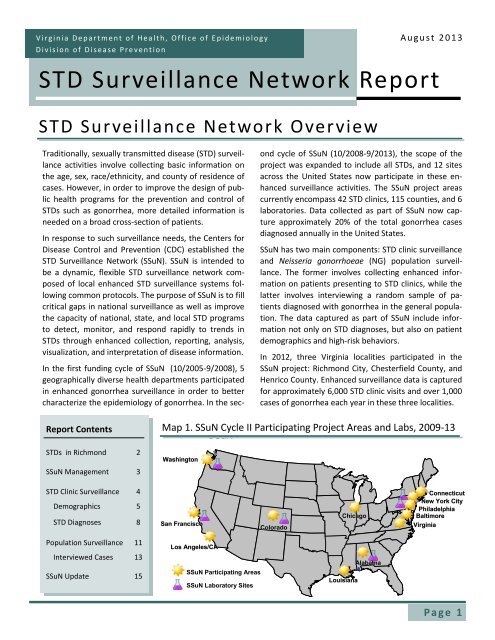
Positivity Rate (%)<strong>STD</strong> <strong>Surveillance</strong> <strong>Network</strong> <strong>Report</strong> 2012<strong>STD</strong> Clin ic - Diagnosis RatesChlamydia was the most frequently diagnosed <strong>STD</strong> inthe clinics, with a positivity rate <strong>of</strong> 14% (3,562 cases)between Jan. 1, 2009 and Dec. 31, 2012. The gonorrheapositivity rate during this period was 4% (1,062cases). There were slight variations in positivity ratesbetween clinics (Table 5). For example, the chlamydiarate was highest in Chesterfield County, while thegonorrhea rate was highest in Richmond City. In addition,46% <strong>of</strong> patients reported a previous <strong>STD</strong> infectionsometime prior to their clinic visit.<strong>STD</strong> positivity rates were highest among patients whowere male, black, younger ages, and had less education(Table 6). For example, 5% <strong>of</strong> male clinic patientswere diagnosed with gonorrhea compared to 3% <strong>of</strong>females.Younger patients were significantly more likely to bediagnosed with both chlamydia and gonorrhea. Positivityrates were highest among 15-24 year olds, anddecreased steadily with increasing age (Figure 4). Fifteenpercent <strong>of</strong> non-Hispanic black patients were diagnosedwith chlamydia compared to 9% <strong>of</strong> non-Hispanic white patients and 11% <strong>of</strong> Hispanic patients(Figure 5).<strong>STD</strong> positivity rates also increased with increased engagementin high-risk behaviors (Table 6), such as notusing a condom at last sex and marijuana use. Havingmultiple sex partners was also associated with an increased<strong>STD</strong> positivity rate, with chlamydia positivityincreasing from 5% to 18% for patients reporting 0compared to 3 or more recent sex partners.Table 5. Patient Diagnoses by <strong>STD</strong> Clinic, 2009-2012Overall Richmond Henrico ChesterfieldDiagnosis N % N % N % N %Chlamydia 3,562 13.6 2,550 13.2 453 14.1 559 15.2Gonorrhea 1,062 4.0 847 4.4 104 3.2 111 3.0Syphilis 82 0.3 62 0.3 14 0.4 6 0.2Ever Diagnosed w/<strong>STD</strong>* 12,072 46.0 9,226 47.7 1,523 47.2 1,323 35.9Totals 26,266 19,355 3,224 3,687* Patients w ho reported ever having been diagnosed w ith a sexually transmitted infection, including trichomoniasis and genital w arts.Figure 4. <strong>STD</strong> Positivity Rates by Patient Age, 2009-20123025201510515-19 years20-24 years25-34 years35-44 years45+ years0ChlamydiaGonorrheaP a g e 8
<strong>STD</strong> <strong>Surveillance</strong> <strong>Network</strong> <strong>Report</strong> 2012Table 6. <strong>STD</strong> Positivity Rates by Patient Characteristics, 2009-2012TotalCharacteristic N N % N % N %GenderMale 12,995 2,015 15.5 678 5.2 64 0.5Female 13,234 1,545 11.7 384 2.9 16 0.1Transgender 37 2 5.4 0 0.0 2 5.4Race/EthnicityBlack, non-Hispanic 20,397 2,988 14.6 990 4.9 71 0.3White, non-Hispanic 3,424 315 9.2 34 1.0 3 0.1Hispanic/Latino 1,998 212 10.6 26 1.3 7 0.4Other, non-Hispanic 429 47 11.0 12 2.8 1 0.2Unknown 18 0 0.0 0 0.0 0 0.0Age15-19 years 493 118 23.9 18 3.7 0 0.020-24 years 7,343 1,593 21.7 410 5.6 17 0.225-29 years 7,586 1,071 14.1 343 4.5 19 0.330-34 years 4,132 432 10.5 153 3.7 10 0.235-44 years 3,823 247 6.5 88 2.3 18 0.545+ years 2,887 100 3.5 50 1.7 18 0.6Gender and Sex <strong>of</strong> Partners †MSM 995 32 3.2 55 5.5 29 2.9MSW 10,819 1842 17.0 551 5.1 18 0.2MS(M&W) 428 19 4.4 33 7.7 13 3.0MSUnknown 753 122 16.2 39 5.2 4 0.5WSM 11,421 1360 11.9 332 2.9 15 0.1WSW 262 4 1.5 0 0.0 0 0.0WS(M&W) 1,019 134 13.2 34 3.3 0 0.0WSUnknown 532 47 8.8 18 3.4 1 0.2EducationChlamydiaGonorrheaSyphilisLess than HS/GED 3,667 579 15.8 184 5.0 9 0.2High school/GED 10,029 1,611 16.1 479 4.8 34 0.3Some college 9,057 1,089 12.0 319 3.5 29 0.34+ years college 2,716 187 6.9 37 1.4 8 0.3Unknown 797 96 12.0 43 5.4 2 0.3††MSMMSM = men wwho have sexsexwwith men;men;MSWMSW= men= menw howhohavehavesex wsexithwithw omen;women;MSB =MS(M&W)men w ho have= mensexwhow ithhaveboth mensex withand wbothomen;menMSUand=women; w ithMSUnknownunknow n gender= men<strong>of</strong> sexwithpartner(s);unknownWSMgender= w omen<strong>of</strong> sexwpartner(s);ho have sexWSMw ith w=omen;womenWSWwho= whaveomensexw howithhavewomen;sex w ithWSW = women who have sex with women; WS(M&W) = women who have sex with both men and women; WSUnknown =women with unknown gender <strong>of</strong> sex partner(s)P a g e 9
Positivity Rate (%)<strong>STD</strong> <strong>Surveillance</strong> <strong>Network</strong> <strong>Report</strong> 2012Figure 5. <strong>STD</strong> Positivity Rates by Patient Race/Ethnicity, 2009-20121614121086420ChlamydiaGonorrheaBlack, non-HispanicWhite, non-HispanicHispanic/LatinoOther, non-HispanicTable 7. <strong>STD</strong> Positivity Rates by Patient Risk Behaviors, 2009-2012TotalChlamydia Gonorrhea SyphilisCharacteristic* N N % N % N %Used condom last sexYes 9,346 1,123 12.0 348 3.7 34 0.4No 15,254 2,230 14.6 645 4.2 39 0.3Anonymous Sex †Yes 2,325 302 13.0 104 4.5 8 0.3No 15,426 2,025 13.1 526 3.4 14 0.1Exchanged Sex †Yes 287 27 9.4 10 3.5 3 1.0No 17,409 2,297 13.2 611 3.5 22 0.1Marijuana use †Yes 7,529 1,242 16.5 389 5.2 19 0.3No 11,311 1,349 11.9 361 3.2 14 0.1Incarcerated †Yes 1,854 298 16.1 87 4.7 3 0.2No 16,269 2,103 12.9 573 3.5 22 0.1Number <strong>of</strong> sex partners ‡0 partners 1,325 68 5.1 20 1.5 20 1.51 partner 12,869 1,633 12.7 394 3.1 28 0.22 partners 6,371 944 14.8 320 5.0 17 0.33+ partners 3,922 687 17.5 252 6.4 13 0.3* Unknow n/missing categories not show n † In the previous 12 months ‡ In the previous 3 monthsP a g e 10
<strong>STD</strong> <strong>Surveillance</strong> <strong>Network</strong> <strong>Report</strong> 2012NG Population <strong>Surveillance</strong>In the Richmond metropolitan area (including the localities<strong>of</strong> Richmond City, Henrico and Chesterfieldcounties), there were 3,231 cases <strong>of</strong> gonorrhea diagnosedin 2010-2012 and reported to the <strong>Virginia</strong> <strong>Department</strong><strong>of</strong> <strong>Health</strong> who were eligible to be interviewedfor SSuN population surveillance.Of these cases, the majority were black and between15-34 years <strong>of</strong> age (Figure 6, Table 8). Approximately45% <strong>of</strong> all reported cases were male and 55% werefemale.Most cases were diagnosed by hospital emergencyrooms (28%), followed by family planning or reproductivehealth facilities (25%), and <strong>STD</strong> clinics (23%).There were some notable differences in the type <strong>of</strong>diagnosing facility by gender (Figure 7). Men weremost likely to be diagnosed with gonorrhea at <strong>STD</strong>clinics (32%) or hospital emergency rooms (30%),while women were most likely to be diagnosed at reproductivehealth facilities (42%) followed by hospitalemergency rooms (26%).As part <strong>of</strong> SSuN Neisseria gonorrhoeae (NG) populationsurveillance activities, HIISS staff attempt to contactall individuals diagnosed with gonorrhea in thegeneral population and ask these patients to participatein a brief phone interview. These interviews captureinformation on patient demographics and riskbehaviors similar to that collected in the <strong>STD</strong> clinics.Figure 6. Gonorrhea Cases by Race, 2010-12Black, non-HispanicWhite, non-HispanicHispanic/LatinoOther, non-HispanicUnknown8%2%6% 1%83%A total <strong>of</strong> 1,060 gonorrhea cases were interviewed inthe Richmond area from 2010-2012. Most <strong>of</strong> thesecases were black, heterosexual, and between 20-24years <strong>of</strong> age (Table 9), mirroring the overall demographiccomposition <strong>of</strong> all eligible gonorrhea cases.Interviewed women tended to be younger than men(Figure 8). Women were also more likely to be eitherfull-time or part-time students at the time <strong>of</strong> theirinterview (37%) compared to men (24%) (Figure 8).Forty-three percent <strong>of</strong> all interviewed cases were unemployedwhen they were diagnosed with gonorrhea.A large proportion <strong>of</strong> interviewees reported engagingin high-risk behaviors (Table 10), such as not using acondom at last sexual encounter (68%), having sexwith someone they were not able to contact again(15%), using marijuana (28%), and having more thanone sex partner in the previous 3 months (43%).Similar to the <strong>STD</strong> clinic surveillance data, reportedengagement in these behaviors varied significantly bygender. For example, men were more likely to beolder, employed, engage in anonymous sex, and reporthaving 3 or more sexual partners in the previous3 months. Women were less likely to report condomuse at last sexual intercourse (28% vs. 38%).Approximately 24% <strong>of</strong> interviewed men reported homosexualor bisexual orientation. Behaviors variedslightly by sexual orientation (not shown), althoughthe small numbers <strong>of</strong> homosexual or bisexual individualsinterviewed precluded meaningful analysis.Basic characteristics <strong>of</strong> interviewed gonorrhea casesby diagnosing facility type are provided in Table 11.Men diagnosed by <strong>STD</strong> clinics and hospital emergencyrooms tended to be younger. Men diagnosed at urgentcare facilities were much more likely to havecompleted higher education (41% reported completing4 or more years <strong>of</strong> college), and were less likely tobe unemployed. Smaller differences were observedamong women, although women diagnosed by hospitalemergency rooms were more likely to be unemployed(56%) compared to women diagnosed by <strong>STD</strong>clinics (45%) or reproductive health facilities (46%).P a g e 11
<strong>STD</strong> <strong>Surveillance</strong> <strong>Network</strong> <strong>Report</strong> 2012Table 8. Characteristics <strong>of</strong> Gonorrhea Cases, SSuN Population <strong>Surveillance</strong>, 2010-2012Total * Male † Female †Characteristic N % N % N %RaceBlack, non-Hispanic 2,695 83.4 1,178 82.1 1,515 84.6White, non-Hispanic 203 6.3 102 7.1 100 5.6Hispanic/Latino 56 1.7 26 1.8 30 1.7Other, non-Hispanic 34 1.1 14 1.0 20 1.1Unknown 243 7.5 115 8.0 126 7.0Age0-9 years 4 0.1 1 0.1 3 0.210-14 years 17 0.5 5 0.3 12 0.715-19 years 857 26.5 264 18.4 592 33.120-24 years 1,268 39.2 555 38.7 713 39.825-34 years 774 24.0 387 27.0 386 21.635-44 years 196 6.1 135 9.4 60 3.445+ years 113 3.5 88 6.1 24 1.7Unknown 1 0.0 0 0.0 1 0.1Provider TypeEmergency Room 898 27.8 431 30.0 460 25.7<strong>STD</strong> Clinic 740 22.9 461 32.1 278 15.5FP/GYN/RH ‡ 793 24.5 36 2.5 757 42.3Urgent Care Clinic 284 8.8 237 16.5 46 2.6Private Provider/HMO 256 7.9 135 9.4 119 6.6Other § 246 7.6 124 8.6 121 6.8Unknown 20 0.6 11 0.8 10 0.6Totals 3,231 1,435 1,791* Includes all cases <strong>of</strong>gonorrhea diagnosedin the localities <strong>of</strong>Richmond City, HenricoCounty, and ChesterfieldCounty between01/01/2010and 12/31/2012 whowere eligible to beinterviewed for SSuN(these data may excludesome cases dueto reporting delays)† Male and femaletotals exclude 2 transgendercases and 2cases with missinggender‡ Family planning / OBGYN / reproductivehealth facility§ Includes hospital,public clinic (non-<strong>STD</strong>),school, jail/prison,military, outreach, HIVcare clinic, and otherFigure 7. Provider Type Diagnosing Gonorrhea Cases by Gender, 2010-2012MalesFemalesHospital ER<strong>STD</strong> ClinicFP/GYN/RH‡9%9% 1% Hospital ER<strong>STD</strong> Clinic30%FP/GYN/RH‡7%3%7% 0%26%Urgent Care ClinicPrivate Provider/HMOOtherUnknown17%2%Urgent Care ClinicPrivate Provider/HMOOther32% Unknown42%15%P a g e 12
<strong>STD</strong> <strong>Surveillance</strong> <strong>Network</strong> <strong>Report</strong> 2012Table 9. Characteristics <strong>of</strong> Interviewed Gonorrhea Cases, 2010-2012TotalMale † Female †Characteristic N % N % N %RaceBlack, non-Hispanic 937 88.4 380 85.2 557 90.9White, non-Hispanic 74 7.0 45 10.1 28 4.6Hispanic/Latino 36 3.4 15 3.4 21 3.4Other, non-Hispanic 12 1.1 5 1.1 7 1.1Unknown 1 0.1 1 0.2 0 0.0Age10-14 years 2 0.2 1 0.2 1 0.215-19 years 263 24.8 62 13.9 201 32.820-24 years 449 42.4 195 43.7 254 41.425-34 years 259 24.4 121 27.1 137 22.335-44 years 52 4.9 39 8.7 13 2.145+ years 35 3.3 28 6.3 7 1.1SexualityHeterosexual 917 86.5 334 74.9 583 95.1Homosexual 64 6.0 62 13.9 2 0.3Bisexual 71 6.7 43 9.6 27 4.4Unknown 8 0.8 7 1.6 1 0.2EducationLess than HS/GED 278 26.2 84 18.8 194 31.6High school/GED 391 36.9 182 40.8 209 34.1Some college 307 29.0 125 28.0 181 29.54 years college or more 83 7.8 55 12.3 28 4.6Unknown 1 0.1 0 0.0 1 0.2Employment StatusEmployed 535 50.5 262 58.7 272 44.4Unemployed 460 43.4 160 35.9 300 48.9Other‡ 47 4.4 19 4.3 28 4.6Unknown 18 1.7 5 1.1 13 2.1Student StatusNot a student 726 68.5 337 75.6 388 63.3Full-time student 246 23.2 81 18.2 165 26.9Part-time student 87 8.2 27 6.1 60 9.8Totals 1,060 446 613† Excludes 1 transgender individual ‡ Includes retired, homemaker, and unable to w orkP a g e 13
<strong>STD</strong> <strong>Surveillance</strong> <strong>Network</strong> <strong>Report</strong> 2012Figure 8. Age <strong>of</strong> Interviewed Gonorrhea Cases by Gender, 2010-2012MenWomen10-14 years15-19 years20-24 years25-34 years35-44 years45+ 45+ years40%30%20%10%0%0% 10% 20% 30% 40%Figure 9. Student Status <strong>of</strong> Interviewed Gonorrhea Cases by Gender , 2010-2012Men6%Women10%Not a studentFull-time studentPart-time student18%76%Not astudentFull-timestudentPart-timestudent27%63%Table 10. Risk Behaviors <strong>of</strong> Interviewed Gonorrhea Cases by Gender, 2010-2012Total Male † Female †Risk Behaviors* N % N % N %Used condom last sex 340 32.1 170 38.1 169 27.6Anonymous sex‡ 163 15.4 102 22.9 61 10.0Exchanged sex‡ 7 0.7 1 0.2 6 1.0Incarcerated‡ 90 8.5 58 13.0 32 5.2Marijuana use‡ 301 28.4 151 33.9 150 24.5Number <strong>of</strong> sex partners§0 partners 10 0.9 6 1.3 4 0.71 partner 575 54.2 155 34.8 420 68.52 partners 281 26.5 145 32.5 135 22.03+ partners 171 16.1 126 28.3 45 7.3Totals 1,060 446 613* Unknown/missing n/missing categories not shown n ‡ In the previous 12 months ‡ In the previous 12 months† Excludes 1 transgender individual § In the previous 3 months § In the previous 3 monthsP a g e 14
<strong>STD</strong> <strong>Surveillance</strong> <strong>Network</strong> <strong>Report</strong> 2012Table 11. Characteristics <strong>of</strong> Interviewed Gonorrhea Cases by Facility Type, 2010-2012Characteristic* N % N % N % N % N % N %Age15-19 years 17 10.6 8 15.7 22 14.0 71 34.1 22 20.8 74 32.720-24 years 69 42.9 14 27.5 80 51.0 79 38.0 55 51.9 94 41.625-34 years 51 31.7 16 31.4 39 24.8 55 26.4 21 19.8 52 23.035-44 years 17 10.6 8 15.7 8 5.1 2 1.0 5 4.7 5 2.245+ years 6 3.7 5 9.8 8 5.1 1 0.5 3 2.8 0 0.0EducationLess than HS/GED 42 26.1 2 3.9 30 19.1 79 38.0 25 23.6 68 30.1High school/GED 78 48.4 10 19.6 65 41.4 75 36.1 34 32.1 77 34.1Some college 32 19.9 18 35.3 48 30.6 50 24.0 40 37.7 69 30.54 years college or more 9 5.6 21 41.2 14 8.9 3 1.4 7 6.6 12 5.3Employment StatusMenAlexandria HD Now Participating in SSuNThe <strong>STD</strong> clinic at the Alexandria City <strong>Health</strong> <strong>Department</strong> started participationin SSuN activities in January, 2013. Alexandria is <strong>Virginia</strong>’s first SSuNsite located outside <strong>of</strong> the Richmond area, and represents an importantstep towards expanding sentinel surveillance activities statewide. Usingdata collected by the Alexandria <strong>Health</strong> <strong>Department</strong>, the VDH is now ableto analyze valuable information on patients living in the northern <strong>Virginia</strong>area. Summary data from the Alexandria clinic will be available in the nextSSuN report.In the future, the VDH plans to continue to expand enhanced and sentinelsurveillance activities into other regions <strong>of</strong> <strong>Virginia</strong>, particularly thosewhich experience a high burden <strong>of</strong> <strong>STD</strong>s or have large at-risk populations.WomenHospital ER Urgent Care <strong>STD</strong> Clinic Hospital ER <strong>STD</strong> ClinicEmployed 74 46.0 40 78.4 99 63.1 78 37.5 54 50.9 105 46.5Unemployed 76 47.2 8 15.7 56 35.7 117 56.3 48 45.3 104 46.0Other ‡ 9 5.6 2 3.9 1 0.6 9 4.3 4 3.8 11 4.9Unknown 2 1.2 1 2.0 1 0.6 4 1.9 0 0.0 6 2.7Totals 161 51 157 208 106 226FP/GYN/RH †** Some categories not shown n † Family † planning / / OB GYN / reproductive health facility ‡ Includes retired, homemaker, and and unable to to w workH e a l t h I n f o r m a t i c s & I n t e g r a t e d S u r v e i l l a n c e S y s t e m sD i v i s i o n o f D i s e a s e P r e v e n t i o nO f f i c e o f E p i d e m i o l o g yV i r g i n i a D e p a r t m e n t o f H e a l t hhttp://www.vdh.virginia.gov/epidemiology/DiseasePrevention/data/1 0 9 G o v e r n o r S t r e e tP . O . B o x 2 4 4 8 , R o o m 3 2 6R i c h m o n d , V A 2 3 2 1 8 - 2 4 4 8SSuN Coordinator: River Pugsleyriver.pugsley@vdh.virginia.govSSuN Principal Collaborator: Jeff Stoverjeff.stover@vdh.virginia.govP a g e 15