Awraq Investments www.awraq.com Tel: 962 6 550 ... - Menafn.com
Awraq Investments www.awraq.com Tel: 962 6 550 ... - Menafn.com
Awraq Investments www.awraq.com Tel: 962 6 550 ... - Menafn.com

Create successful ePaper yourself
Turn your PDF publications into a flip-book with our unique Google optimized e-Paper software.
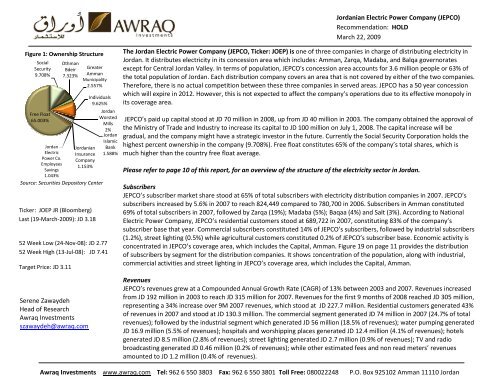
Figure 1: Ownership Structure<br />
Social<br />
Security<br />
9.708%<br />
Free Float<br />
65.003%<br />
Jordan<br />
Electric<br />
Power Co.<br />
Employees<br />
Savings<br />
1.043%<br />
Othman<br />
Bdeir<br />
7.323%<br />
Source: Securities Depository Center<br />
Ticker: JOEP JR (Bloomberg)<br />
Last (19-March-2009): JD 3.18<br />
52 Week Low (24-Nov-08): JD 2.77<br />
52 Week High (13-Jul-08): JD 7.41<br />
Target Price: JD 3.11<br />
Serene Zawaydeh<br />
Head of Research<br />
<strong>Awraq</strong> <strong>Investments</strong><br />
szawaydeh@<strong>awraq</strong>.<strong>com</strong><br />
Greater<br />
Amman<br />
Municipality<br />
2.557%<br />
Jordanian<br />
Insurance<br />
Company<br />
1.153%<br />
Individuals<br />
9.625%<br />
Jordan<br />
Worsted<br />
Mills<br />
2%<br />
Jordan<br />
Islamic<br />
Bank<br />
1.588%<br />
Jordanian Electric Power Company (JEPCO)<br />
Re<strong>com</strong>mendation: HOLD<br />
March 22, 2009<br />
The Jordan Electric Power Company (JEPCO, Ticker: JOEP) is one of three <strong>com</strong>panies in charge of distributing electricity in<br />
Jordan. It distributes electricity in its concession area which includes: Amman, Zarqa, Madaba, and Balqa governorates<br />
except for Central Jordan Valley Valley. In terms of population, opulation, JEPCO's concession area accounts for 3.6 million people or 63% of<br />
the total population of Jordan Jordan. . Each distribution <strong>com</strong>pany covers an area that is not covered by either of the two <strong>com</strong>panies.<br />
Therefore, there is no actual <strong>com</strong>petition between thes these e three <strong>com</strong>panies in served areas. JEPCO has a 50 year concession<br />
which will expire in 2012. However, this is not expected to affect the <strong>com</strong>pany’s operations due to its effective monopoly in<br />
its coverage area.<br />
JEPCO’s paid up capital stood at JD 70 mill million ion in 2008, up from JD 40 million in 2003. The <strong>com</strong>pany obtained the approval of<br />
the Ministry of Trade rade and Industry to increase its capital to JD 100 million on July 1, 2008. The capital increase will be<br />
gradual, and the <strong>com</strong>pany might have a strategic inve investor stor in the future. Currently the Social Security Corporation holds the<br />
highest percent ownership in the <strong>com</strong>pany (9.708%). Free float constitutes 65% of the <strong>com</strong>pany’s total shares, which is<br />
much higher than the country free float average.<br />
Please refer to o page 10 of this report, for an overview of the structure of the electricity sector in Jordan.<br />
Subscribers<br />
JEPCO’s EPCO’s subscriber market share stood at 65% of total subscribers with electricity distribution <strong>com</strong>panies in 2007. JEPCO’s<br />
subscribers increased by 5.6% in 2007 to reach 824,449 <strong>com</strong>pared to 780,700 in 2006. Subscribers in Amman constituted<br />
69% of total subscribers in 2007, followed by Zarqa (19%); Madaba (5%); Baqaa (4%) and Salt (3%). According to National<br />
Electric Power Company, JEPCO’s residenti residential customers stood at 689,722 in 2007, , constituting 83% of the c<strong>com</strong>pany’s<br />
subscriber base that year year. . Commercial subscribers constituted 14% of JEPCO’s subscribers, followed by industrial subscribers<br />
(1.2%), street lighting (0.5%) while agricultural customer customers constituted 0.2% 2% of JEPCO’s subscriber base. Economic activity is<br />
concentrated in JEPCO’s coverage area, which includes the Capital, Amman. Figure 19 on page 11 provides the distribution<br />
of subscribers by segment for the distribution <strong>com</strong>panies. It shows concentration of the population, along with industrial,<br />
<strong>com</strong>mercial activities and street lighting in JEPCO’s coverage area, which includes the Capital, Amman.<br />
Revenues<br />
JEPCO’s revenues grew at a Compounded Annual Growth Rate (CAGR) of 13% between 2003 and 2007. Revenues increased<br />
from JD 192 million in 2003 to reach JD 315 million for 2007. Revenues for the first 9 months of 2008 reached JD 305 million,<br />
representing a 34% increase over 9M 2007 revenues, which stood at JD 227.7 million. Residential customers generated 43%<br />
of revenues in 2007 and stood at JD 130.3 million. The <strong>com</strong>mercial segment generated JD 774<br />
million in 2007 (24.7% of total<br />
revenues); followed by the industrial segment which generated JD 56 million (18.5% of revenues); water pumping generated<br />
JD 16.9 million (5.5% of revenues revenues); hospitals and worshipping places generated JD 12.4 million (4.1% of revenues revenues); hotels<br />
generated JD 8.5 million (2.8% of revenues) revenues); street lighting generated JD 2.7 million (0.9% of revenues revenues); TV and radio<br />
broadcasting generated JD 0.46 million (0.2% of revenues); ); while other estimated fees and non read meters meters’ revenues<br />
amounted to JD 1.2 million (0.4% of revenues).<br />
<strong>Awraq</strong> <strong>Investments</strong> <strong>www</strong>.<strong>awraq</strong>.<strong>com</strong> <strong>Tel</strong>: <strong>962</strong> 6 <strong>550</strong> 3803 Fax: <strong>962</strong> 6 <strong>550</strong> 3801 Toll Free: 080022248 P.O. Box 925102 Amman 11110 Jordan
Jordanian Electric Power Company (JEPCO)<br />
Cost of sales represents a primary item on the <strong>com</strong>pany’s in<strong>com</strong>e statement. This represents the cost of bought power from National Electric<br />
Power Company (NEPCO). It accounted for 80% of revenues in 2003, and 87% of revenues in the first 9 months of 2008. Other operating expenses<br />
accounted for 2.7% in the first 9 months of 2008. The gross profit margin stood at 10.3% for the first 9 months of 2008, <strong>com</strong>pared to 12.2% in 9M<br />
2007. Net profit amounted to JD 8.6 million in 2003 with a net profit margin of 4.6%. It increased to JD 11 million in 2007, with a net profit margin<br />
of 3.8%. In the first 9 months of 2008, net profit stood at JD 9 million with a net profit margin of 3%.<br />
The <strong>com</strong>pany reported preliminary revenues for 2008 of JD 426.23 million, <strong>com</strong>pared to JD 315 million in 2007. This amount represents revenues<br />
from sales of energy; investment in<strong>com</strong>e; net other revenues; non operating revenues; write down of investments; and foreign exchange gain.<br />
The <strong>com</strong>pany has a non operating revenue item of JD 7.25 million from selling land to Greater Amman Municipality.<br />
Electricity Tariffs<br />
The Electricity Regulatory Commission (ERC) sets wholesale prices that electricity <strong>com</strong>panies pay to NEPCO, and tariffs that end users pay to the<br />
distribution <strong>com</strong>panies. In line with the increase in international oil prices in 2007, the ERC increased the wholesale prices that electricity<br />
distribution <strong>com</strong>panies have to pay to NEPCO on July 1, 2007. Daytime and night time wholesale tariffs increased by 1.11 Fils/KWh, to reach 35.41<br />
and 25.36 Fils/KWh respectively. This led to an increase in the cost of purchased power for JEPCO. In the last quarter of 2007, purchased power<br />
accounted for 89% of total revenues for the quarter, <strong>com</strong>pared to 78% in 2004. Eight months later, on March 14, 2008, the ERC implemented an<br />
increase to prices that end users pay to electricity <strong>com</strong>panies. The average increase to prices for end users stood at 34% versus an average of 3.9%<br />
increase on tariffs for electricity <strong>com</strong>panies. (Please refer to the Appendix for details on tariffs.)<br />
The increase in electricity tariffs was translated into in an increase in the ratio of revenues to sold power. The ratio was 46.9 in 2003 and increased<br />
to 50.4 in 2007. The increase in usage is displayed in the increase in ratio of sold power per subscriber, which increased from 6 in 2003 to 7.3 in<br />
2007. As a result of the increase in usage and tariffs, the electricity monthly Average Revenue per User (ARPU) for all segments of users <strong>com</strong>bined<br />
increased from JD 24 in 2003 to JD 31.5 in 2007.<br />
We calculated the electricity ARPU based on revenues and the number of subscribers by segment reported by NEPCO, and the revenues by<br />
segment reported by JEPCO. The ARPU indicator is a <strong>com</strong>mon indicator in the tele<strong>com</strong> industry. Results show an increase in ARPU by segment,<br />
which is due to an increase in consumption in addition to an increase in tariffs. The agricultural segment has the highest ARPU <strong>com</strong>pared to other<br />
segments. The Ministry of Agriculture is one of JEPCO’s subscribers, and it is in charge of pumping water to customers.<br />
There is a gap between the bought power from NEPCO, and the sold power to end users. The ratio of sold power to bought power declined from<br />
89% in 2003 to 85% in 2007. In addition to losses in the system, there was an increase in electricity theft, which results in unpaid consumption of<br />
electricity. This ac<strong>com</strong>panied the increase in oil prices, which led to substitution of traditional heating based on oil products, to electric<br />
heating. The percent of lost power reached 15.2% in 2007 <strong>com</strong>pared to 12.4% in 2006. Furthermore, there is a difference in growth of bought<br />
power and sold power. Sold power readings are taken between mid of the month and the following month, while the bought power meters are<br />
taken on the first day of each month.<br />
<strong>Awraq</strong> <strong>Investments</strong> <strong>www</strong>.<strong>awraq</strong>.<strong>com</strong> <strong>Tel</strong>: <strong>962</strong> 6 <strong>550</strong> 3803 Fax: <strong>962</strong> 6 <strong>550</strong> 3801 Toll Free: 080022248 P.O. Box 925102 Amman 11110 Jordan<br />
[2]
Figure 2: Number of JEPCO’s Customers by Segment<br />
2003 2004 2005 2006 2007<br />
Domestic 538,839 570,180 605,638 640,594 689,722<br />
Industrial 9,082 9,345 9,706 9,957 10,230<br />
Commercial 98,279 102,794 107,919 113,770 119,010<br />
Water Pumping 970 1,040 1,074 1,250 1,340<br />
Governmental 5,762 5,998 6,489 6,864 4,147<br />
Others 7,298 7,613 7,874 8,265 -<br />
Total<br />
Source: NEPCO<br />
660,230 696,970 738,700 780,700 824,449<br />
Figure 4: Average Revenue per User by Segment<br />
ARPU (JD) 2004 2005 2006 2007<br />
Residential 13 14 15 16<br />
Commercial 47 50 55 60<br />
Industrial 348 395 419 463<br />
Water pumping 1064 992 998 1082<br />
Government, Street lighting 26 29 32 42<br />
Other customers (hospitals, religeous) 104 106 115<br />
Source: NEPCO, JEPCO, <strong>Awraq</strong> <strong>Investments</strong><br />
Figure 6: Average Sold Power per Customer (MW)<br />
2003 2004<br />
Residential and public buildings 3.06 3.22<br />
Commercial, Hotels, Broadcasting 8 9<br />
Industrial 99.30 106.79<br />
Water pumping 352 309<br />
Government, Street lighting 17.24 18.32<br />
Other customers (hospitals, religious)<br />
Source: JEPCO<br />
23 21<br />
2005 2006 2007<br />
3.30 3.61 3.65<br />
9 10 11<br />
113.08 129.99 133.81<br />
291 261 290<br />
18.47 19.64 31.99<br />
20 19<br />
397 448<br />
Jordanian Electric Power Company (JEPCO)<br />
Figure 3: Revenues by Segment<br />
Residential<br />
Revenues Commercial, Hotels, Hospitals, Religious, Broadcasting<br />
Industrial<br />
Agricultural<br />
140<br />
130<br />
Governmental, Street lighting<br />
115<br />
120 Others, unread meters<br />
99<br />
96<br />
100<br />
89<br />
79<br />
84<br />
80<br />
60<br />
67<br />
73<br />
60<br />
45 49<br />
56<br />
34 39<br />
40<br />
20<br />
12 13 13 14 17<br />
1 0.3 2 0.4<br />
2 0.7<br />
3 2.7 3 1.3<br />
-<br />
Sold Power Bought Power Sold power / Bought Power<br />
8000<br />
7000<br />
6000<br />
5000<br />
89%<br />
90%<br />
4907<br />
4396<br />
88% 6157<br />
88%<br />
5431<br />
4793 5393<br />
7113<br />
6030<br />
90%<br />
89%<br />
88%<br />
87%<br />
4000<br />
86%<br />
3000<br />
84.8%<br />
85%<br />
<strong>Awraq</strong> <strong>Investments</strong> <strong>www</strong>.<strong>awraq</strong>.<strong>com</strong> <strong>Tel</strong>: <strong>962</strong> 6 <strong>550</strong> 3803 Fax: <strong>962</strong> 6 <strong>550</strong> 3801 Toll Free: 080022248 P.O. Box 925102 Amman 11110 Jordan<br />
JD Million<br />
Source: JEPCO<br />
Gigawatt Hour (GWH)<br />
2000<br />
1000<br />
0<br />
2003 2004<br />
Figure 5: Sold Power versus Bought Power<br />
Source: JEPCO<br />
2005 2006 2007<br />
2003 2004 2005 2006 2007<br />
84%<br />
83%<br />
82%<br />
[3]
Jordanian Electric Power Company (JEPCO)<br />
Balance Sheet<br />
Total assets stood at JD 421.7 million at the end of September 2008, representing a 15.6% growth over total assets for September 2007 which<br />
stood at JD 364.7 million. Total assets include subscriber contributions and rural fils contributions after depreciation. The <strong>com</strong>pany reports<br />
subscriber contributions at both sides of the balance sheets under non current assets and non current liabilities. In order to address customers’<br />
needs for electricity that is above the specific load provided by the network, subscribers pay amounts required to install assets such as: transformer<br />
stations, cables, electric poles and others. Should inventory be used for the project, the amount used moves into projects in progress. Once 80% of<br />
the project is <strong>com</strong>pleted, the amounts move into subscriber contributions, which are depreciated at 4% annually. The increase in construction<br />
activity in 2006 and 2007 was reflected in an increase in subscriber contributions assets. Subscriber contributions assets amounted to JD 63 million<br />
in 2003, constituting 25.4% of total assets, and reached JD 124 million at the end of September 2008, constituting 29.4% of total assets. Subscriber<br />
contributions are not refunded to customers.<br />
JEPCO has a liquidity challenge, as current assets do not cover current liabilities. The gap between current assets and current liabilities has been<br />
widening over the years, leading to a negative working capital. The current ratio, calculated by dividing total current assets by total current<br />
liabilities, is less than 1. It decreased from 75% in 2003 to 60% at the end of September 2008. The <strong>com</strong>pany’s current assets stood at JD 116.7<br />
million at the end of September 2008 <strong>com</strong>pared to current liabilities of JD 195 million. The quick ratio stood at 0.46 at the end of September 2008.<br />
The net working capital ratio stood at -19%; and the cash flow liquidity ratio was 25.6%.<br />
A key driver for the <strong>com</strong>pany’s excess current liabilities, is the “subscribers’ refundable deposits”. The amount is refunded to the subscribers when<br />
the service is disconnected. Taking into consideration that electricity is a vital utility with the <strong>com</strong>pany being the only distributor for electricity in its<br />
coverage area; the amounts refunded are expected to be limited if not zero. Should a subscriber disconnect the service for moving to another<br />
place, another subscriber would request reconnection of the service and deposit the amount required. Consequently, we deducted this amount<br />
from current liabilities when calculating the adjusted working capital. This had a positive impact on working capital. However, for 2007 and 9M<br />
2008, the working capital is still negative even after deduction of the refundable deposit.<br />
Cash Flow Statement<br />
Cash flow from operations reached JD 42 million for the first 9 months of 2008, <strong>com</strong>pared to JD 32 million in 2007. Cash flow from investments<br />
increased in the first 9 months of 2008, to reach JD 41 million, <strong>com</strong>pared to JD 32 million for 2007. Cash flow from financing activities amounted to<br />
JD 8.2 million in the first 9 months of 2008, versus JD 4.4 million for end of 2007.<br />
Jordan Electric Power Company has been maintaining its dividend distribution policy. The <strong>com</strong>pany distributed JD 0.12 dividends per share for 2007<br />
in addition to 6.06% as stock dividend. On March 3, 2009, the <strong>com</strong>pany announced that it will distribute cash dividends amounting to 10% of the<br />
nominal value (JD 0.10 per share) for the year 2008, in addition to 9% stock dividends. According to the <strong>com</strong>pany’s concession agreement,<br />
dividends per share including in<strong>com</strong>e tax should be between 7.5% and 16% of the nominal value. The dividend yield is 3.14% as of March 19, 2009.<br />
<strong>Awraq</strong> <strong>Investments</strong> <strong>www</strong>.<strong>awraq</strong>.<strong>com</strong> <strong>Tel</strong>: <strong>962</strong> 6 <strong>550</strong> 3803 Fax: <strong>962</strong> 6 <strong>550</strong> 3801 Toll Free: 080022248 P.O. Box 925102 Amman 11110 Jordan<br />
[4]
Figure 7: : JEPCO’s Revenues, Net Profit and Net Profit Margin<br />
JD Million<br />
Source: JEPCO<br />
Figure 9: Assets, Liabilities and Shareholders Equity<br />
JD million<br />
350<br />
300<br />
250<br />
200<br />
150<br />
100<br />
50<br />
Total Assets Total Liabilities Shareholders Equity<br />
500<br />
400<br />
300<br />
200<br />
100<br />
-<br />
-<br />
Source: JEPCO<br />
Total Revenues Net Profit Net Profit Margin<br />
4.6% 4.7% 4.7%<br />
186 209 232<br />
248<br />
186<br />
278<br />
297<br />
5.9%<br />
269<br />
316<br />
208 214 225<br />
62 70 82 91<br />
304<br />
3.8%<br />
9 10 11 16 12<br />
2003 2004 2005 2006 2007<br />
362<br />
305<br />
266<br />
3.0%<br />
422<br />
327<br />
96 95<br />
2003 2004 2005 2006 2007 9M 2008<br />
9<br />
9M<br />
2008<br />
7.0%<br />
6.0%<br />
5.0%<br />
4.0%<br />
3.0%<br />
2.0%<br />
1.0%<br />
0.0%<br />
Jordanian Electric Power Company (JEPCO)<br />
Figure 8: JEPCO’s Quarterly Revenues and Cost of Bought Power<br />
60.8 63.0<br />
75.4 80.0 72.3 69.9<br />
51.8 52.5 60.2 57.8 63.0 85.5 87.3<br />
69.9 76.1<br />
60.4<br />
97.6<br />
88.2<br />
78.5<br />
70.1 67.4<br />
60.4<br />
<strong>Awraq</strong> <strong>Investments</strong> <strong>www</strong>.<strong>awraq</strong>.<strong>com</strong> <strong>Tel</strong>: <strong>962</strong> 6 <strong>550</strong> 3803 Fax: <strong>962</strong> 6 <strong>550</strong> 3801 Toll Free: 080022248 P.O. Box 925102 Amman 11110 Jordan<br />
JD million<br />
140<br />
120<br />
100<br />
80<br />
60<br />
40<br />
20<br />
0<br />
Source: JEPCO<br />
50<br />
40<br />
30<br />
20<br />
10<br />
0<br />
-10<br />
-20<br />
-30<br />
-40<br />
-50<br />
Source: JEPCO<br />
Revenues<br />
Q1 06 Q2 06 Q3 06 Q4 06 Q1 07 Q2 07 Q3 07 Q4 07 Q1 08 Q2 08 Q3 08<br />
Figure 10: Cash Flow<br />
Cash Flow Operating<br />
29<br />
38<br />
32<br />
Bought Power<br />
120.3<br />
Investing Financing<br />
98.8<br />
-9.9<br />
2003<br />
-10.9<br />
2004<br />
-8.3<br />
2005<br />
-11.1 11.1<br />
2006<br />
-6.6<br />
2007 9M 2008<br />
-16.4 -18.2<br />
-25.5<br />
-32.0<br />
13<br />
32<br />
4.4<br />
36<br />
-41.8<br />
8.2<br />
[5]
Figure 11: Financial Ratios<br />
Ratio Sept 08 Sept 07<br />
Current Ratio 0.60<br />
Quick Ratio 0.46<br />
Net Working Capital Ratio -19%<br />
Cash flow liquidity ratio 25.6%<br />
Return on Assets 2.7%<br />
Return on Equity 11.1%<br />
Profit Margin (9m) 3.0%<br />
Earnings Per Share (trailing 12m) 0.106 0.143<br />
Asset Turnover Ratio 78%<br />
Account Receivables Turnover Ratio 5.32<br />
Total Debt to Equity Ratio 3.44<br />
Interest Coverage Ratio 76%<br />
Subscriber Contributions / Total Assets 26.4%<br />
Subscriber refundable deposits/ Current liabilities 26.9%<br />
Source: JEPCO, <strong>Awraq</strong> <strong>Investments</strong><br />
Figure 13: Capital Expenditure<br />
Million JD<br />
60<br />
50<br />
40<br />
30<br />
20<br />
10<br />
-<br />
Source: JEPCO<br />
19.00<br />
22.70<br />
CAPEX<br />
43.42<br />
2004 2005 2006<br />
50.36<br />
2007<br />
0.66<br />
0.56<br />
-15%<br />
40%<br />
4.2%<br />
15.4%<br />
4.4%<br />
67%<br />
5.03<br />
2.89<br />
8.82<br />
28%<br />
29.5%<br />
Jordanian Electric Power Company (JEPCO)<br />
Figure 12: Working Capital and Adjusted Working Capital<br />
9.57 7.39 7.59 3.98<br />
2003 2004 2005 2006 2007 9M 2008<br />
-22.15<br />
-27.32 -30.53<br />
-39.24 39.24<br />
<strong>Awraq</strong> <strong>Investments</strong> <strong>www</strong>.<strong>awraq</strong>.<strong>com</strong> <strong>Tel</strong>: <strong>962</strong> 6 <strong>550</strong> 3803 Fax: <strong>962</strong> 6 <strong>550</strong> 3801 Toll Free: 080022248 P.O. Box 925102 Amman 11110 Jordan<br />
Millions<br />
Current Assets - Current Liabilities<br />
Current Assets - Current Liabilities Excluding Refundable Deposits<br />
20<br />
-<br />
(20)<br />
(40)<br />
(60)<br />
(80)<br />
(100)<br />
Source: JEPCO, <strong>Awraq</strong> <strong>Investments</strong><br />
-56.95<br />
-9.17 -25.72<br />
-78.17<br />
[6]
Share Price Movement<br />
8<br />
7<br />
6<br />
5<br />
4<br />
3<br />
2<br />
1<br />
0<br />
1-Jan-08<br />
18-Jan-08<br />
4-Feb-08<br />
21-Feb-08<br />
9-Mar-08<br />
26-Mar-08<br />
12-Apr-08<br />
29-Apr-08<br />
16-May-08<br />
2-Jun-08<br />
19-Jun-08<br />
6-Jul-08<br />
23-Jul-08<br />
9-Aug-08<br />
26-Aug-08<br />
12-Sep-08<br />
29-Sep-08<br />
16-Oct-08<br />
2-Nov-08<br />
19-Nov-08<br />
6-Dec-08<br />
23-Dec-08<br />
9-Jan-09<br />
26-Jan-09<br />
12-Feb-09<br />
1-Mar-09<br />
18-Mar-09<br />
Source: Bloomberg<br />
JOEP JR Equity Amman Stock Exchange Index<br />
6000<br />
5000<br />
4000<br />
3000<br />
2000<br />
1000<br />
0<br />
Jordanian Electric Power Company (JEPCO)<br />
JEPCO’s share price movement was the most volatile in 2008 <strong>com</strong>pared to previous years. The share price recorded its highest level on July 13,<br />
2008, closing at JD 7.41. Following the decline in regional and international stock prices as a result of the financial crisis, the share lost 63% of<br />
its highest value by November 24, 2008, closing at JD 2.77. We believe that the rise in the share price was not related to the fundamentals of<br />
the <strong>com</strong>pany, but was rather an effect of the regional boom in stock prices. The <strong>com</strong>pany’s announcement that it will be distributing dividends<br />
had a positive impact on the share price. The share closed at JD 3.17 on March 18, 2009.<br />
Figure 14: JEPCO’s Share versus Amman Stock Exchange Index<br />
Figure 15: Jordanian Electric Power Company’s Share Price<br />
Source: Bloomberg<br />
<strong>Awraq</strong> <strong>Investments</strong> <strong>www</strong>.<strong>awraq</strong>.<strong>com</strong> <strong>Tel</strong>: <strong>962</strong> 6 <strong>550</strong> 3803 Fax: <strong>962</strong> 6 <strong>550</strong> 3801 Toll Free: 080022248 P.O. Box 925102 Amman 11110 Jordan<br />
JD<br />
8<br />
7<br />
6<br />
5<br />
4<br />
3<br />
2<br />
1<br />
0<br />
Jordanian Electric Power Company<br />
Annual High and Low Prices<br />
1.77<br />
1.11<br />
2.77<br />
1.76<br />
4.06<br />
2.77<br />
3.64<br />
2.39<br />
4.15<br />
2.44<br />
7.41<br />
2.77<br />
3.21<br />
2.95<br />
2003 2004 2005 2006 2007 2008 2009<br />
[7]
JEPCO’s Potential Peers<br />
Jordanian Electric Power Company (JEPCO)<br />
The <strong>com</strong>panies we considered are: Saudi Electricity Company, Abu Dhabi National Energy Company, Qatar Electricity and Water, and Irbid District<br />
Electricity. JEPCO distributes electricity to specified regions in Jordan, and not to all the country, and it does not generate electricity. As for the other<br />
<strong>com</strong>panies:<br />
• Saudi Electricity Company (Ticker: SECO AB): Is responsible for generation, transmission, and distribution of electricity in Saudi Arabia.<br />
• Abu Dhabi National Energy Company (Ticker: TAQA) is a Global energy <strong>com</strong>pany with operations in power generation, water desalination,<br />
upstream oil/ gas, pipelines, gas storage and LNG regas. Its revenues extend outside UAE. TAQA is investment arm of Abu Dhabi Water and<br />
Electricity Authority (ADEWA), which produces, transmits, and distributes water and electricity in Abu Dhabi to more than 1.4 million customers.<br />
• Qatar Electricity and Water (Ticker: QEWS QD) Generates electricity and desalinates water. The <strong>com</strong>pany sells its electricity and water to the<br />
government<br />
• Irbid District Electricity (Ticker: IREL JR) distributes electricity in the northern part of Jordan. Its share price increased after it was acquired by<br />
Kingdom Electricity Company, a subsidiary of Jordan Dubai Capital). It has a paid up capital of JD 4 million in 2007. Its share price closed at JD<br />
7.35 on March 4, 2009.<br />
Based on the above, we excluded the P/E, P/BV, and EV/EBITDA peer analysis, due to differences in size and operation for considered possible peers<br />
with operations including electricity distribution.<br />
Figure 16: JEPCO’s Stock Price versus Peers<br />
JD, SR, AED<br />
18<br />
16<br />
14<br />
12<br />
10<br />
8<br />
6<br />
4<br />
2<br />
0<br />
1/1/2008<br />
TAQA<br />
1/22/2008<br />
2/12/2008<br />
Source: Bloomberg<br />
Saudi Electricity<br />
JEPCO<br />
3/4/2008<br />
3/25/2008<br />
4/15/2008<br />
5/6/2008<br />
5/27/2008<br />
6/17/2008<br />
7/8/2008<br />
7/29/2008<br />
8/19/2008<br />
Qatar Electricity and Water<br />
9/9/2008<br />
9/30/2008<br />
Irbid District Electricity<br />
10/21/2008<br />
11/11/2008<br />
12/2/2008<br />
12/23/2008<br />
1/13/2009<br />
2/3/2009<br />
2/24/2009<br />
3/17/2009<br />
<strong>Awraq</strong> <strong>Investments</strong> <strong>www</strong>.<strong>awraq</strong>.<strong>com</strong> <strong>Tel</strong>: <strong>962</strong> 6 <strong>550</strong> 3803 Fax: <strong>962</strong> 6 <strong>550</strong> 3801 Toll Free: 080022248 P.O. Box 925102 Amman 11110 Jordan<br />
1.8<br />
1.6<br />
1.4<br />
1.2<br />
1<br />
0.8<br />
0.6<br />
0.4<br />
0.2<br />
0<br />
100 QR<br />
[8]
Valuation<br />
Our valuation for JEPCO is based on the Discounted Cash Flow model and the Dividend Discount Model.<br />
Jordanian Electric Power Company (JEPCO)<br />
Revenues from energy sales are expected to increase by 10% in 2009. We expect the <strong>com</strong>pany’s gross profit margin to improve along with a decline<br />
in cost of purchased power as a percent of revenues. This is due to the higher increase in tariffs to end users <strong>com</strong>pared to the increase in tariffs paid<br />
to NEPCO. The <strong>com</strong>pany’s capital is expected to be JD 80 million for 2009, and will gradually increase to reach JD 100 million in 2011.<br />
Capital expenditure stood at JD 19 million in 2004 and JD 22 million in 2005. There was a significant increase in CAPEX in 2006, along with the<br />
increase in construction projects. CAPEX reached JD 43.4 million in 2006 and JD 50.36 million in 2007. Due to the decline in real estate projects as a<br />
result of the current financial crisis, CAPEX is expected to go back to JD 25 million levels between 2009 and 2013. The <strong>com</strong>pany obtained a 3 year<br />
JD 15 million loan in 2008.<br />
The <strong>com</strong>pany had previously received a claim from the sales tax department for JD 7,343,070, with twice the amount as a fine (JD 14,686,141). The<br />
<strong>com</strong>pany objected and the case was brought to courts. So far the case is in favor of JOEP. The <strong>com</strong>pany received an adjusted sales tax claim, which is<br />
91% below the original value of the claim. The adjusted claim is JD 627,768, in addition to twice the amount as a fine (JD 1,255,536).<br />
Based on the Discounted Cash flow model, the long term fair of JOEP is JD 3.79. This is based on a cost of equity of 11%, weighted average cost of<br />
capital of 9% and terminal growth rate of 3%. The Dividend Discount Model yielded JD 1.5 per share. Applying a weight of 70% to the DCF model and<br />
30% to the DDM model, we obtained a weighted fair value of JD 3.11. This is 2.3% below the share price on March 19, 2009, which closed at JD 3.18.<br />
The share price is subject to potential dilution, given the up<strong>com</strong>ing stock dividend which is expected to be approved during the General Assembly<br />
meeting which will be held on April 29, 2009.<br />
Figure 17: Valuation<br />
Model<br />
Ke = 11%, WACC = 9%, G=3%<br />
Valuation (JD) Weight<br />
Weighted<br />
Valuation (JD)<br />
DCF 3.79 70% 2.66<br />
DDM 1.50 30% 0.45<br />
Valuation Price 3.11<br />
Date 19/3/2009<br />
JEPCO’s Share Price 3.18<br />
Valuation vs Market Price %<br />
Source: <strong>Awraq</strong> <strong>Investments</strong><br />
-2.3%<br />
Figure 18: Sensitivity Analysis<br />
Terminal Growth<br />
Rate<br />
Source: <strong>Awraq</strong> <strong>Investments</strong><br />
Based on this valuation, our re<strong>com</strong>mendation for Jordanian Electric Power Company is HOLD.<br />
Weighted Valuation (70% DCF, 30% DDM)<br />
Cost of Equity 12.0% 11.0% 10.0% 9.0%<br />
4% 3.01 3.49 4.12 5.01<br />
3% 2.73 3.11 3.60 4.25<br />
2% 3.71 2.81 3.20 3.71<br />
<strong>Awraq</strong> <strong>Investments</strong> <strong>www</strong>.<strong>awraq</strong>.<strong>com</strong> <strong>Tel</strong>: <strong>962</strong> 6 <strong>550</strong> 3803 Fax: <strong>962</strong> 6 <strong>550</strong> 3801 Toll Free: 080022248 P.O. Box 925102 Amman 11110 Jordan<br />
[9]
Structure of the Electricity Sector in Jordan<br />
Jordanian Electric Power Company (JEPCO)<br />
The electricity sector in Jordan is divided into three main parts: Generation, Transmission, and Distribution. Electricity generation and distribution<br />
are privatized, while transmission will be kept within the government’s control.<br />
Electricity Generation<br />
• Central Electricity Generation Company (CEGCO). The <strong>com</strong>pany was privatized on October 10, 2007. The government sold 60% of its<br />
share in the <strong>com</strong>pany to Enara, a <strong>com</strong>pany established by JD Energy & Infrastructure (JDE&I), the energy investment arm of Jordan Dubai<br />
Capital.<br />
• Samra Electric Power Generation Company (SEPGCO)<br />
• Independent Power Providers<br />
Transmission<br />
National Electric Power Company (NEPCO): Is fully owned by the government. It is responsible for building, operation and maintenance of the<br />
transmission system.<br />
Distribution<br />
Three <strong>com</strong>panies are in charge of distribution:<br />
• The Jordanian Electric Power Company (JEPCO, Ticker: JOEP JR): Distributes electricity in Amman, Zarqa, Madaba, and Balqa governorates<br />
except for Central Jordan Valley. It has a 50 year concession which ends in 2012.<br />
• Irbid District Electricity Company (IDECO, Ticker: IREL JR): Distributes electricity in Irbid, Mafraq, Jarash and Ajloun, apart from Northern<br />
Jordan Valley and eastern areas. Its 50 year concession contract will end in 2011. The government sold 55.4% of its share to Kingdom<br />
Electricity Company, a <strong>com</strong>pany established by JDE&I in partnership with Privatization Holding Company (PHC, Kuwait) and United Arab<br />
Investors (Ticker: UAIC JR).<br />
• Electricity Distribution Company (EDCO): Distributes electricity in the Southern, Eastern and Jordan Valley areas. The government sold<br />
100% of its shares to Kingdom Electricity Company. This <strong>com</strong>pany is not listed on Amman stock exchange.<br />
The distribution <strong>com</strong>panies buy energy from NEPCO. JEPCO’s purchased energy increased by 15.5% in 2007 to reach 7104 GWh that year. This<br />
represents 66% of NEPCO’s total energy sales to distribution <strong>com</strong>panies in Jordan, which amounted to 10776.8 GWh. EDCO consumed 2022 GWh<br />
(18.8% of energy sales), while IDECO consumed 1649.5GWh (15% of total energy sales). NEPCO’s sales to distribution <strong>com</strong>panies <strong>com</strong>prise 91% of<br />
total energy sales. NEPCO also sells electricity to large consumers and sells electricity to Egypt.<br />
<strong>Awraq</strong> <strong>Investments</strong> <strong>www</strong>.<strong>awraq</strong>.<strong>com</strong> <strong>Tel</strong>: <strong>962</strong> 6 <strong>550</strong> 3803 Fax: <strong>962</strong> 6 <strong>550</strong> 3801 Toll Free: 080022248 P.O. Box 925102 Amman 11110 Jordan<br />
[10]
Figure 19: Number of Electricity Subscribers by Type of Consumption & Distribution Companies’ Market Share (2007)<br />
Distribution Company<br />
Domestic Industrial Commercial Watar<br />
Pumping<br />
Jordanian Electric Power Company (JEPCO)<br />
<strong>Awraq</strong> <strong>Investments</strong> <strong>www</strong>.<strong>awraq</strong>.<strong>com</strong> <strong>Tel</strong>: <strong>962</strong> 6 <strong>550</strong> 3803 Fax: <strong>962</strong> 6 <strong>550</strong> 3801 Toll Free: 080022248 P.O. Box 925102 Amman 11110 Jordan<br />
Street<br />
Lighting<br />
Distribution<br />
Companies<br />
National Electric Power Company NEPCO 0.007 0.003<br />
Thousands<br />
0.003 0.01<br />
Jordanian Electric Power<br />
Company<br />
JEPCO 689.72 10.23 119.01 1.34 4.15 824.45<br />
Irbid District Electricity Company IDECO<br />
244.67 3.27 31.42 1.60 1.64 282.59<br />
Electricity Distribution Company EDCO 130.90 1.38 18.30 2.74 1.13 154.46<br />
Source: NEPCO<br />
Market Share<br />
Total 1065.292 14.891 168.736 5.68 6.911 0.003 1261.513<br />
JEPCO 64.7% 68.7% 70.5% 23.6% 60.0% 65.4%<br />
IDECO 23.0% 22.0% 18.6% 28.1% 23.7% 22.4%<br />
EDCO 12.3% 9.3% 10.8% 48.3% 16.3% 12.2%<br />
Total Coverage area<br />
Amman, Zarqa,<br />
Madaba, Balqa<br />
Irbid, Mafraq, Jarash,<br />
Ajloun<br />
South, East and Jordan<br />
Valley<br />
[11]
Appendix<br />
Figure 20: JEPCO’s Tariff Changes between 2004 and 2008<br />
1/1/2004 to<br />
2/4/2004<br />
3/4/2004 to<br />
31/5/2004<br />
1/6/2004 to<br />
8/7/2005<br />
Jordanian Electric Power Company (JEPCO)<br />
9/7/2005 to<br />
13/3/2008<br />
As of<br />
14/3/2008<br />
Latest<br />
increase %<br />
Increase in prices<br />
(Fils)<br />
1 Bulk Supply Tariffs<br />
Peak Load (JD/Kw/Month) 2.40 2.40 2.40 2.40 2.40 0% 0<br />
Day energy (Fils/KWh) 31.3 31.7 31.7 34.3 45.8 34% 12<br />
Night energy (Fils/KWh) 21.2 21.7 21.7 24.3 35.8 47% 12<br />
2 Retail Tariffs<br />
Domestic (Fils/ Kwh)<br />
First Block: From 1-160Kwh/Month 31.0 31.0 31.0 31.0 32.0 3% 1<br />
a. Second Block: From 161-300Kwh/Month 55.0 57.0 57.0 59.0 71.0 20% 12<br />
Third Block: From 301-500 KWh/Month 64.0 65.0 65.0 67.0 85.0 27% 18<br />
Fourth Block: More than 500 KWh/Month<br />
Falt rate Tariff for TV and Broadcasting<br />
80.0 80.0 80.0 82.0 113.0 38% 31<br />
b. stations Fils/ KWh 60.0 60.0 60.0 61.0 86.0 41% 25<br />
c. Commercial (Fils/ KWh) 62.0 62.0 62.0 63.0 86.0 37% 23<br />
d. Small Industries (Fils/ KWh)<br />
Medium industries<br />
38.0 39.0 39.0 41.0 49.0 20% 8<br />
e.<br />
Peak load (JD/Kw/Month)<br />
Day Energy (Fils/ KWh)<br />
3.1 3.1 3.1 3.1<br />
30.0<br />
3.8<br />
46.0<br />
24%<br />
53%<br />
1<br />
16<br />
Night Energy (Fils/ KWh) 20.0 36.0 80% 16<br />
g. Water Pumping (Fils/ KWh) 38.0 38.0 38.0 40.0 41.0 3% 1<br />
Hotels (Fils / KWh) * 60.0 59.0 59.0 60.0 86.0 43% 26<br />
Peak load (JD/ KW/Month)<br />
3.1 3.1 3.8 24% 1<br />
Day Energy (Fils/ KWh) 55.0 56.0 81.0 45% 25<br />
h. Night Energy (Fils /KWh)<br />
44.0 45.0 70.0 56% 25<br />
i. Street Lighting (Fils / KWh) |** 25.0 27.0 27.0 30.0 51.0 70% 21<br />
j. Armed Forces (Fils/ KWh) 67.0 67.0 67.0 67.0 81.0 21% 14<br />
k. Ports Corporation (Fils/ Kwh) 44.6 44.6 44.6 58.0 30% 13<br />
Average<br />
Notes<br />
Monthly Minimum Charge<br />
42.5 43.0 41.6 41.1 55.4 34% 14<br />
a. Domestic (JD/ Month) 1.0 1.0 1.0 1.0 1.0 0% 0<br />
b. Other Consumers (JD / Month) 1.3 1.3 1.3 1.3 1.3 0% 0<br />
* The 5 & 4 Star Hotels can choose between 3 categories tariff or continue using the Flat rate tariff<br />
** Applied for Consumption which Exceeds the Average Level of 1988 Consumption<br />
Source: NEPCO<br />
<strong>Awraq</strong> <strong>Investments</strong> <strong>www</strong>.<strong>awraq</strong>.<strong>com</strong> <strong>Tel</strong>: <strong>962</strong> 6 <strong>550</strong> 3803 Fax: <strong>962</strong> 6 <strong>550</strong> 3801 Toll Free: 080022248 P.O. Box 925102 Amman 11110 Jordan<br />
[12]
Figure 21: Wholesale Electricity Tariffs paid by JEPCO to NEPCO<br />
Electric utility<br />
<strong>com</strong>panies<br />
2003<br />
9/7/2005-<br />
30/6/2007<br />
Starting<br />
1/7/2007<br />
Latest<br />
increase %<br />
Latest<br />
increase (Fils)<br />
A1: Maximum load JD/KW/month 2.40 2.40 2.40 0.0% 0.00<br />
A2: Day supply Fils/Kwh 31.40 34.30 35.41 3.2% 1.11<br />
A3: Night supply<br />
Source: JEPCO<br />
Fils/Kwh 21.40 24.25 25.36 4.6% 1.11<br />
Jordanian Electric Power Company (JEPCO)<br />
<strong>Awraq</strong> <strong>Investments</strong> <strong>www</strong>.<strong>awraq</strong>.<strong>com</strong> <strong>Tel</strong>: <strong>962</strong> 6 <strong>550</strong> 3803 Fax: <strong>962</strong> 6 <strong>550</strong> 3801 Toll Free: 080022248 P.O. Box 925102 Amman 11110 Jordan<br />
[13]
Disclaimer<br />
Jordanian Electric Power Company (JEPCO)<br />
<strong>Awraq</strong> <strong>Investments</strong> and its affiliates obtain information from sources they believe to be reliable, but do not warrant its accuracy or fitness for<br />
a particular purpose, and disclaim for themselves and their information providers all liability arising from the use.<br />
The Information in this publication is provided in good faith for informational purposes only. The information provided is not offered as tax,<br />
legal, or investment advice, or an offer to buy or sell securities or otherwise. The information provided in this publication may be displayed<br />
and printed for your personal, non-<strong>com</strong>mercial use only. You may not reproduce, re-transmit, distribute, disseminate, sell, publish, broadcast,<br />
or circulate the information in any form or media to anyone, without the expressed written consent of <strong>Awraq</strong> <strong>Investments</strong>.<br />
<strong>Awraq</strong> <strong>Investments</strong> is not liable for any loss resulting from any action taken or reliance made by any person on any information or material<br />
posted by it. You should make your own inquiries and seek independent advice from relevant industry professionals before acting or relying<br />
on any information or material made available to you in this publication. You rely on this information at your own risk.<br />
<strong>Awraq</strong> <strong>Investments</strong>, its subsidiaries, parent, and/or any connected parties, may act or trade and/or enter into any transaction that maybe<br />
inconsistent or disregard any information contained herein.<br />
Source: <strong>Awraq</strong> <strong>Investments</strong><br />
<strong>Awraq</strong> <strong>Investments</strong> <strong>www</strong>.<strong>awraq</strong>.<strong>com</strong> <strong>Tel</strong>: <strong>962</strong> 6 <strong>550</strong> 3803 Fax: <strong>962</strong> 6 <strong>550</strong> 3801 Toll Free: 080022248 P.O. Box 925102 Amman 11110 Jordan<br />
[14]