5. Documenting features of written language production typical ... - ielts
5. Documenting features of written language production typical ... - ielts
5. Documenting features of written language production typical ... - ielts

You also want an ePaper? Increase the reach of your titles
YUMPU automatically turns print PDFs into web optimized ePapers that Google loves.
<strong>Documenting</strong> <strong>features</strong> <strong>of</strong> <strong>written</strong> <strong>language</strong> <strong>production</strong> <strong>typical</strong> at IELTS band levels – Banerjee, Franceschina + SmithAUTHOR BIODATAJAYANTI BANERJEEJayanti Banerjee is a lecturer at Lancaster University. She has published in Language Teaching andthe Journal <strong>of</strong> English for Academic Purposes. She has also contributed chapters to edited collectionssuch as Experimenting with uncertainty: Essays in honour <strong>of</strong> Alan Davies, C Elder et al (eds) (2001),Cambridge University Press. Her main interests are <strong>language</strong> testing and assessment and English foracademic purposes.FLORENCIA FRANCESCHINAFlorencia Franceschina is a lecturer at Lancaster University. Her main research interests are <strong>language</strong>acquisition and its relation to theoretical linguistics, especially learnability, route <strong>of</strong> development andthe influence <strong>of</strong> a speaker’s first <strong>language</strong> on second <strong>language</strong> development and attainment in thedomain <strong>of</strong> morphosyntax. Her empirical work has focused on the acquisition <strong>of</strong> syntax in veryadvanced second <strong>language</strong> speakers, and this is the theme <strong>of</strong> her monograph Fossilized second<strong>language</strong> grammars (2005, John Benjamins). She and other colleagues (including the co-authors <strong>of</strong>this report) are currently developing a longitudinal corpus <strong>of</strong> L2 writing.ANNE MARGARET SMITHAnne Margaret Smith has completed her PhD, which was supervised jointly by the departments <strong>of</strong>Linguistics and English Language and Educational Research at Lancaster University. Her thesis is asynthesis <strong>of</strong> two <strong>of</strong> her main research interests – teacher training (for <strong>language</strong> teachers) and inclusiveeducation. Other interests include second <strong>language</strong> acquisition, learning differences and disabilities,and teacher expertise.© IELTS Research Reports Volume 7 3
<strong>Documenting</strong> <strong>features</strong> <strong>of</strong> <strong>written</strong> <strong>language</strong> <strong>production</strong> <strong>typical</strong> at IELTS band levels – Banerjee, Franceschina + Smith1 INTRODUCTION1.1 ContextThe fields <strong>of</strong> <strong>language</strong> testing and second <strong>language</strong> acquisition (SLA) have regularly and publiclydiscussed the benefits <strong>of</strong> co-operation (cf Hyltenstam and Pienemann, 1985; Bachman and Cohen,1998; Shohamy, 1998; Ellis, 2001; Douglas, 2001 and Laufer, 2001). One area that stands to benefitfrom collaborative research is the development <strong>of</strong> performance scales and rating scales. In particular,we might ask how the operationalisation <strong>of</strong> competence levels, as expressed in a rating scale, is relatedto what is known about L2 developmental stages and what the pr<strong>of</strong>ile <strong>of</strong> linguistic pr<strong>of</strong>iciency mightbe <strong>of</strong> students who perform at different levels <strong>of</strong> the scale.1.2 Research rationaleThe International English Language Testing System (IELTS) Writing scales have recently beenrevised towards a more analytical style (Shaw, 2002, pp 12). Consequently, the availability <strong>of</strong> moredetailed descriptions <strong>of</strong> <strong>written</strong> <strong>language</strong> ability at each band level seems highly desirable. In a report<strong>of</strong> revisions to the IELTS Writing assessment criteria and scales, Shaw (2004) lists some <strong>of</strong> the key<strong>features</strong> that a good scale should have.Among the desiderata is a scale’s ability to:• capture the essential qualities <strong>of</strong> learner <strong>written</strong> performance• accurately describe how writing abilities progress with increasing pr<strong>of</strong>iciency• clearly distinguish all the band levels.Clearly, the better our understanding <strong>of</strong> what these essential qualities are, how they are manifested atdifferent levels, and how sensitive they are to performance factors such as task effect, the better wewill understand the L2 writing construct (eg Weigle, 2002; Hawkey and Barker, 2004) and the moreeffective any assessment criteria and scales based on our descriptions will be. A sophisticatedlinguistic description <strong>of</strong> <strong>typical</strong> performance at each level would be able to define the linguisticcharacteristics that mark one level <strong>of</strong> performance from another. Such a description would also allowtest developers to make descriptors more detailed. This would be well received by IELTS raters (Shaw,2004, pp 6).1.3 Research objectivesThis study aims to document the linguistic markers <strong>of</strong> the different levels <strong>of</strong> English <strong>language</strong> writingpr<strong>of</strong>iciency defined by the academic version <strong>of</strong> the IELTS Writing module. The IELTS test (AcademicVersion) is administered in approximately 122 countries worldwide (http://www.<strong>ielts</strong>.org) and is usedto assess the English <strong>language</strong> pr<strong>of</strong>iciency <strong>of</strong> non-native speakers <strong>of</strong> English who are planning tostudy at English-medium, tertiary-level institutions. The Academic Writing module, which is the focus<strong>of</strong> this study, is one <strong>of</strong> four modules (Listening, Reading, Writing and Speaking) and comprises twotasks (IELTS Handbook, 2005, pp 8-9). Test-takers are graded separately on both tasks using ananalytic scale. Their final band for the Writing module is a weighted average <strong>of</strong> these two marks(where the second task is weighted more than the first).Our original plan was to examine performances across all bands but performances at levels 1, 2 and 9were not available so we examined scripts at band levels 3–8 only.© IELTS Research Reports Volume 7 4
<strong>Documenting</strong> <strong>features</strong> <strong>of</strong> <strong>written</strong> <strong>language</strong> <strong>production</strong> <strong>typical</strong> at IELTS band levels – Banerjee, Franceschina + SmithThe central questions that the study addresses are:1. What are the defining characteristics <strong>of</strong> <strong>written</strong> <strong>language</strong> performance at each IELTSband with regards to:a. frequency, type and function <strong>of</strong> cohesive devices usedb. vocabulary richnessc. syntactic complexityd. grammatical accuracy2. How do these <strong>features</strong> <strong>of</strong> <strong>written</strong> <strong>language</strong> change from one IELTS level to the nextacross the 3–8 band range?3. What are the effects <strong>of</strong> L1 and writing task type on the measures <strong>of</strong> pr<strong>of</strong>iciencyunder (1)?We narrowed down and organised the target linguistic <strong>features</strong> in such a way as to cover a range <strong>of</strong>key areas <strong>of</strong> <strong>language</strong> and also to allow other users <strong>of</strong> this research to establish links with otherframeworks, such as Cambridge ESOL’s Common Scale for Writing (see Hawkey and Barker, 2004)and the Common European Framework <strong>of</strong> Reference for Languages (Council <strong>of</strong> Europe, 2001).We also take into consideration how the learners’ first <strong>language</strong> and the type <strong>of</strong> task may affect theirperformances at different levels.This report describes the completed study and discusses its main findings. It begins with an overview<strong>of</strong> the literature pertaining to analytic measures <strong>of</strong> L2 pr<strong>of</strong>iciency, previous research into the linguistic<strong>features</strong> that characterise different IELTS band levels and a discussion <strong>of</strong> potential intervening factorssuch as L1 and task effects. It then presents the design issues arising during the study and gives a fulldescription <strong>of</strong> the final sample and the background data collected for each test-taker. Subsequentsections present the analyses for each target area <strong>of</strong> <strong>language</strong>: cohesive devices; vocabulary richness;syntactic complexity; and grammatical accuracy. The final section summarises and discusses thefindings and their implications for further research.2 LITERATURE REVIEWThe question <strong>of</strong> what characterises the <strong>written</strong> <strong>language</strong> <strong>of</strong> different IELTS band levels could beinvestigated in at least two ways. One approach would be to study writing descriptors and raterbehaviour and perceptions (see McNamara, 1996, chapter 5 for examples <strong>of</strong> how this can be done).A second approach consists <strong>of</strong> investigating <strong>written</strong> performances that have been placed at differentband levels with the aim <strong>of</strong> discovering the linguistic <strong>features</strong> that scripts placed at each level have incommon. The present study adopts the second type <strong>of</strong> approach, building on previous work byKennedy and Thorp (2002) and Mayor et al (2002).2.1 Analytic measures <strong>of</strong> developing L2 pr<strong>of</strong>iciencyLarsen-Freeman (1978, pp 440) suggests that the ideal measure <strong>of</strong> linguistic ability should ‘increaseuniformly and linearly as learners proceed towards full acquisition <strong>of</strong> a target <strong>language</strong>’.This preference seems justified, as pr<strong>of</strong>iciency scales are <strong>typical</strong>ly linear. However, the expectationthat the rate <strong>of</strong> progress will be uniform within and across individuals and that all areas <strong>of</strong> <strong>language</strong>will make uniform progress is not justified by the research evidence available at present. For instance,the rate <strong>of</strong> L2 development can vary markedly from one individual to another (eg Perdue and Klein,1993; Skehan, 1989; Slav<strong>of</strong>f and Johnson, 1995), and the close link between the development <strong>of</strong> agiven property X and the subsequent development <strong>of</strong> another property Y that is <strong>typical</strong> <strong>of</strong> first<strong>language</strong> acquisition is not always found in second/foreign <strong>language</strong> acquisition (eg Clahsen andMuysken, 1986, 1989; Meisel, 1997). Therefore, we do not think that the requirement to increaseuniformly is necessary, desirable or indeed defensible. Consequently, a more realistic pursuit would be© IELTS Research Reports Volume 7 5
<strong>Documenting</strong> <strong>features</strong> <strong>of</strong> <strong>written</strong> <strong>language</strong> <strong>production</strong> <strong>typical</strong> at IELTS band levels – Banerjee, Franceschina + Smithto look for the ideal group <strong>of</strong> measures that, when applied together, produced a learner <strong>language</strong>pr<strong>of</strong>ile that could be reliably classified as being at a given level in a predetermined scale.Wolfe-Quintero et al’s thorough meta-study <strong>of</strong> fluency, accuracy and complexity measures <strong>of</strong> L2writing pr<strong>of</strong>iciency (1998, pp 119) suggests a number <strong>of</strong> measures that could be pr<strong>of</strong>itablyinvestigated:• words per t-unit (see section <strong>5.</strong>1 for a definition)• words per clause• words per error-free t-unit• clauses per t-unit• dependent clauses per clause• word type measure• sophisticated word type measure• error-free t-unit per t-unit• errors per t-unit.2.2 Linguistic <strong>features</strong> characteristic <strong>of</strong> each IELTS band levelIn this section we consider studies that have investigated measures <strong>of</strong> pr<strong>of</strong>iciency in a context moreclosely related to ours. These studies augment the selection <strong>of</strong> measures suggested by Wolf-Quinteroet al (1998).Mayor et al (2002, pp 46) found that the strongest predictors <strong>of</strong> band score in Writing Task 2performances were the ones listed below.• word count• error rate• complexity• pattern <strong>of</strong> use <strong>of</strong> the impersonal pronoun ‘one’.Kennedy and Thorp (2002) confirmed these findings and found the following further trend:• overt cohesive devices were used more frequently at IELTS levels 4 and 6 and less atlevels 8 and 9, where cohesion was expressed more frequently through other meansmore generally in line with the native speaker norm; these findings are similar to those<strong>of</strong> Flowerdew (1998, cited in Kennedy and Thorp, 2002, pp 102).The following were not good predictors <strong>of</strong> band score:• type <strong>of</strong> theme (Mayor et al, 2002, pp 21)• punctuation errors (Mayor et al, 2002, pp 6)• number <strong>of</strong> t-units containing at least one dependent clause (Mayor et al, 2002, pp 14);this is at odds with the findings <strong>of</strong> Wolfe-Quintero et al’s (1998) meta-study anddeserves further investigation.Despite the fact that these studies were able to identify some strong predictors <strong>of</strong> band level in their<strong>written</strong> performances, there seemed to be a complex network <strong>of</strong> interactions between some <strong>of</strong> thevariables under investigation, and so the interpretation <strong>of</strong> their findings should not be oversimplifiedand generalised indiscriminately. In the next section (see 2.3, below) we discuss some <strong>of</strong> thepotentially interacting variables that should not be ignored.© IELTS Research Reports Volume 7 6
<strong>Documenting</strong> <strong>features</strong> <strong>of</strong> <strong>written</strong> <strong>language</strong> <strong>production</strong> <strong>typical</strong> at IELTS band levels – Banerjee, Franceschina + SmithHawkey and Barker (2004) also carried out a careful analysis <strong>of</strong> <strong>written</strong> performances at differentlevels with the aim <strong>of</strong> identifying <strong>features</strong> characteristic <strong>of</strong> each level. This study did not use IELTSband levels but rather the current FCE marking scheme and the 5 levels <strong>of</strong> the Cambridge ESOLCommon Scale for Writing (CSW). This was applied to 108 FCE scripts, 113 CAE scripts and 67 CPEscripts (total <strong>of</strong> 288 scripts or 53,000 words). After a thorough rating procedure, the scripts that wereunanimously placed at levels 2 (n = 8), 3 (n = 43), 4 (n = 18) and 5 (n = 29) <strong>of</strong> the scale were retainedfor further analysis (total <strong>of</strong> 98 scripts or 18,000 words).Hawkey and Barker used the categories developed using an intuitive approach to the remarking <strong>of</strong> the98 scripts in the subcorpus for proposing a new draft scale for writing. The criteria for identifyinglevels that they proposed after this intuitive marking process were based on the following groups <strong>of</strong>linguistic <strong>features</strong>:• sophistication <strong>of</strong> <strong>language</strong>• accuracy• organisation and cohesionThe <strong>features</strong> that we have investigated relate directly to these categories, as shown in Table 2.1.Hawkey and Barker (2004)/CSW <strong>features</strong>Sophistication <strong>of</strong> <strong>language</strong>AccuracyOrganisation and cohesionFeatures investigated in the present studySyntactic complexityVocabulary richnessGrammatical accuracyCohesive devicesTable 2.1: Comparison <strong>of</strong> Hawkey and Barker (2004)/CSW target <strong>features</strong> andthose in the present studyThese <strong>features</strong> are present in the IELTS Academic Writing scales as Vocabulary and SentenceStructure (VSS) and Coherence and Cohesion/Communicative Quality (CC/CQ). In fact, these<strong>features</strong> seem to underpin several other pr<strong>of</strong>iciency and rating scales. For example, the CommonEuropean Framework <strong>of</strong> Reference for Languages: Learning, teaching, assessment (CEFR) scales arefull <strong>of</strong> references to these key <strong>features</strong>. The reader can find evidence <strong>of</strong> how important these <strong>features</strong>are in this framework in the CEFR manual, for instance in the illustrative global scale (2001, pp 24)and the scales for overall <strong>written</strong> <strong>production</strong> (2001, pp 61), general linguistic range (2001, pp 110),vocabulary range (2001, pp 112), and grammatical accuracy (2001, pp 114).2.3 Potential intervening factorsWhile the <strong>features</strong> mentioned above seem to be relatively good predictors <strong>of</strong> IELTS band score, it hasbeen found that a number <strong>of</strong> other variables can affect the scores in different ways. This studyaddressed two <strong>of</strong> these potential intervening variables: L1 effect and task effect.© IELTS Research Reports Volume 7 7
<strong>Documenting</strong> <strong>features</strong> <strong>of</strong> <strong>written</strong> <strong>language</strong> <strong>production</strong> <strong>typical</strong> at IELTS band levels – Banerjee, Franceschina + Smith2.3.1 L1 effectsThe role <strong>of</strong> the L1 on L2 development is well documented in the SLA literature (see Odlin 2003 for anoverview), and the available evidence leads one to expect that the L1 will have some effect on specificL2 pr<strong>of</strong>iciency measures. It is therefore not surprising that L1 transfer has been found to have someclear and specific effects on L2 writing performance. For example, Mayor et al (2002) found that theL1 (Chinese vs Greek) affected Writing Task 2 performances in the following areas:• complexity: this was measured as number <strong>of</strong> embedded clauses and the results showedthat the L1 had significant effects on the type <strong>of</strong> clauses used by the learners, whileband level did not make a significant difference (2002, pp 14)• grammar errors: low-scoring Chinese L1 scripts had significantly more grammaticalerrors than comparable Greek L1 scripts (2002, pp 7 and 10)• use <strong>of</strong> themes: L1 Chinese writers use more t-units and therefore more themes(2002, pp 25).The writer’s L1 did not seem to have an observable effect on the following:• spelling errors (pp 7)• punctuation errors (pp 7)• preposition errors (pp 7)• lexical errors (pp 7)• overall number <strong>of</strong> errors (pp 7).This study will make systematic analyses <strong>of</strong> possible L1 effects for each measure investigated.2.3.2 Task effectsMayor et al (2002) compared the performances <strong>of</strong> L1 Chinese and L1 Greek speakers on two versions<strong>of</strong> Writing Task 2 and found that the candidates’ performances were similar on the two versions acrosslevels overall. Nevertheless, some differences were found between the performances on each version<strong>of</strong> the test as follows:• error frequency in different categories was comparable, except for preposition andlexis/idiom errors (2002, pp 10)• number <strong>of</strong> t-units that included dependent clauses (2002, pp 14 and 47).Unfortunately it was not possible to collect a balanced selection <strong>of</strong> test versions for the present study(primarily because we prioritised the variables band level and L1 over test version), so we will notconduct comparisons across different test versions. We will examine potential task effects byanalysing Task 1 and Task 2 scripts separately and establish comparisons where relevant.3 RESEARCH DESIGNThe purpose <strong>of</strong> the study was to explore the defining characteristics <strong>of</strong> <strong>written</strong> <strong>language</strong> performanceat each IELTS band level with regard to cohesive devices used, vocabulary richness, syntacticcomplexity and grammatical accuracy. We were interested in how these <strong>features</strong> <strong>of</strong> <strong>written</strong> <strong>language</strong>change from one IELTS level to the next across the 3–8 band range and in the effects <strong>of</strong> L1 andwriting task on the measures <strong>of</strong> pr<strong>of</strong>iciency we had selected.Table 3.1 shows a general comparison <strong>of</strong> some key design <strong>features</strong> <strong>of</strong> the present study and some <strong>of</strong>the studies discussed in the previous section. The current study builds upon previous studies bylooking at a much larger data set and at both the IELTS Academic Writing tasks. Like the Mayor et al(2002) study, it has controls for L1.© IELTS Research Reports Volume 7 8
<strong>Documenting</strong> <strong>features</strong> <strong>of</strong> <strong>written</strong> <strong>language</strong> <strong>production</strong> <strong>typical</strong> at IELTS band levels – Banerjee, Franceschina + SmithStudyNo. <strong>of</strong>scriptsCorpus size(words)IELTS band levelsinvestigatedWritingTasksVersions<strong>of</strong> testL1sPresent study 550 † 132,618 3 to 81 and 2 26 Chinese and SpanishMayor et al (2002) 186 56,154 5 vs 7 and 8 2 2 Chinese and GreekKennedy andThorp (2002) 130 35,464Hawkey andBarker (2004) 288 53,0004, 6, 8, 9 (8 and 9conflated for analysis) 2 1n/a; they were FCE,CAE and CPE 1 1reported as unknown;presumably mixednot reported;presumably mixed†275 <strong>of</strong> these were Task 1 scripts and 275 were Task 2 scripts, a pair per learnerTable 3.1: Comparison <strong>of</strong> coverage <strong>of</strong> the present study and some previous studies3.1 SamplingWe requested approximately equal numbers <strong>of</strong> scripts at each band level (1–9), balanced for L1(50% L1 Chinese, 50% L1 Spanish). However, it was not possible to obtain scripts for band levels 1, 2and 9 since these are much less common than the other levels in the current population <strong>of</strong> IELTS testtakers. We received 159 scripts from centres across China and 116 scripts from four Latin Americancountries (Colombia, Mexico, Peru and Ecuador). Table 3.2 presents a summary <strong>of</strong> the different types<strong>of</strong> scripts that make up our corpus.Band L1 Chinese Centre L1 Spanish Centre TotalBand 9 0 0 0Band 8 1 7 8Band 7 15 33 48Band 6 45 38 83Band 5 53 29 82Band 4 33 9 42Band 3 12 0 12Band 2 0 0 0Band 1 0 0 0Total scripts 159 116 275Total no. <strong>of</strong> words 72,631 59,987 132,618†The number <strong>of</strong> scripts in this table and in Figure 1 should be doubled if Task 1 and Task 2 are counted as separate scripts.Table 3.2: Scripts in our corpusAlthough the distribution <strong>of</strong> scripts by L1 and band is uneven, and therefore not ideal for some <strong>of</strong> theplanned comparisons, the differences between the L1 Chinese centres and L1 Spanish centresregarding mark ranges and frequencies within each band are interesting in themselves. The data© IELTS Research Reports Volume 7 9
<strong>Documenting</strong> <strong>features</strong> <strong>of</strong> <strong>written</strong> <strong>language</strong> <strong>production</strong> <strong>typical</strong> at IELTS band levels – Banerjee, Franceschina + Smithconsidered ‘perfect’ examples <strong>of</strong> their band levels since they received the same band score for each <strong>of</strong>the analytic categories as well as for the final band level. However, we found that it was difficult to becertain when ellipsis and substitution had been intentionally and correctly used, particularly at thelower IELTS band levels. Two examples are presented below:L1 Chinese/ Band 4/ Task 1The pie chart show that about world electricity <strong>production</strong> by energy source withinEurope in 1997.As we can see. solid fuels are most. And then are Nuclear 20%, Gas 18%, Oil 10%Water 7%. at least is Other renewables.L1 Spanish/ Band 4/ Task 1The chart show that the principal exporter countries are EEUU and Canada with avalue to $9.800 m approx. The following is Oceania with $3.800 m approx, but thedifferent between North America (EEUU and Canada) and Oceania is big, thisdifferent is about $6.000 m approx.The two underlined items might represent ellipsis and substitution. In the first extract, ‘most’ might bereconstructed as ‘the most widely used energy sources’. In the second extract, ‘following’ might bereconstructed as ‘the next largest exporter’. These items might have been intended to link the ideastogether but they have not been used appropriately. This presents a number <strong>of</strong> problems, including:1. How might an instance <strong>of</strong> ellipsis or substitution be identified and should the analysis takeinto account possible intention on the part <strong>of</strong> the writer?2. Might an overly generous identification <strong>of</strong> ellipsis and substitution at the lower IELTS bandlevels inflate the measurement <strong>of</strong> these <strong>features</strong> at these levels and therefore skew the results?The Halliday and Hasan (1976) framework, developed as it was from the analysis <strong>of</strong> native speakertexts, does not <strong>of</strong>fer insights into how non-native speaker error might be accounted for in the analysis.We therefore abandoned this analysis in the expectation that we were likely to cover some key aspects<strong>of</strong> this lexicogrammatical ground using a less problematic methodology in our analyses <strong>of</strong>grammatical accuracy and syntactic complexity.Analyses <strong>of</strong> anaphoric reference can include the use <strong>of</strong> personals (eg he, she, it, they, hers),demonstratives (eg this, these, that, those), and comparatives (eg same, similar, likewise, other).However, a preliminary analysis <strong>of</strong> this data set revealed that the category <strong>of</strong> demonstratives was themost promising. The analysis performed borrows its theoretical framework from Botley (2000) whoinvestigated anaphora in <strong>written</strong> texts by first <strong>language</strong> speakers <strong>of</strong> English. Botley first identifiedeach occurrence <strong>of</strong> the demonstratives – this, that, these and those – and then assigned them a5-character code. Basing his work on Halliday and Hasan’s (1976) categories, as well as derivingcategories from his data (three corpora <strong>of</strong> English texts), Botley identified five distinctive <strong>features</strong>which he classified as:• Recoverability <strong>of</strong> Antecedent – the degree <strong>of</strong> availability <strong>of</strong> each demonstrative’santecedent either directly (from the text), or indirectly (through the reader’sunderstanding <strong>of</strong> the text)• Direction <strong>of</strong> Reference – whether each demonstrative’s antecedent appears in the textprior to the demonstrative (anaphorically) or following the demonstrative(cataphorically)• Phoric Type – whether the relationship between each demonstrative and its antecedentwas interpreted semantically (ie referential phoric type) or syntactically (iesubstitutional phoric type)© IELTS Research Reports Volume 7 12
<strong>Documenting</strong> <strong>features</strong> <strong>of</strong> <strong>written</strong> <strong>language</strong> <strong>production</strong> <strong>typical</strong> at IELTS band levels – Banerjee, Franceschina + Smith• Syntactic Function – the function that each demonstrative fulfils in the sentence, eitheras the head <strong>of</strong> a noun phrase or as a noun modifier• Antecedent Type – the form <strong>of</strong> each demonstrative’s antecedent; whether it referred toa noun (phrase) or a clause.These five main categories were further sub-divided to more precisely describe each occurrence, as inTable 4.1 below (reproduced from Botley, 2000).Feature Value 1 Value 2 Value 3 Value 4 Value 5Recoverability<strong>of</strong> AntecedentD(directlyrecoverable)I(indirectlyrecoverable)N(non-recoverable)O(not-applicable,eg exophoric)noneDirectionReference<strong>of</strong>A(anaphoric)C(cataphoric)0(not applicable,eg exophoric ordeictic)NonenonePhoric TypeRS0Nonenone(referential)(substitutional)(not applicable)SyntacticfunctionM(nounmodifier)H(head noun)0(not applicable)NonenoneAntecedentTypeN(nominalantecedent)P(propositional /factualantecedent)C(clausalantecedent)J(adjectivalantecedent)0(noantecedent)Table 4.1: Values assigned to each occurrence <strong>of</strong> the demonstratives inBotley’s (2000) frameworkIt is important to note that there is currently no automatic or semi-automatic system available for theidentification <strong>of</strong> anaphora (Botley and McEnery, 2000, pp 3). Therefore, all the analyses andannotation have to be performed manually. We applied Botley’s framework in two stages. First theoccurrences <strong>of</strong> the four demonstratives under discussion were manually annotated. This wasperformed on the whole data set. Then, the subset <strong>of</strong> 42 scripts described earlier was annotated moreclosely using the five distinctive <strong>features</strong> Botley identified (see Table 4.1, above) with the followingprovisos.1. Coding the Recoverability <strong>of</strong> Antecedent depends to some degree on the reader’swillingness or ability to make inferences and connections. An antecedent that to somereaders may seem to be directly (or at least indirectly) recoverable, may not berecoverable at all to others, especially if they are unfamiliar with the genre or style<strong>of</strong> writing.2. Although Botley <strong>of</strong>ten uses ‘anaphora’ as an umbrella term for all anaphoric phenomena,including cataphora (reference to an antecedent yet to be identified), in the coding forDirection <strong>of</strong> Reference the two terms are used in contradistinction to one another.In practice, however, no examples <strong>of</strong> cataphora were found in our sample.© IELTS Research Reports Volume 7 13
<strong>Documenting</strong> <strong>features</strong> <strong>of</strong> <strong>written</strong> <strong>language</strong> <strong>production</strong> <strong>typical</strong> at IELTS band levels – Banerjee, Franceschina + Smith3. Deciding whether the Phoric Type is referential or substitutional proved in these examplesto be quite problematic. Additionally Botley (2000) found very few in his data. Thus it isdoes not seem unreasonable to conclude that this usage is quite rare, and perhaps not themost useful indicator <strong>of</strong> <strong>language</strong> competence. As well as being somewhat problematic,this category was not considered relevant to this study, and it was therefore not used.4. It might be expected that determining the Antecedent Type should be relatively clear.However, when the actual data are examined, there are <strong>of</strong>ten overlaps found betweenpropositional and clausal antecedents. It was therefore decided that only syntacticsub-categories should be recognised, leaving the sub-category ‘propositional / factualantecedents’ out.4.2 Frequency <strong>of</strong> use <strong>of</strong> demonstratives (this, that, these, those)The qualitative data analysis s<strong>of</strong>tware, Atlas-ti was used to code the scripts for the occurrences <strong>of</strong> thedemonstratives – this, that, these and those. The annotations were further refined by indicatingwhether the demonstrative had been used correctly (ie in its correct form – single or plural) orincorrectly. The final set <strong>of</strong> annotations was then extracted to an Excel file and transferred to SPSS forquantitative analysis. The following analyses were performed:• the mean frequency <strong>of</strong> use <strong>of</strong> the demonstratives – this, that, these and those – by L1,task and IELTS band level (including standard deviations).• the mean frequency <strong>of</strong> use <strong>of</strong> demonstratives as a whole by L1, task and IELTSband level.We also used the right/wrong data to check whether the demonstratives had been used correctly on thewhole and found that the occurrence <strong>of</strong> incorrect use <strong>of</strong> demonstratives was low for both groups:L1 Chinese test-takers (Task 1 = 8% and Task 2 = 5%); L1 Spanish test-takers (Task 1 = 11% andTask 2 = 10%).The mean frequency <strong>of</strong> use <strong>of</strong> the demonstratives – this, that, these and those – (including standarddeviations) according to L1 and IELTS band level for Tasks 1 and 2 are presented in Appendix 1.One interesting trend is the negligible use <strong>of</strong> the demonstrative ‘those’ by test-takers at all levels inboth <strong>language</strong> groups. It also appears that L1 Spanish test-takers are more likely on the whole to usedemonstratives than their L1 Chinese counterparts. The tables in Appendix 1 further indicate that thepattern <strong>of</strong> use <strong>of</strong> individual demonstratives is not clear and that there is a lot <strong>of</strong> variability in usewithin bands. We decided, therefore, to explore the patterns for overall use <strong>of</strong> demonstratives.They are presented in Table 4.2.© IELTS Research Reports Volume 7 14
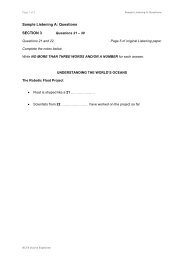
<strong>Documenting</strong> <strong>features</strong> <strong>of</strong> <strong>written</strong> <strong>language</strong> <strong>production</strong> <strong>typical</strong> at IELTS band levels – Banerjee, Franceschina + SmithL1 Chinese Means (SD)L1 Spanish Means (SD)Task 1 Task 2 Task 1 Task 2Band 31.001.43- -(N = 7/0)(1.16)(2.57)Band 41.213.414.632.87(N = 29/8)(1.24)(2.61)(3.96)(1.13)Band 51.672.763.143.64(N = 45/28)(1.46)(1.90)(2.19)(2.16)Band 62.213.822.894.53(N = 38/38)(1.80)(2.48)(1.78)(2.79)Band 72.783.222.843.94(N = 9/32)(2.91)(1.99)(1.78)(2.11)Band 8(N = 0/7)- - 4.00(2.77)4.43(2.94)Table 4.2: The mean frequency <strong>of</strong> use <strong>of</strong> demonstratives as a whole by L1, taskand IELTS band levelTable 4.2 reveals some interesting trends in total demonstrative use:• L1 Spanish speakers generally make more use <strong>of</strong> demonstratives in both tasks thanL1 Chinese speakers (by approximately 50%). This is to be expected given the closerrelationship <strong>of</strong> Spanish to English.• The pattern <strong>of</strong> demonstrative use in Task 1 is different for the two L1 groups. Figure4.1 (following) shows that demonstrative use by the L1 Chinese test-takers risessteadily in line with increases in the IELTS band level awarded while demonstrativeuse by theL1 Spanish test-takers declines in line with increases in the IELTS band level untilIELTS band level 8 where there is a sharp increase again.• Task 2 generates more demonstrative use than Task 1. This justifies the inclusion <strong>of</strong>two writing tasks to generate different uses <strong>of</strong> the <strong>language</strong>.• L1 Chinese speakers are less likely to use demonstratives in Task 1 than Task 2.• L1 Spanish writers display a different trend in demonstrative use in both tasks.In Task 1 L1 Spanish writers are less likely to use demonstratives as their IELTS bandlevel increases whereas in Task 2 they are more likely to use demonstratives as theirIELTS band level increases.© IELTS Research Reports Volume 7 15
<strong>Documenting</strong> <strong>features</strong> <strong>of</strong> <strong>written</strong> <strong>language</strong> <strong>production</strong> <strong>typical</strong> at IELTS band levels – Banerjee, Franceschina + Smith5Mean Total Demonstrative Use (Task 1)43210456First langL1 ChineseL1 Spanish7IELTS Band Level<strong>5.</strong>0Mean Total Demonstrative Use (Task 2)4.03.02.01.00.0456First langL1 ChineseL1 Spanish7IELTS Band LevelFigure 4.1: The mean frequency <strong>of</strong> use <strong>of</strong> demonstratives as a whole byL1, task and IELTS band levelWe confirmed these patterns by doing a two-way ANOVA, between groups design (ie betweenL1 Spanish speakers and L1 Chinese speakers), to test the main effects and potential interactions <strong>of</strong>IELTS band level with L1 on the mean total demonstrative use for each task. The calculations coveredonly bands 4–7 because we lacked data from one L1 group for the other bands. Table 4.3 (following)shows the summary statistics for the two-way ANOVA band x L1, DV: mean total demonstrative usefor Task 1.© IELTS Research Reports Volume 7 16
<strong>Documenting</strong> <strong>features</strong> <strong>of</strong> <strong>written</strong> <strong>language</strong> <strong>production</strong> <strong>typical</strong> at IELTS band levels – Banerjee, Franceschina + SmithSourceType III Sum<strong>of</strong> SquaresDf Mean Square F Sig.Corrected Model 138.789(a) 7 19.827 <strong>5.</strong>569 .000Intercept 1107.146 1 1107.146 310.960 .000F_BAND 6.501 3 2.167 .609 .610FIRST_LA 77.253 1 77.253 21.698 .000F_BAND * FIRST_LA 46.238 3 1<strong>5.</strong>413 4.329 .005Error 779.731 219 3.560Total 2227.000 227Corrected Total 918.520 226a R Squared = .151 (Adjusted R Squared = .124)Table 4.3: Summary statistics for the two-way ANOVA band x L1, DV:Mean total demonstrative use for Task 1For Task 1 we were able to confirm that IELTS band level did not have a significant effect on themean total demonstrative use. However, L1 did have a significant effect on the mean totaldemonstrative use (F = 21.698, p
<strong>Documenting</strong> <strong>features</strong> <strong>of</strong> <strong>written</strong> <strong>language</strong> <strong>production</strong> <strong>typical</strong> at IELTS band levels – Banerjee, Franceschina + SmithSourceType III Sum<strong>of</strong> SquaresDf Mean Square F Sig.Corrected Model 76.622(a) 7 10.946 2.050 .050Intercept 1926.767 1 1926.767 360.878 .000F_BAND 41.021 3 13.674 2.561 .056FIRST_LA 7.634 1 7.634 1.430 .233F_BAND * FIRST_LA 9.871 3 3.290 .616 .605Error 1169.264 219 <strong>5.</strong>339Total 4208.000 227Corrected Total 124<strong>5.</strong>885 226a R Squared = .061 (Adjusted R Squared = .032)Table 4.4: Summary statistics for the two-way ANOVA band x L1, DV:Mean total demonstrative use for Task 2We also compared the distribution <strong>of</strong> each type <strong>of</strong> demonstrative in the two learner groups at eachband level to a corpus <strong>of</strong> English native speaker performances on IELTS test tasks (see the nativespeaker section <strong>of</strong> LANCAWE, http://www.ling.lancs.ac.uk/groups/slarg/lancawe/). We found thatwhile the L1 Spanish group gradually approached the distribution <strong>of</strong> English native speakers as bandlevel increased, the opposite was true <strong>of</strong> the L1 Chinese group. A qualitative investigation <strong>of</strong> thisphenomenon would help to identify possible causes for the contradictory developmental trend in thetwo learner groups, but we are able to conclude at this point that there is an effect <strong>of</strong> the L1 in thedistribution <strong>of</strong> demonstratives used in both Writing tasks.4.3 Use <strong>of</strong> demonstratives (this, that, these, those)An investigation <strong>of</strong> the usage <strong>of</strong> demonstratives (this, that, these and those) was carried out usingBotley’s (2000) five <strong>features</strong> <strong>of</strong> demonstratives:• Recoverability <strong>of</strong> Antecedent• Direction <strong>of</strong> Reference• Phoric Type• Syntactic Function• Antecedent Type.Since the annotation <strong>of</strong> the data set had to be done manually and this was an extremely slow process,we restricted our initial analysis to the subset <strong>of</strong> 42 scripts described in 4.1 (above) in order toestablish whether the results added to the findings from our analysis <strong>of</strong> the frequency <strong>of</strong> use <strong>of</strong> thedemonstratives.4.3.1 RecoverabilityAs expected, there was a high degree <strong>of</strong> recoverability <strong>of</strong> the antecedents <strong>of</strong> demonstratives. Of the124 occurrences, 103 were directly recoverable by the reader/researcher. Fourteen were indirectlyrecoverable, and only seven were deemed non-recoverable, or exophoric. The classification <strong>of</strong> the124 occurrences according to their recoverability is shown in Table 4.<strong>5.</strong> Bearing in mind that L1Chinese speakers do not use demonstratives as frequently as L1 Spanish speakers, L1 does not appearto influence the pattern <strong>of</strong> recoverability <strong>of</strong> references.© IELTS Research Reports Volume 7 18
<strong>Documenting</strong> <strong>features</strong> <strong>of</strong> <strong>written</strong> <strong>language</strong> <strong>production</strong> <strong>typical</strong> at IELTS band levels – Banerjee, Franceschina + SmithDirectly recoverable Indirectly recoverable Non-recoverableL1 Chinese Spanish All Chinese Spanish All Chinese Spanish Alllevel 3 6 / 6 2 / 2 0 / 0level 4 8 17 25 2 0 2 1 2 3level 5 7 11 18 2 2 4 0 0 0level 6 4 12 16 2 1 3 1 1 2level 7 7 8 15 1 1 2 0 1 1level 8 8 15 23 0 1 1 0 1 1total 40 63 104 9 5 14 2 5 7Table 4.5: Recoverability <strong>of</strong> antecedents by level and L14.3.2 Direction <strong>of</strong> referenceThe majority <strong>of</strong> the occurrences <strong>of</strong> demonstratives in the samples were anaphoric, referring toantecedents earlier in the text. Some antecedents could not be identified, however, because <strong>of</strong> theexophoric or deictic nature <strong>of</strong> the reference. Table 4.6 shows the distribution <strong>of</strong> these categories by L1and by level. As in the case <strong>of</strong> recoverability, L1 does not appear to influence the pattern <strong>of</strong> direction<strong>of</strong> reference.anaphoric reference cataphoric reference exophoric/deictic referenceL1 Chinese Spanish All Chinese Spanish All Chinese Spanish Alllevel 3 8 / 8 0 / 0 0 / 0level 4 10 17 27 0 0 0 1 2 3level 5 8 13 21 0 0 0 1 0 1level 6 6 13 19 0 0 0 1 1 2level 7 8 9 17 0 0 0 0 1 1level 8 8 15 23 0 0 0 0 2 2total 48 67 115 0 0 0 3 6 9Table 4.6: Direction <strong>of</strong> reference <strong>of</strong> antecedents by level and L1© IELTS Research Reports Volume 7 19
<strong>Documenting</strong> <strong>features</strong> <strong>of</strong> <strong>written</strong> <strong>language</strong> <strong>production</strong> <strong>typical</strong> at IELTS band levels – Banerjee, Franceschina + Smith4.3.3 Syntactic functionThe number <strong>of</strong> occurrences <strong>of</strong> demonstratives used anaphorically as noun modifiers accounted for thevast majority <strong>of</strong> the total number, as shown in Table 4.7. L1 does not appear to influence the pattern inthe syntactic function <strong>of</strong> the demonstratives.noun modifierhead nounL1 Chinese Spanish All Chinese Spanish Alllevel 3 8 / 8 0 / 0level 4 3 17 20 8 2 10level 5 3 8 11 6 5 11level 6 4 13 17 3 1 4level 7 7 4 11 1 6 7level 8 7 13 20 1 4 5Total 32 55 87 19 18 37Table 4.7: Syntactic function <strong>of</strong> demonstratives by level and L14.3.4 Antecedent typeThe majority <strong>of</strong> antecedents referred to in these texts were nominals, either single nouns or nounphrases. It was also quite common for writers to refer to propositions earlier in the text, especiallythose that were responses to statements or arguments and were expressed as clauses. There were noadjectival antecedents, so they do not appear in Table 4.8. The distributions <strong>of</strong> antecedent type by L1and level are shown below.Nominal Clausal No AntecedentL1 ch Sp All ch sp All Ch sp Alllevel 3 7 / 7 1 / 1 0 / 0level 4 6 14 20 4 3 7 1 2 3level 5 1 6 7 7 6 13 1 1 2level 6 4 8 12 2 5 7 1 1 2level 7 6 3 9 2 6 8 0 1 1level 8 5 7 12 3 8 11 0 2 2total 29 38 67 19 28 47 3 7 10Table 4.8: Antecedent type by level and L1The analysis <strong>of</strong> this carefully selected subset suggested that a wider analysis would be unlikely to berevealing.© IELTS Research Reports Volume 7 20
<strong>Documenting</strong> <strong>features</strong> <strong>of</strong> <strong>written</strong> <strong>language</strong> <strong>production</strong> <strong>typical</strong> at IELTS band levels – Banerjee, Franceschina + Smith4.4 Summary <strong>of</strong> findingsOur analysis <strong>of</strong> cohesive devices was based on Halliday and Hasan’s (1976) framework <strong>of</strong> cohesiveties. We have explored the use <strong>of</strong> anaphoric reference in the form <strong>of</strong> the demonstratives (this, that,these and those). Our analysis revealed the following.1. L1 Spanish speakers use approximately 50% more demonstratives than L1 Chinese speakers.2. Test-takers are more likely to use demonstratives when responding to IELTS Task 2 than toIELTS Task 1.3. Demonstrative use by both L1 groups appears to be influenced by the task (ie the type <strong>of</strong>writing) that they are asked to do. However, the influence is different in nature. For L1Chinese speakers the task affects the number <strong>of</strong> demonstratives used but the relationshipbetween demonstrative use and IELTS band level remains the same. For L1 Spanish speakers,the number <strong>of</strong> demonstratives used is fairly stable but the relationship between demonstrativeuse and IELTS band level differs from Task 1 to Task 2.4. Use <strong>of</strong> demonstratives appears to tail <strong>of</strong>f at higher levels <strong>of</strong> <strong>language</strong> pr<strong>of</strong>iciency, suggestingthat other cohesive ties come into use. We would suggest that writers at higher IELTS bandlevels are more likely to use lexical ties to create cohesion. We would therefore expectperformances at higher IELTS band levels to display greater lexical variation andsophistication.It is important to note that the analysis <strong>of</strong> cohesive devices highlights the difficulties <strong>of</strong> applyingmeasures developed for the analysis <strong>of</strong> L1 texts to L2 performances. Adapting these measures to thestudy <strong>of</strong> L2 performances is an important area for future research.5 VOCABULARY RICHNESSThe text <strong>features</strong> associated with lexical richness figure prominently in the IELTS rating scales. Ratersare required to give an analytic score for vocabulary and sentence structure as part <strong>of</strong> the process formarking both Task 1 and Task 2. Since the size <strong>of</strong> our sample at each IELTS band level variesconsiderably, we have calculated the mean scores at each band level for measures <strong>of</strong> lexical output,lexical variation, lexical density and lexical sophistication in order to account for differences in N sizebetween groups.<strong>5.</strong>1 Review <strong>of</strong> measuresThe simplest measure <strong>of</strong> vocabulary richness available looks at lexical output, counting first the totalnumber <strong>of</strong> words (tokens) <strong>written</strong> and then the total number <strong>of</strong> different word forms (types) <strong>written</strong>.Measures <strong>of</strong> lexical output calculate the number <strong>of</strong> tokens and types and the results can be correlatedagainst <strong>language</strong> pr<strong>of</strong>iciency as reflected in IELTS band scores. The results <strong>of</strong> this analysis arepresented in <strong>5.</strong>2.The analysis <strong>of</strong> lexical output can be taken a step further by examining the ratio <strong>of</strong> types to tokens.This is a measure <strong>of</strong> lexical variation/diversity because the higher the number <strong>of</strong> types in relation totokens the more varied/diverse the vocabulary used. The traditional approach to calculating lexicalvariation has been the Type-Token Ratio (TTR) where the number <strong>of</strong> types is divided by the number<strong>of</strong> tokens and multiplied by 100. However, this approach is affected by text length so a more robustmethod <strong>of</strong> measuring lexical variation has been developed by Malvern and Richards (2002) (see alsoDuran et al, 2004), a D-value. Meara and Miralpeix (2004) have developed s<strong>of</strong>tware to calculate theD-value for texts. However, we did not learn <strong>of</strong> the availability <strong>of</strong> these tools until late in the projectand the calculations were not possible in the time available. Instead, in <strong>5.</strong>3 we present the results <strong>of</strong>our analysis <strong>of</strong> lexical variation using the more traditional TTR approach.© IELTS Research Reports Volume 7 21
<strong>Documenting</strong> <strong>features</strong> <strong>of</strong> <strong>written</strong> <strong>language</strong> <strong>production</strong> <strong>typical</strong> at IELTS band levels – Banerjee, Franceschina + SmithA third and even closer examination <strong>of</strong> the nature <strong>of</strong> vocabulary use in a text is the measure <strong>of</strong> lexicaldensity (Ure, 1971). This measure compares the number <strong>of</strong> lexical words used to the number <strong>of</strong>grammatical words. We have adopted O’Loughlin’s (2001) definition <strong>of</strong> grammatical and lexicalitems as well as his division <strong>of</strong> lexical items into high-frequency and low-frequency items and, assuggested by Halliday (1985, pp 64-5, cited in O’Loughlin, 2001, pp 102), weighted the highfrequencyitems at half the value <strong>of</strong> the low-frequency items because this is likely to provide a truerestimate <strong>of</strong> lexical density. To identify high-frequency items in our data set we used the lexical itemsfound in the 750 most frequently occurring words in the British National Corpus (BNC). In <strong>5.</strong>4 wepresent the results <strong>of</strong> our analysis <strong>of</strong> ‘weighted’ lexical density.Measures <strong>of</strong> lexical sophistication provide insight into the number <strong>of</strong> unusual or rare words used by awriter. We adopted the approach developed by Nation and Heatley (1996), using the Range program.The program classifies the words in a text into four categories. The first two categories are the firstand second thousand most frequently occurring words in English (West, 1953). The third category isthe Academic Word List (Coxhead, 2000) and contains 570 word families. The final category is anopen category for all words that are not contained in the first three lists. We present our analyses <strong>of</strong>lexical sophistication in <strong>5.</strong><strong>5.</strong>We also considered but did not implement an approach developed by Engber (1995) which calculatesthe percentage <strong>of</strong> lexical errors in a text. Engber developed a classification <strong>of</strong> lexical errors as onemeasure in an investigation <strong>of</strong> the relationship between lexical richness and the quality <strong>of</strong> ESLcompositions. She found that her measure <strong>of</strong> error-free lexical variation correlated best with thestudents’ scores. Any application <strong>of</strong> this approach would have to take into consideration Laufer andNation’s (1995) criticism that it does not distinguish between errors in types and tokens. There mighttherefore be considerable ‘double-counting’ in the calculation <strong>of</strong> lexical error. Other criticisms <strong>of</strong> theapproach are that it is sometimes difficult to distinguish between lexical and grammatical errors andthat Engber’s framework does not take into account the relative seriousness <strong>of</strong> different errors(Read, 2000, pp 205).<strong>5.</strong>2 Lexical outputAn analysis <strong>of</strong> lexical output looks simply at the number <strong>of</strong> words produced by the test-takers.We performed the following calculations:• mean number <strong>of</strong> tokens and types for the whole data set (including standarddeviations)by task and IELTS band level• mean number <strong>of</strong> tokens and types for each L1 group (including standard deviations)by IELTS band level.Table <strong>5.</strong>1 presents the mean number <strong>of</strong> tokens and types (including standard deviations) for the wholedata set, according to IELTS band level for Task 1 and Task 2. The results show that, as might beexpected, the mean number <strong>of</strong> tokens and types increases with the test-takers’ IELTS band level.This indicates that more pr<strong>of</strong>icient test-takers are likely to produce more words (and more differentwords – types) than less pr<strong>of</strong>icient test-takers.© IELTS Research Reports Volume 7 22
<strong>Documenting</strong> <strong>features</strong> <strong>of</strong> <strong>written</strong> <strong>language</strong> <strong>production</strong> <strong>typical</strong> at IELTS band levels – Banerjee, Franceschina + SmithTask 1 Means (SD)Task 2 Means (SD)Tokens Types Tokens TypesBand 3138.253.1132.36<strong>5.</strong>7(N = 12)(38.9)(13.3)(52.2)(19.4)Band 4163.666.2253.0127.0(N = 42)(54.8)(20.8)(70.6)(32.6)Band 5189.176.3284.0137.0(N = 82)(50.7)(24.7)(56.8)(2<strong>5.</strong>3)Band 6208.686.4308.6152.3(N = 83)(46.1)(22.2)(54.6)(2<strong>5.</strong>6)Band 7223.694.2312.2159.0(N = 48)(51.8)(20.6)(56.8)(2<strong>5.</strong>6)Band 8230.6102.6323.3160.4(N = 8)(39.1)(26.5)(31.5)(12.9)Table <strong>5.</strong>1: Lexical output for the whole data set, according to IELTS band level for Task 1 and 2However, the large Standard Deviation figures for both tokens and types indicate a wide variation inlexical output within each band level. To check whether this is accounted for by the test-takers’ L1,we split the data set into the two L1 groups (L1 Chinese and L1 Spanish) and recalculated the figures.Tables <strong>5.</strong>2 and <strong>5.</strong>3 present the total number <strong>of</strong> tokens and types and the mean number <strong>of</strong> tokens andtypes (including standard deviations) for each L1 (Chinese and Spanish), according to IELTS bandlevel for Task 1 and Task 2.L1 Chinese Means (SD)L1 Spanish Means (SD)Tokens Types Tokens TypesBand 3(N = 7/0)Band 4(N = 29/8)Band 5(N = 45/28)Band 6(N = 38/38)Band 7(N = 9/32)Band 8(N = 0/7)142.4(42.1)53.6(1<strong>5.</strong>2)- -150.260.2203.886.1(43.6)(16.8)(77.7)(26.0)173.866.1218.194.3(38.2)(13.6)(61.6)(30.6)190.876.0224.096.2(34.1)(12.5)(52.5)(26.1)190.283.0240.799.4(47.8)(1<strong>5.</strong>2)(49.7)(22.1)- - 237.3103.4(37.0)(28.6)Table <strong>5.</strong>2: Lexical output for L1 Chinese and L1 Spanish scripts, according toIELTS band level for Task 1© IELTS Research Reports Volume 7 23
<strong>Documenting</strong> <strong>features</strong> <strong>of</strong> <strong>written</strong> <strong>language</strong> <strong>production</strong> <strong>typical</strong> at IELTS band levels – Banerjee, Franceschina + SmithL1 Chinese Means (SD)L1 Spanish Means (SD)Tokens Types Tokens TypesBand 3(N = 7/0)Band 4(N = 29/8)Band 5(N = 45/28)Band 6(N = 38/38)Band 7(N = 9/32)Band 8(N = 0/7)128.3(41.3)6<strong>5.</strong>3(14.4)- -259.4132.0211.410<strong>5.</strong>1(70.7)(32.4)(53.5)(21.5)290.4139.5276.813<strong>5.</strong>6(49.2)(24.3)(73.4)(26.5)308.6156.2306.4146.8(43.6)(20.4)(66.4)(29.4)323.6174.9310.3153.5(51.3)(12.2)(63.3)(28.5)- - 321.7159.3(33.7)(13.5)Table <strong>5.</strong>3: Lexical output for L1 Chinese and L1 Spanish scripts, according toIELTS band level for Task 2Both tables show that the pattern <strong>of</strong> high standard deviations persists in both L1 groups. Additionally,in Task 1 the lexical output for the L1 Chinese group drops <strong>of</strong>f slightly between IELTS band 6 andband 7 and for the L1 Spanish group, it drops <strong>of</strong>f between IELTS band 7 and 8. It is possible that theslight dip in the figures can be explained by the drop in sample size at the top end <strong>of</strong> the scale for bothL1 groups.This small anomaly aside, there appears to be a link between band level and the mean number <strong>of</strong> typesand tokens produced. We tested this by calculating Pearson correlations between band score and meannumber <strong>of</strong> types and tokens. We found that the Pearson correlation between band score and meannumber <strong>of</strong> types per script was moderate for Task 1 and Task 2 scripts, although slightly higher for thelatter; both were significant (Task 1: r=0.442, n=278, p
<strong>Documenting</strong> <strong>features</strong> <strong>of</strong> <strong>written</strong> <strong>language</strong> <strong>production</strong> <strong>typical</strong> at IELTS band levels – Banerjee, Franceschina + SmithSourceType III Sum<strong>of</strong> SquaresDf Mean Square F Sig.Corrected Model 46497.544(a) 7 6642.506 16.013 .000Intercept 1310182.636 1 1310182.636 3158.445 .000BANDF 7469.146 3 2489.715 6.002 .001L1 20980.706 1 20980.706 50.578 .000BANDF * L1 61<strong>5.</strong>758 3 20<strong>5.</strong>253 .495 .686Error 103704.708 250 414.819Total 184861<strong>5.</strong>000 258Corrected Total 150202.252 257Table <strong>5.</strong>4: Summary statistics for two-way ANOVA band x L1, DV: mean types (Task 1)SourceType III Sum<strong>of</strong> SquaresDf Mean Square F Sig.Corrected Model 44936.287(a) 7 6419.470 9.465 .000Intercept 3906266.225 1 3906266.225 5759.686 .000BANDF 41687.828 3 1389<strong>5.</strong>943 20.489 .000L1 10754.891 1 10754.891 1<strong>5.</strong>858 .000BANDF * L1 2773.152 3 924.384 1.363 .255Error 169552.058 250 678.208Total 5617789.000 258Corrected Total 214488.345 257Table <strong>5.</strong>5: Summary statistics for two-way ANOVA band x L1, DV: mean types (Task 2)We repeated these procedures to test the potential main effects and interactions <strong>of</strong> band level x L1,with the mean number <strong>of</strong> tokens per script as dependent variable and found very similar results to thetype analysis. There were significant effects <strong>of</strong> both band level and L1 on mean token scores both forTask 1 and Task 2, but the interaction between these two factors was not significant in either case.Post-hoc tests (Tukey HSD) showed that the different band levels were significantly different exceptfor levels 6 and 7 in Tasks 1 and 2. A brief summary <strong>of</strong> the results is presented in Tables <strong>5.</strong>6 and <strong>5.</strong>7on the following page.© IELTS Research Reports Volume 7 25
<strong>Documenting</strong> <strong>features</strong> <strong>of</strong> <strong>written</strong> <strong>language</strong> <strong>production</strong> <strong>typical</strong> at IELTS band levels – Banerjee, Franceschina + SmithSourceType III Sum <strong>of</strong>SquaresDf Mean Square F Sig.Corrected Model 190632.209(a) 7 27233.173 12.593 .000Intercept 764663<strong>5.</strong>208 1 764663<strong>5.</strong>208 3536.043 .000BANDF 35647.954 3 11882.651 <strong>5.</strong>495 .001L1 81206.449 1 81206.449 37.552 .000BANDF * L1 4048.196 3 1349.399 .624 .600Error 540620.896 250 2162.484Total 10830447.000 258Corrected Total 731253.105 257Table <strong>5.</strong>6: Summary statistics for two-way ANOVA band x L1, DV: mean tokens (Task 1)SourceType III Sum <strong>of</strong>SquaresDf Mean Square F Sig.Corrected Model 133598.670(a) 7 1908<strong>5.</strong>524 <strong>5.</strong>554 .000Intercept 15861476.323 1 15861476.323 461<strong>5.</strong>457 .000BANDF 12875<strong>5.</strong>243 3 42918.414 12.489 .000L1 1501<strong>5.</strong>888 1 1501<strong>5.</strong>888 4.369 .038BANDF * L1 7804.048 3 2601.349 .757 .519Error 859149.908 250 3436.600Total 23106059.000 258Corrected Total 992748.578 257Table <strong>5.</strong>7: Summary statistics for two-way ANOVA band x L1, DV: mean tokens (Task 2)These results suggest that the number <strong>of</strong> words produced and the number <strong>of</strong> different words (types)produced does contribute to a test-taker’s IELTS band level.© IELTS Research Reports Volume 7 26
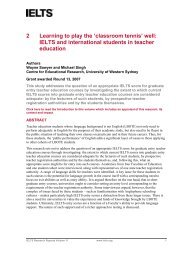
<strong>Documenting</strong> <strong>features</strong> <strong>of</strong> <strong>written</strong> <strong>language</strong> <strong>production</strong> <strong>typical</strong> at IELTS band levels – Banerjee, Franceschina + Smith<strong>5.</strong>3 Lexical variationAn analysis <strong>of</strong> lexical variation explores the number <strong>of</strong> different words (types) produced by the testtakersin relation to the total number <strong>of</strong> words produced. We performed the following calculations:• mean Type-Token ratio (TTR) for the whole data set (including standard deviations)by task and IELTS band level• mean TTR for each L1 group (including standard deviations) by IELTS band level.Table <strong>5.</strong>8 presents the mean TTR (including standard deviations) for the whole data set, according toIELTS band level for Task 1 and Task 2 as well as the maximum and minimum TTR at each level.The results reveal a rather mixed picture. For Task 1 the pattern is generally linear (see Figure <strong>5.</strong>1)with the mean TTR rising in line with the test-takers’ IELTS band level. However, the mean TTR ishigher at IELTS band level 4 than at IELTS band levels 5 or 6, producing a spike in the line.This might be explained (at least partially) by the standard deviation and the range for this band level.The standard deviation figures are generally high but the performances at IELTS band level 4 have thehighest standard deviation (10.1) and the range is 52, indicating much more variability in performanceat this band level than at the others.Task 1 TTRTask 2 TTRMean (SD) Maximum Minimum Mean (SD) Maximum MinimumBand 339.656.6 31.2 5<strong>5.</strong>290.5 28.3(N = 12)(9.2)(17.1)Band 442.180.0 28.0 51.171.1 36.6(N = 42)(10.1)(7.0)Band 540.659.3 20.5 48.966.1 27.8(N = 82)(7.8)(6.9)Band 641.862.3 22.9 49.760.2 31.8(N = 83)(7.3)(<strong>5.</strong>4)Band 742.956.3 27.6 51.364.2 42.7(N = 48)(6.6)(<strong>5.</strong>1)Band 844.752.7 30.6 49.85<strong>5.</strong>0 42.7(N = 8)(9.0)(3.5)Table <strong>5.</strong>8: Mean Type-Token ratio (TTR) for the whole data set (including standard deviations)by task and IELTS band level© IELTS Research Reports Volume 7 27
<strong>Documenting</strong> <strong>features</strong> <strong>of</strong> <strong>written</strong> <strong>language</strong> <strong>production</strong> <strong>typical</strong> at IELTS band levels – Banerjee, Franceschina + Smith605040Mean TTR(1)30345678F BandMean TTR: Task 1605040Mean TTR(2)30345678F BandMean TTR: Task 2Figure <strong>5.</strong>1: Mean Type-Token ratio (TTR) for the whole data set by IELTS band levelBoth graphs are broadly linear and kinks in the curve might be explained (at least partially) by the highstandard deviation figures which indicate a high degree <strong>of</strong> variability within the bands. Also, since theTTR calculation is affected by the length <strong>of</strong> the texts, it is likely that it is also affected by the number<strong>of</strong> samples at each band level, particularly at IELTS band levels 3 and 8 where our sample sizes wereparticularly small.The difference in the pattern between Task 1 and Task 2 indicates also that there is a slight task effecton the TTR calculation. It is also possible that the calculations have been affected by L1.© IELTS Research Reports Volume 7 28
<strong>Documenting</strong> <strong>features</strong> <strong>of</strong> <strong>written</strong> <strong>language</strong> <strong>production</strong> <strong>typical</strong> at IELTS band levels – Banerjee, Franceschina + SmithTables <strong>5.</strong>9 and <strong>5.</strong>10 present the mean TTR (including standard deviations) for each L1 (Chinese andSpanish), according to IELTS band level for Task 1 and Task 2 as well as the maximum and minimumTTR at each level. They indicate that there is no clear relationship between band level and TTR foreither task in either L1 group. We confirmed this by doing a two-way ANOVA, between groupsdesign, to test the main effects and potential interactions <strong>of</strong> IELTS band level with L1 on the meanTTR for each task. Once again we excluded band levels 3 and 8 because we lacked data from one L1group in each case.L1 Chinese TTRL1 Spanish TTRMean (SD) Maximum Minimum Mean (SD) Maximum MinimumBand 3(N = 7/0)Band 4(N = 29/8)Band 5(N = 45/28)Band 6(N = 38/38)Band 7(N = 9/32)Band 8(N = 0/7)38.3(8.6)56.6 31.2 - - -41.8 80.0 28.6 44.3 6<strong>5.</strong>1 31.8(10.3)(10.8)38.8 54.7 23.6 43.2 59.3 31.0(7.5)(7.3)40.3 5<strong>5.</strong>6 28.6 43.6 62.3 22.9(<strong>5.</strong>5)(8.6)44.9 52.8 29.1 41.8 56.3 27.6(7.5)(6.9)- - - 43.5 51.4 30.6(9.1)Table <strong>5.</strong>9: Mean Type-Token ratio (TTR) for L1 Chinese and L1 Spanish scriptsaccording to IELTS band level for Task 1L1 Chinese TTRL1 Spanish TTRMean (SD) Maximum Minimum Mean (SD) Maximum MinimumBand 3(N = 7/0)Band 4(N = 29/8)Band 5(N = 45/28)Band 6(N = 38/38)Band 7(N = 9/32)Band 8(N = 0/7)54.2(1<strong>5.</strong>0)72.3 28.3 - - -51.9 71.1 41.2 50.9 64.0 36.6(6.6)(9.0)48.4 60.8 36.9 50.3 66.1 36.7(6.0)(7.3)50.8 58.2 42.9 48.5 60.2 31.8(4.3)(6.4)54.7 60.6 42.7 49.8 59.7 42.7(<strong>5.</strong>6)(3.8)- - - 49.7 5<strong>5.</strong>0 42.7(3.7)Table <strong>5.</strong>10: Mean Type-Token ratio (TTR) for L1 Chinese and L1 Spanish scriptsaccording to IELTS band level for Task 2© IELTS Research Reports Volume 7 29
<strong>Documenting</strong> <strong>features</strong> <strong>of</strong> <strong>written</strong> <strong>language</strong> <strong>production</strong> <strong>typical</strong> at IELTS band levels – Banerjee, Franceschina + SmithTable <strong>5.</strong>11 shows the summary statistics for the two-way ANOVA band x L1, DV: TTR for Task 1and Table <strong>5.</strong>12 shows the summary statistics for the two-way ANOVA band x L1, DV: TTR forTask 2.SourceType III Sum<strong>of</strong> SquaresDf Mean Square F Sig.Corrected Model 797.081(a) 7 113.869 1.858 .078Intercept 278212.899 1 278212.899 4539.252 .000F_BAND 142.479 3 47.493 .775 .509FIRST_LA 121.835 1 121.835 1.988 .160F_BAND * FIRST_LA 29<strong>5.</strong>479 3 98.493 1.607 .189Error 13422.614 219 61.290Total 407941.729 227Corrected Total 14219.695 226a R Squared = .056 (Adjusted R Squared = .026)Table <strong>5.</strong>11: Summary statistics for the two-way ANOVA band x L1, DV: TTR for Task 1SourceType III Sum<strong>of</strong> SquaresDf Mean Square F Sig.Corrected Model 540.591(a) 7 77.227 2.210 .035Intercept 398470.106 1 398470.106 11404.200 .000F_BAND 221.035 3 73.678 2.109 .100FIRST_LA 98.121 1 98.121 2.808 .095F_BAND * FIRST_LA 291.873 3 97.291 2.784 .042Error 7652.001 219 34.941Total 576696.036 227Corrected Total 8192.593 226a R Squared = .066 (Adjusted R Squared = .036)Table <strong>5.</strong>12: Summary statistics for the two-way ANOVA band x L1, DV: TTR for Task 2We found that IELTS band level and L1 did not have a significant effect on the TTR for either Task 1or Task 2. Additionally, for Task 1, there was no interaction between the two factors. However, therewas a significant interaction (F = 2.784, p
<strong>Documenting</strong> <strong>features</strong> <strong>of</strong> <strong>written</strong> <strong>language</strong> <strong>production</strong> <strong>typical</strong> at IELTS band levels – Banerjee, Franceschina + Smith80701360Type-Token Ration (Task 2)50403020N =291808 45 28 38 38932First langChineseSpanish4567IELTS Band ScoreFigure <strong>5.</strong>2: Boxplot for two-way ANOVA band x L1, DV: TTR (Task 2)<strong>5.</strong>4 Lexical densityMeasures <strong>of</strong> lexical density calculate the proportion <strong>of</strong> lexical words to grammatical words in the textand can also explore the extent to which test-takers at different IELTS band levels use low-frequencylexical words.We adopted O’Loughlin’s (2001) method for calculating lexical density. Items were allocated codesbased on their function – grammatical or lexical. The COBUILD English Grammar reference bookwas consulted in the process <strong>of</strong> building lists for coding (eg lists <strong>of</strong> prepositions).Words that were coded as grammatical items included:• all forms <strong>of</strong> ‘to be’, ‘to have’ and ‘to do’, plus modals• determiners, including quantifiers• pro-forms• interrogative adverbs• contractions• prepositions• discourse markers.All other words were coded as lexical items. We subdivided the lexical items into two groups –common lexical items and items that are not frequently used in English, using the BNC to identifyhigh-frequency words.We were aware that corpus frequencies, taken alone, give a very limited picture <strong>of</strong> a word'sdistribution in a corpus. As well as varying in raw frequency, words vary in the extent to which theyare equally spread across the documents on the corpus. This ‘burstiness’ can be measured in a variety<strong>of</strong> ways (Church and Gale, 1995). One straightforward possibility is to take a large number <strong>of</strong>© IELTS Research Reports Volume 7 31
<strong>Documenting</strong> <strong>features</strong> <strong>of</strong> <strong>written</strong> <strong>language</strong> <strong>production</strong> <strong>typical</strong> at IELTS band levels – Banerjee, Franceschina + Smithdocuments, all <strong>of</strong> the same length; count the frequency <strong>of</strong> a word in each <strong>of</strong> these documents, andcalculate the (mean and) variance <strong>of</strong> this frequency and this is the approach adopted in this study.The first 5,000 words <strong>of</strong> all documents (= files) longer than 5,000 words in the <strong>written</strong> part <strong>of</strong> the BNCwere taken. A frequency list was produced for each <strong>of</strong> these (truncated) documents. From this weidentified the 750 most frequently occurring words and categorised the lexical items in our data set asfollows:• Hlex: high frequency lexical items; those (non-grammatical, single word) items whichappear in the top 750 <strong>of</strong> the BNC corpus frequency lists, plus their multi-wordderivations (eg see, to see, have seen etc.)• Llex: low frequency lexical items which did not appear in the BNC top 750. Incontrast to O’Loughlin (2001) we allocated verbs in the infinitive form (with ‘to’) towhichever category they would have been in without ‘to’ since this made mostintuitive sense.In an attempt to account for the effect <strong>of</strong> topic upon the words produced, we created an additionalcategory <strong>of</strong> Hrep. This was a subset <strong>of</strong> Llex and included items (plus their multi-word derivations)which did not appear in the BNC top 750, but which were frequent in this sample. In order to establisha cut-<strong>of</strong>f point for this group <strong>of</strong> words, we adopted the frequency figure for the 750th word in the BNCtop 750.Decisions made during coding included the following.1. Where items had two uses, but one was grammatical and the other lexical, the itemwas first coded for both. Then each occurrence was checked manually to correct thecoding in context. For example the item ‘past’ was coded as either a grammaticalitem (preposition) or a lexical item (Llex) according to context.2. The verbs ‘to be’, ‘to have’ and ‘to do’ were allocated a grammatical coding in alltheir forms, including the infinitive forms.3. Contractions (eg ‘can’t’) were coded as one item but counted as two in thecalculations. This had to be done manually to ensure that they were recognised by thes<strong>of</strong>tware.4. Multiple word items were coded as one item (eg ‘United Kingdom’ which was codedseparately from ‘united’ or ‘kingdom’). The coding was checked to ensure that allitems were coded, but that no item was coded twice.The 50 most frequently occurring words in the L1 Chinese and L1 Spanish texts are presented inAppendix 2. Once the coding was complete, we performed the following calculations:• mean lexical density for the whole data set (including standard deviations) by task andIELTS band• mean lexical density for each L1 group (including standard deviations) by task andIELTS band.We weighted the calculations by counting each <strong>of</strong> the high frequency lexical items as equal to half <strong>of</strong>the value <strong>of</strong> the low frequency lexical items (Halliday, 1985).Table <strong>5.</strong>13 presents the mean lexical density for the whole data set (including standard deviations) bytask and IELTS band and Figure <strong>5.</strong>3 presents the trend (or lack there<strong>of</strong>) as a line graph.© IELTS Research Reports Volume 7 32
<strong>Documenting</strong> <strong>features</strong> <strong>of</strong> <strong>written</strong> <strong>language</strong> <strong>production</strong> <strong>typical</strong> at IELTS band levels – Banerjee, Franceschina + SmithTask 1 Task 2Mean (SD) Maximum Minimum Mean (SD) Maximum MinimumBand 31.001.95 0.50 0.701.09 0.46(N = 12)(0.43)(0.17)Band 40.761.13 0.46 0.670.99 0.41(N = 42)(0.18)(0.12)Band 50.851.59 0.45 0.660.92 0.42(N = 82)(0.24)(0.10)Band 60.791.48 0.49 0.691.08 0.37(N = 83)(0.18)(0.12)Band 70.821.23 0.55 0.751.15 0.49(N = 48)(0.15)(0.15)Band 80.821.95 0.45 0.691.15 0.37(N = 8)(0.21)(0.13)Table <strong>5.</strong>13: Mean lexical density for the whole data set (including standard deviations)by task and IELTS band1.0.9Mean Weighted Lexical Density.8.7.6.5345678Task 1Task 2IELTS Band LevelFigure <strong>5.</strong>3: Mean lexical density for the whole data set (including standard deviations)by task and IELTS bandHalliday (1985) comments that the complexity <strong>of</strong> <strong>written</strong> <strong>language</strong> lies in the use <strong>of</strong> more lexicalwords (in relation to grammatical words) suggesting that as <strong>written</strong> texts become more complex, theyalso become more lexical. We therefore expected that the lexical density <strong>of</strong> the scripts in our data setwould rise in line with IELTS band level. We also expected that Task 2 would generate more lexicallydense text as it is intended to be the more complex <strong>of</strong> the two tasks. Figure <strong>5.</strong>3 shows that (apart from© IELTS Research Reports Volume 7 33
<strong>Documenting</strong> <strong>features</strong> <strong>of</strong> <strong>written</strong> <strong>language</strong> <strong>production</strong> <strong>typical</strong> at IELTS band levels – Banerjee, Franceschina + Smiththe data for IELTS band level 3) the mean lexical density <strong>of</strong> the scripts has a tendency to rise (albeitonly slightly) as the IELTS band level increases. These results are in line with our expectations.However, contrary to expectations, Task 1 generates texts with a higher mean lexical density thanTask 2.We performed a one-way ANOVA to check the effect <strong>of</strong> final band on mean lexical density forTasks 1 and 2. Table <strong>5.</strong>14 shows that there are significant effects for band level on mean lexicaldensity scores for both Task 1 (F = 3.185, p
<strong>Documenting</strong> <strong>features</strong> <strong>of</strong> <strong>written</strong> <strong>language</strong> <strong>production</strong> <strong>typical</strong> at IELTS band levels – Banerjee, Franceschina + SmithTable <strong>5.</strong>15 shows that the Task 1 mean lexical density for L1 Chinese speakers is not very predictableby IELTS band level but that the Task 1 mean lexical density for L1 Spanish speakers tends to rise(albeit only slightly) in line with IELTS band level. Additionally, the L1 Chinese speakers overalldisplay a higher mean lexical density at every band level than the L1 Spanish speakers. These patternsare illustrated in Figure <strong>5.</strong>4.1.0.9Mean Lexical Density (Task 1).8.7.6.534567First <strong>language</strong>L1 ChineseL1 Spanish8F BandFigure <strong>5.</strong>4: Mean lexical density for each L1 group by IELTS band for Task 1L1 Chinese Mean Lexical DensityL1 Spanish Mean Lexical DensityMean (SD) Maximum Minimum Mean (SD) Maximum MinimumBand 3(N = 7/0)Band 4(N = 29/8)Band 5(N = 45/28)Band 6(N = 38/38)Band 7(N = 9/32)Band 8(N = 0/7)0.69(0.12)0.90 0.52 - - -0.68 0.99 0.47 0.62 0.80 0.41(0.12)(0.15)0.68 0.84 0.49 0.63 0.92 0.42(0.09)(0.12)0.70 1.08 0.50 0.68 1.02 0.37(0.11)(0.14)0.82 0.95 0.64 0.72 1.15 0.49(0.10)(0.15)- - - 0.69 0.79 0.63(0.06)Table <strong>5.</strong>16: Mean lexical density for each L1 group (including standard deviations)by IELTS band for Task 2© IELTS Research Reports Volume 7 35
<strong>Documenting</strong> <strong>features</strong> <strong>of</strong> <strong>written</strong> <strong>language</strong> <strong>production</strong> <strong>typical</strong> at IELTS band levels – Banerjee, Franceschina + SmithTable <strong>5.</strong>16 shows that the Task 2 mean lexical density for both L1 groups tends to rise in line withIELTS band level. Once again, the texts <strong>written</strong> by L1 Chinese speakers tend to have a higher meanlexical density than the L1 Spanish speakers. These patterns are illustrated in Figure <strong>5.</strong><strong>5.</strong>1.0.9Mean Lexical Density (Task 2).8.7.6.534567First <strong>language</strong>L1 ChineseL1 Spanish8F BandFigure <strong>5.</strong>5: Mean lexical density for each L1 group by IELTS band for Task 2We performed a two-way ANOVA, between groups design, to test the main effects and potentialinteractions <strong>of</strong> the factors band level x L1 for both tasks with mean lexical density as the dependentvariable, excluding band levels 3 and 8 because we lacked data from one L1 group in each case.Table <strong>5.</strong>17 shows that, for Task 1, the main effect <strong>of</strong> L1 on mean lexical density is significant(F = 4.937, p
<strong>Documenting</strong> <strong>features</strong> <strong>of</strong> <strong>written</strong> <strong>language</strong> <strong>production</strong> <strong>typical</strong> at IELTS band levels – Banerjee, Franceschina + SmithTable <strong>5.</strong>18 shows that, for Task 2, there are significant effects on mean lexical density for both bandlevel (F = 6.697, p
<strong>Documenting</strong> <strong>features</strong> <strong>of</strong> <strong>written</strong> <strong>language</strong> <strong>production</strong> <strong>typical</strong> at IELTS band levels – Banerjee, Franceschina + SmithMean % <strong>of</strong> Types (L1 Chinese)Mean % <strong>of</strong> Types (L1 Spanish)WordList 1WordList 2WordList 3Not inlistWordList 1WordList 2WordList 3Not inlistBand 3 73.60 6.27 6.60 13.53 - - - -Band 4 68.41 10.47 10.64 10.47 69.31 7.16 11.25 12.28Band 5 66.85 9.07 12.86 11.23 67.81 8.22 13.93 10.05Band 6 62.67 9.65 1<strong>5.</strong>00 12.67 64.71 7.48 1<strong>5.</strong>87 11.93Band 7 6<strong>5.</strong>38 9.58 13.81 11.23 60.21 10.26 17.62 11.92Band 8 - - - - 64.54 7.57 1<strong>5.</strong>60 12.29Table <strong>5.</strong>19: The % <strong>of</strong> high and low-frequency words used by both L1 groups at differentIELTS band levels for Task 1Mean % <strong>of</strong> Types (L1 Chinese)Mean % <strong>of</strong> Types (L1 Spanish)WordList 1WordList 2WordList 3Not inlistWordList 1WordList 2WordList 3Not inlistBand 3 82.31 9.58 3.19 4.91Band 4 67.80 12.51 10.57 9.12 72.92 8.50 10.87 7.71Band 5 60.30 1<strong>5.</strong>39 12.19 12.13 64.37 9.81 14.53 11.28Band 6 5<strong>5.</strong>15 1<strong>5.</strong>40 14.60 14.85 57.73 10.38 17.59 14.30Band 7 57.69 13.59 13.91 14.81 56.94 10.85 18.51 13.70Band 8 70.61 7.27 13.48 8.64Table <strong>5.</strong>20: The % <strong>of</strong> high and low-frequency words used by both L1 groups at differentIELTS band levels for Task 2Figures <strong>5.</strong>6 and <strong>5.</strong>7 (see next page) show the relationship between the mean percentage <strong>of</strong> types fromWord Lists 1 and 2 and IELTS band level (for both L1 groups). Both line graphs show a downwardtrend in the percentage <strong>of</strong> words taken from Word Lists 1 and 2 suggesting that test-takers atincreasingly higher levels <strong>of</strong> <strong>language</strong> pr<strong>of</strong>iciency will use fewer high-frequency words. It should benoted that there is no effect for L1 and that the pattern <strong>of</strong> use <strong>of</strong> high-frequency words is very similarfor both the L1 groups. However, it is important to note that:1. test-takers at lower IELTS band levels use considerably more high-frequency words forTask 2 than for Task 1 but the use <strong>of</strong> high-frequency words falls away sharply2. the decline in use <strong>of</strong> high-frequency words is much more gradual in Task 1 than in Task 2.3. for each L1 group there is a point at which the use <strong>of</strong> high-frequency words begins to climbagain. The truncated nature <strong>of</strong> our data set makes it impossible to confirm that this trendcontinues until IELTS band level 9 but the pattern can be observed for both tasks. For the L1Chinese group in Task 1, the use <strong>of</strong> high-frequency words falls away gradually until IELTSband 6 and then begins to rise again. This rise occurs one band later for the L1 Spanish group© IELTS Research Reports Volume 7 38
<strong>Documenting</strong> <strong>features</strong> <strong>of</strong> <strong>written</strong> <strong>language</strong> <strong>production</strong> <strong>typical</strong> at IELTS band levels – Banerjee, Franceschina + Smith(at IELTS band 7). In Task 2 the rise occurs at the same point for each L1 group even thoughthe effect is less marked for the L1 Chinese group.10090Mean Word Lists 1 & 2 (Task 1)80706034567LanguageL1 ChineseL1 Spanish8IELTS Band LevelFigure <strong>5.</strong>6: Mean percentage <strong>of</strong> Types from Word Lists 1 and 2 for both L1 groups(represented in Task 1) and IELTS band level10090Mean Word Lists 1 & 2 (Task 2)80706034567LanguageL1 ChineseL1 Spanish8IELTS Band LevelFigure <strong>5.</strong>7: Mean percentage <strong>of</strong> Types from Word Lists 1 and 2 for both L1 groups(represented in Task 2) and IELTS band level© IELTS Research Reports Volume 7 39
<strong>Documenting</strong> <strong>features</strong> <strong>of</strong> <strong>written</strong> <strong>language</strong> <strong>production</strong> <strong>typical</strong> at IELTS band levels – Banerjee, Franceschina + SmithWe checked the effect <strong>of</strong> final band on mean use <strong>of</strong> Word Lists 1 and 2 by performing a one-wayANOVA. Table <strong>5.</strong>21 shows that there are significant effects for band level on mean percentage WordLists 1 and 2 for Task 2 (F = 22.003, p
<strong>Documenting</strong> <strong>features</strong> <strong>of</strong> <strong>written</strong> <strong>language</strong> <strong>production</strong> <strong>typical</strong> at IELTS band levels – Banerjee, Franceschina + Smithfindings for lexical sophistication which indicate that test-takers (particularly at lower IELTSband levels) were more likely to use high-frequency words in Task 2 than in Task 1.These findings support the conclusion that cohesive ties in the form <strong>of</strong> lexical cohesion are more likelyat higher IELTS band levels as evinced by greater lexical variation and sophistication in the scripts atthese levels. However, the findings also suggest that gains in vocabulary are salient at lower IELTSband levels but other criteria become increasingly salient at higher band levels (perhaps even as earlyas IELTS band level 7). It would be very interesting to match the findings from this analysis with aninvestigation into the rating process in order to establish the saliency <strong>of</strong> different criteria at differentIELTS band levels.6 SYNTACTIC COMPLEXITY6.1 Review <strong>of</strong> syntactic complexity measuresObjective measures <strong>of</strong> syntactic complexity in second <strong>language</strong> writing owe a lot to work done inassessing levels <strong>of</strong> first <strong>language</strong> syntactic maturity, notably the work <strong>of</strong> Hunt (1965), whodemonstrated that sentence length is not a good indicator <strong>of</strong> <strong>language</strong> pr<strong>of</strong>iciency, and that there is nolinear correlation between pr<strong>of</strong>iciency and the length <strong>of</strong> sentences as defined by conventionalpunctuation. To avoid this obvious discrepancy, Hunt used a different unit <strong>of</strong> text altogether, which hedubbed the ‘minimal terminal unit’ – the T-unit – since it is defined as the unit generated when text isdivided into the smallest possible independent segments, without leaving sentence fragments behind.Each T-unit consists <strong>of</strong> a main clause and all the subordinate clauses that belong to it. This preservesboth the subordination and the co-ordination <strong>of</strong> a <strong>written</strong> text, without yielding an unrealistically highword count per sentence. It effectively redefines the ‘sentence’ to make it more reliable and suitablefor research purposes. This unit, combined with ratio measures <strong>of</strong> independent and dependent clauses,gives more reliable indications <strong>of</strong> syntactic maturity in school children’s writing.However, the application <strong>of</strong> Hunt’s T-units to the measurement <strong>of</strong> <strong>language</strong> development in severaldifferent contexts (Cooper, 1976; Flahive and Snow, 1980) has revealed that T-units are not alwaysideal for L2 contexts, as they are not sensitive to errors in the text (Flahive and Snow, 1980; Ishikawa,1995). Wolfe-Quintero et al (1998) comprehensively reviewed the results <strong>of</strong> studies using 15 differentratio measures for syntactic complexity, and concluded that the best measures overall were clause perT-unit and dependent clause per clause. However, the authors express some reservations about howwell these could discriminate among levels where texts were placed using an holistic rater, rather thanby program level, and further difficulties in comparison are presented by the many differentdefinitions <strong>of</strong> ‘clause’ that researchers had employed in their studies. Ortega (2003) further cautionsagainst equating complexity in writing to pr<strong>of</strong>iciency, noting that writers at the top end <strong>of</strong> thepr<strong>of</strong>iciency scale may well employ rhetorical strategies <strong>of</strong> complexification at the phrasal, rather thanat the clausal, level (nominalisation, for example). She further suggests that the rhetorical styles <strong>of</strong> thewriters’ first <strong>language</strong> are likely to play a significant role in the development <strong>of</strong> this aspect <strong>of</strong> <strong>language</strong>(ibid, pp 514).This was also the experience <strong>of</strong> Mayor et al (2000) in their analysis <strong>of</strong> IELTS scripts by Greek andChinese L1 writers. They adopted a very rigid definition <strong>of</strong> a clause, that it should contain a finite verb,in their calculation <strong>of</strong> clauses per T-unit, but found that this reduced the discriminatory power themeasure had for band levels (although it still yielded significant differences for L1 and test version).It seems that by not counting the more sophisticated, non-finite clauses, more pr<strong>of</strong>icient writers arepenalised. They also note that where there are many errors in <strong>language</strong> usage, syntactic complexitymay be masked, causing quite complex texts to be rated at a lower band.© IELTS Research Reports Volume 7 41
<strong>Documenting</strong> <strong>features</strong> <strong>of</strong> <strong>written</strong> <strong>language</strong> <strong>production</strong> <strong>typical</strong> at IELTS band levels – Banerjee, Franceschina + Smith6.2 Procedure for calculating syntactic complexityForty two (42) sample texts were selected to represent the range <strong>of</strong> levels and L1 in the corpus. Thesewere coded according to the following schema.Item Code DefinitionT-unitT-unitIndependent clause plus all its associated dependent clauses; minimalterminable unit <strong>of</strong> text.Main clause M-clause Clause containing a subject and a predicate which can stand on itsown. (predicate = a phrase headed by a TENSED verb)Dependentclause:relativeDependentclause:adverbialDependentclause: nonfinitee-relc-rele-advc-adve-nonfClauses that have a similar function to an adjective, usually introducedwith 'that', 'who', 'which', or clauses that can be replaced by 'this' or'that'. The verb in the relative clause is TENSED. Relative clausescannot stand on their own, and can only be present when eitherembedded in (e-rel) or chained to (c-rel) a main clause.Clauses that have a similar function to adverbs, so their meaning is<strong>typical</strong>ly related to location, time, cause, effect, etc. The verb in theadverbial clause is TENSED. Adverbial clauses cannot stand on theirown, and can only be present when either embedded in (e-adv) orchained to (c-adv) a main clause.Clauses that have a verb WITHOUT TENSE (ie, infinitive or participialverb forms). Like other dependent clauses, non-finite clauses cannotstand on their own, but may be either embedded in (e-nonf) or chainedto (c-nonf) a main clause.c-nonfFragments Frag Parts <strong>of</strong> the T-unit that do not contain a verb at all, and are thereforenot classified as clauses, but as phrases, <strong>of</strong> various types.Table 6.2: Syntactic complexity measuresWhere candidates had <strong>written</strong> a title at the top <strong>of</strong> their text these were ignored as they were deemed toconstitute a different type <strong>of</strong> text.In order to capture important information about the sophistication <strong>of</strong> the writing we decided to use amore complex coding system for clauses, coding for subcategories <strong>of</strong> dependent clause (adverbial,relative and non-finite). This provided richer data than the overall measures could supply.We also included ellipsis as part <strong>of</strong> our calculations because it is an important manifestation <strong>of</strong>syntactic complexity and enabled us to take into account the ‘embeddedness’ <strong>of</strong> the dependent clauses.To address the problem <strong>of</strong> errors masking complexity we applied the strategy <strong>of</strong> ‘resolving’problematic clauses before coding (clauses altered in this way were clearly identified with a *).Table 6.3 presents the coding conventions adopted. These codes were used in combination to captureas fully as possible the syntactic complexity <strong>of</strong> the students’ writing.© IELTS Research Reports Volume 7 42
<strong>Documenting</strong> <strong>features</strong> <strong>of</strong> <strong>written</strong> <strong>language</strong> <strong>production</strong> <strong>typical</strong> at IELTS band levels – Banerjee, Franceschina + SmithItem Code Definition‘Double’ embedded clauseEeDependent clauses that are embedded in an alreadyembedded clause, were given the prefix ee- (or eee- forthose embedded in an ee- clause, and so on)*- clauses * Some clauses contained errors that meant that they had tobe slightly altered before they could be sensibly coded.These clauses were marked with a * to indicate that thesyntactic infelicities (or sometimes punctuation) had beenresolved. Records were kept <strong>of</strong> all these examples.Ellipsis 0 The prefix 0- was added for clauses that were consideredto be elliptical. Records were kept <strong>of</strong> all these examples.Table 6.3: Coding system adopted for clausesClearly, therefore, clauses were tagged at quite a detailed level (for example: e-rel/ ee-rel/ eee-rel).However, to calculate the key measurements <strong>of</strong> syntactic complexity – clause per t-unit and dependentclause per clause – detailed codes within categories were combined to give overall figures (such as thenumber <strong>of</strong> embedded relative clauses and the number <strong>of</strong> dependent clauses). Table 6.4 on thefollowing page presents the detailed and combined figures.© IELTS Research Reports Volume 7 43
<strong>Documenting</strong> <strong>features</strong> <strong>of</strong> <strong>written</strong> <strong>language</strong> <strong>production</strong> <strong>typical</strong> at IELTS band levels – Banerjee, Franceschina + Smith6.3 ResultsThe results <strong>of</strong> the measures are presented first globally and then separately according to level, L1 andwriting task.*0-GroupOrdinary(Resolved)(Ellipsis) *0- Sub-TOTALtotalT-unit 588 20 24 0 - 632M-clause 588 20 24 0 - 632e-rel 111 3 47 3 164ee-rel 13 0 5 2 20185eee-rel 1 0 0 0 1c-rel 36 0 8 0 - 44e-adv 19 0 0 0 19ee-adv 11 1 0 0 12 31534 (alldepclauses)c-adv 84 1 9 0 - 94e-nonf 90 0 0 0 90ee-nonf 34 0 0 0 34eee-nonf 4 1 0 0 5130eeee-nonf 1 0 0 0 1c-nonf 48 0 2 0 - 50Fragment 322 0 0 0 - 322Table 6.4: Total number <strong>of</strong> categories <strong>of</strong> clauses found in the 42 samplesclause / t-unit = (632 + 534) / 632 = 1.845dependent clause / clause = 534 / (632 + 534) = 0.458Table 6.5 and Figure 6.1 show that the two measures above provide quite different developmentalpr<strong>of</strong>iles across IELTS band levels. Mean CL/T-unit appears to be a better discriminator <strong>of</strong> level atlower band levels, but it is not clear that either measure is a good discriminator from level 5 up.© IELTS Research Reports Volume 7 44
<strong>Documenting</strong> <strong>features</strong> <strong>of</strong> <strong>written</strong> <strong>language</strong> <strong>production</strong> <strong>typical</strong> at IELTS band levels – Banerjee, Franceschina + Smith3 4 5 6 7 8Mean cl/tunit1.432292 3.014958 3.678834 3.586886 4.217046 3.377381Mean depcl/cl 0.254233 0.638888 0.784881 0.862093 0.951101 0.809609Table 6.5: Syntactic complexity measures by level (both <strong>language</strong> groups)5432Mean clause/t-unitMean dep clause/clause103 4 5 6 7 8Band levelFigure 6.1: Syntactic complexity measures by level (both <strong>language</strong> groups)The Writing task appears to have a slight effect on these measures such that Task 2 yields higherscores than Task 1 (cf Table 6.6 and 6.7 and Figure 6.2 and 6.3). However, it is not immediatelyobvious that this effect is meaningful for our purposes.3 4 5 6 7 8Task 11.43750000 1.36191309 1.52794118 1.65705128 1.51376748 2.06613757Mean c/t-unitTask 21.42708333 1.65304487 2.15089286 1.92983500 2.70327856 2.43703704Mean c/t-unitTable 6.6: Syntactic complexity measures by task (both <strong>language</strong> groups)© IELTS Research Reports Volume 7 45
<strong>Documenting</strong> <strong>features</strong> <strong>of</strong> <strong>written</strong> <strong>language</strong> <strong>production</strong> <strong>typical</strong> at IELTS band levels – Banerjee, Franceschina + Smith5432Mean clause/t-unit(Task 1)Mean clause/t-unit(Task 2)103 4 5 6 7 8Band levelFigure 6.2: Syntactic complexity measures by level (both <strong>language</strong> groups)3 4 5 6 7 8Task 1.23333333 .24874666 .27134146 .38728070 .33716692 .50000000Mean dep.clause /clauseTask 2.27513228 .39014115 .51353949 .47481246 .61393424 .57947900Mean dep.clause /clauseTable 6.7: Syntactic complexity measures by task (both <strong>language</strong> groups)© IELTS Research Reports Volume 7 46
<strong>Documenting</strong> <strong>features</strong> <strong>of</strong> <strong>written</strong> <strong>language</strong> <strong>production</strong> <strong>typical</strong> at IELTS band levels – Banerjee, Franceschina + Smith5432Mean dep clause/clause(Task 1)Mean dep clause/clause(Task 2)103 4 5 6 7 8Band levelFigure 6.3: Syntactic complexity measures by level (both <strong>language</strong> groups)Level Mean CL / T-UNIT Mean DEP CL / CL3 1.43229 0.254234 1.46409 0.310455 1.40565 0.249496 1.72796 0.414657 1.8685 0.440148 3.52452 0.83872Table 6.8: Syntactic complexity measures in the L1 Chinese group (by level, on both tasks)© IELTS Research Reports Volume 7 47
<strong>Documenting</strong> <strong>features</strong> <strong>of</strong> <strong>written</strong> <strong>language</strong> <strong>production</strong> <strong>typical</strong> at IELTS band levels – Banerjee, Franceschina + Smith5432Mean clause/t-unitMean dep clause/clause103 4 5 6 7 8Band levelFigure 6.4: Syntactic complexity measures in the L1 Chinese group (by level, on both tasks)3 4 5 6 7 8Task 11.42708333 1.38811189 1.10000000 1.56410256 1.50480769 2.55555556Mean c/t-unitTask 21.43750000 1.54006410 1.71130952 1.89181287 2.23219814 2.20000000Mean c/t-unitTable 6.9: Syntactic complexity measures in the L1 Chinese group (by task)© IELTS Research Reports Volume 7 48
<strong>Documenting</strong> <strong>features</strong> <strong>of</strong> <strong>written</strong> <strong>language</strong> <strong>production</strong> <strong>typical</strong> at IELTS band levels – Banerjee, Franceschina + Smith5432Mean dep clause/clause(Task 1)Mean dep clause/clause(Task 2)103 4 5 6 7 8Band levelFigure 6.5: Syntactic complexity measures in the L1 Chinese group (by task)Chinese 3 4 5 6 7 8Task 1.23333333 .27022059 .08333333 .35789474 .33119658 .60869565Mean dep.clause / clauseTask 2.27513228 .35067568 .41565041 .47140523 .54909318 .54545455Mean dep.clause / clauseTable 6.10: Syntactic complexity measures in the L1 Chinese group (by task)© IELTS Research Reports Volume 7 49
<strong>Documenting</strong> <strong>features</strong> <strong>of</strong> <strong>written</strong> <strong>language</strong> <strong>production</strong> <strong>typical</strong> at IELTS band levels – Banerjee, Franceschina + Smith5432Mean dep clause/clause(Task 1)Mean dep clause/clause(Task 2)103 4 5 6 7 8Band levelFigure 6.6: Syntactic complexity measures in the L1 Chinese group (by task)Level Mean C/T-UNIT Mean DEP C / CL4 1.55087 0.328445 2.27318 0.535396 1.85893 0.447447 2.34854 0.510968 2.18849 0.52107Table 6.11: Syntactic complexity measures in the L1 Spanish group (by level, on both tasks)© IELTS Research Reports Volume 7 50
<strong>Documenting</strong> <strong>features</strong> <strong>of</strong> <strong>written</strong> <strong>language</strong> <strong>production</strong> <strong>typical</strong> at IELTS band levels – Banerjee, Franceschina + Smith5432Mean clause/t-unitMean dep clause/clause103 4 5 6 7 8Band levelFigure 6.7: Syntactic complexity measures in the L1 Spanish group (by level, on both tasks)Spanish 4 5 6 7 8Task 11.33571429 1.95588235 1.75000000 1.52272727 1.82142857Mean c/t-unitTask 21.76602564 2.59047619 1.96785714 3.17435897 2.55555556Mean c/t-unitTable 6.12: Syntactic complexity measures in the L1 Spanish group (by task)© IELTS Research Reports Volume 7 51
<strong>Documenting</strong> <strong>features</strong> <strong>of</strong> <strong>written</strong> <strong>language</strong> <strong>production</strong> <strong>typical</strong> at IELTS band levels – Banerjee, Franceschina + Smith5432Mean clause/t-unit(Task 1)Mean clause/t-unit(Task 2)103 4 5 6 7 8Band levelFigure 6.8: Syntactic complexity measures in the L1 Spanish group (by task)Spanish 4 5 6 7 8Task 1.22727273 .45934959 .41666667 .34313725 .44565217Mean dep.clause /clauseTask 2.42960663 .61142857 .47821970 .67877530 .59649123Mean dep.clause /clauseTable 6.13: Syntactic complexity measures in the L1 Spanish group (by task)© IELTS Research Reports Volume 7 52
<strong>Documenting</strong> <strong>features</strong> <strong>of</strong> <strong>written</strong> <strong>language</strong> <strong>production</strong> <strong>typical</strong> at IELTS band levels – Banerjee, Franceschina + Smith5432Mean dep clause/clause(Task 1)Mean dep clause/clause(Task 2)103 4 5 6 7 8Band levelFigure 6.9: Syntactic complexity measures in the L1 Spanish group (by task)Embedding a dependent clause in the main clause, or in another dependent clause, could be argued tobe a more complex way <strong>of</strong> structuring a sentence than simply chaining the clauses togethersequentially. For this reason the coding system was designed to take this into account, to make theidentification <strong>of</strong> embedded clauses possible, as well as clauses that were doubly (and triply) embedded.In total there were 534 dependent clauses identified in the 42 sample texts coded in this way. Of these,346 (65%) were embedded in other clauses:Ordinary*(Resolved)0-(Ellipsis)*0- Sub-total Grouptotalse-rel 111 3 47 3 164ee-rel 13 0 5 2 20185eee-rel 1 0 0 0 1e-adv 19 0 0 0 1931ee-adv 11 1 0 0 12e-nonf 90 0 0 0 90ee-nonf 34 0 0 0 34eee-nonf 4 1 0 0 5130eeee-nonf 1 0 0 0 1Table 6.14: Embeddedness measures (both L1 groups)© IELTS Research Reports Volume 7 53
<strong>Documenting</strong> <strong>features</strong> <strong>of</strong> <strong>written</strong> <strong>language</strong> <strong>production</strong> <strong>typical</strong> at IELTS band levels – Banerjee, Franceschina + SmithLevel e-rel ee-rel eee-rel e-adv ee-adv e-nonf eenonfeeenonfeeeenonftotal3 9 2 0 0 0 5 0 0 0 164 15 2 0 1 1 6 1 0 0 265 7 0 0 1 0 6 2 0 0 166 15 2 0 1 0 7 2 0 0 277 8 0 0 0 0 12 2 1 0 238 9 0 0 2 1 6 2 0 0 20total 63 6 0 5 2 42 9 1 0 128Table 6.15: Embeddedness measures (L1 Chinese group)Level e-rel ee-rel eee-rel e-adv ee-adv e-nonf eenonfeeenonfeeeenonftotal3 - - - - - - - - - -4 19 1 1 1 1 3 2 1 1 305 20 3 0 10 5 20 7 0 0 656 22 4 0 0 1 5 2 0 0 347 21 4 0 0 2 11 9 3 0 508 19 2 0 3 2 9 5 0 0 40total 101 14 1 14 11 48 25 4 1 219Table 6.16: Embeddedness measures (L1 Spanish group)These tables show the number <strong>of</strong> embedded clauses at each level for each <strong>language</strong> group. No cleartrends can be discerned in any category. This may mean that embeddedness is not an indication <strong>of</strong>syntactic complexity, or that there is no linear relationship between complexity and embeddedness.Ellipsis was another important factor that was identified during the coding process. A total <strong>of</strong> 101elliptical clauses were counted (not including t-units); these were quite evenly distributed amongChinese and Spanish candidates, and no clear trends could be discerned in terms <strong>of</strong> level.© IELTS Research Reports Volume 7 54
<strong>Documenting</strong> <strong>features</strong> <strong>of</strong> <strong>written</strong> <strong>language</strong> <strong>production</strong> <strong>typical</strong> at IELTS band levels – Banerjee, Franceschina + SmithLevel*0-erel*oeerel0-cadv0-cnonf0-crel0-eadv0-enonf0-erel0-eerel0-mclausetotal3 2 2 0 0 0 0 0 4 0 0 84 0 0 0 0 0 0 0 7 1 3 115 0 0 2 0 0 0 0 4 0 3 96 0 0 0 0 1 1 1 3 1 2 97 0 0 1 1 4 0 0 6 0 2 148 0 0 2 1 0 0 0 1 0 0 4total 2 2 5 2 5 1 1 25 2 10 54Table 6.17: Ellipsis measures (L1 Chinese group)Level*0-erel*oeerel0-cadv0-cnonf0-crel0-eadv0-enonf0-erel0-eerel0-mclausetotal4 0 0 0 0 0 0 0 4 0 8 125 0 0 0 0 1 0 0 3 0 2 66 0 0 1 0 0 0 0 8 1 3 137 1 0 0 0 1 0 0 5 1 0 88 0 0 3 0 1 0 0 2 1 1 8total 1 0 4 0 3 0 0 22 3 14 47Table 6.18: Ellipsis measures (L1 Spanish group)The figures above suggest that ellipsis is not an indication <strong>of</strong> syntactic complexity, or that there is nolinear relationship between complexity and ellipsis.Overall the findings for syntactic complexity measures have not produced a clear developmentalpicture matching the IELTS band levels 3–8. This could be because syntactic complexity by itself isnot a good indicator <strong>of</strong> increased L2 pr<strong>of</strong>iciency as measured by this test or because the specificcomplexity measures investigated here are not good indicators <strong>of</strong> increasing IELTS levels.© IELTS Research Reports Volume 7 55
<strong>Documenting</strong> <strong>features</strong> <strong>of</strong> <strong>written</strong> <strong>language</strong> <strong>production</strong> <strong>typical</strong> at IELTS band levels – Banerjee, Franceschina + Smith7 GRAMMATICAL ACCURACY7.1 Review <strong>of</strong> measuresThe last aspect <strong>of</strong> task-takers’ performance to be investigated in this study is grammatical accuracy.Accuracy measures have been used extensively in research in first and second <strong>language</strong> development,and they also form part <strong>of</strong> most rating scales, as indicated in Chapter 2.The specific measures used here have been borrowed from first and second <strong>language</strong> acquisitionresearch. They were originally used by Brown (1973) in his seminal longitudinal study <strong>of</strong> L1development and soon after adopted by other L1 and L2 researchers (de Villiers 1973, Dulay and Burt1973, 1974, Bailey, Madden and Krashen 1974, Andersen 1978, Makino, 1980, among many others;see Goldschneider and DeKeyser 2001 for a recent meta-study <strong>of</strong> this literature).These studies uncovered a fairly stable set <strong>of</strong> hierarchies <strong>of</strong> grammatical accuracy in L2 learners.These hierarchies seemed to be the same regardless <strong>of</strong> L1 background, type <strong>of</strong> input received orlearning setting (eg instructed vs. naturalistic). For example, Andersen (1978) found the followingaccuracy hierarchy for verb- and noun-related phenomena:copula > aspect (ing) > tense (past) > SV agreement (3PS ‘s’)definite article > plural, indefinite article > possessive ‘sThat is, the copula was the most accurate verb-related morpheme across L2 learners and animplicational scale could be established such that decreasing levels <strong>of</strong> accuracy were found in learnersas the scale proceeds to the right. The noun-related hierarchy works in the same way.We decided to investigate a range <strong>of</strong> morphemes known to be early and late acquired. Our expectationwas that the early morphemes (namely copula and plural marking) would perhaps be gooddiscriminators <strong>of</strong> levels at the low end <strong>of</strong> the scale and that late morphemes (namely 3rd personsingular ‘s’ and passives) may be good discriminators <strong>of</strong> levels at the higher end <strong>of</strong> the scale.A caveat about working with errors is appropriate at this point. The pitfalls <strong>of</strong> learner error analysis arewell-known (see Ellis and Barkhuizen, 2005, for a recent review). Some <strong>of</strong> the difficulties involved inclassifying and quantifying errors have been documented in studies with close links to ours (see forexample the discussion in Mayor et al 2002, pp 5 and appendix 1, or Hawkey and Barker, 2004, pp147-148).However difficult the task <strong>of</strong> determining grammatical accuracy may be, we believe that there isenough evidence to suggest that accuracy is a good indicator <strong>of</strong> L2 pr<strong>of</strong>iciency. For example, error ratewas found to be a good predictor <strong>of</strong> pr<strong>of</strong>iciency level in Hawkey and Barker (2004, pp 147) and inWolfe-Quintero et al’s meta-study (1998, pp 118). More generally, grammatical accuracy hastraditionally been used as a yardstick <strong>of</strong> development in first and second <strong>language</strong> acquisition(eg Brown, 1973; de Villiers and de Villiers, 1973; Dulay and Burt, 1973 and 1974; Bailey et al, 1974;Zobl and Liceras, 1994; Goldschneider and DeKeyser, 2001), and the findings <strong>of</strong> these studies haveprovided very important insights into the complexities <strong>of</strong> <strong>language</strong> development. It is reasonable toexpect that the investigation <strong>of</strong> the development <strong>of</strong> grammatical accuracy across IELTS band levelswill also allow us to shed some light on the research questions at the centre <strong>of</strong> the present study.© IELTS Research Reports Volume 7 56
<strong>Documenting</strong> <strong>features</strong> <strong>of</strong> <strong>written</strong> <strong>language</strong> <strong>production</strong> <strong>typical</strong> at IELTS band levels – Banerjee, Franceschina + Smith7.2 Procedure for calculating grammatical accuracyWe adopted standard calculations <strong>of</strong> grammatical accuracy (see Ellis and Barkhuizen, 2005, for moredetails and critical discussion <strong>of</strong> this methodology).Target-Like UseTLU =number <strong>of</strong> correct suppliance in obligatory contextsnumber <strong>of</strong> obligatory contexts + number <strong>of</strong> suppliance in non-OCs7.3 ResultsOur findings are compatible with the predictions in the L2 development literature: accuracy on pluraland copula was higher than accuracy on SV agreement and passives across levels and L1 groups.SV agreement and passives appear as the best measures <strong>of</strong> increased pr<strong>of</strong>iciency across the wholeband range investigated here, and we believe they deserve further investigation, especially third personsingular ‘s’ marking, as it was not affected by the learner’s L1.The following tables and graphs summarise the main global findings, followed by more detaileddiscussion <strong>of</strong> other findings that should be taken into account when interpreting the global accuracyscores.© IELTS Research Reports Volume 7 57
<strong>Documenting</strong> <strong>features</strong> <strong>of</strong> <strong>written</strong> <strong>language</strong> <strong>production</strong> <strong>typical</strong> at IELTS band levels – Banerjee, Franceschina + Smithnumber on 'this'number on 'that'number on 'these'number on 'those'copula (am, is, are)copula (was, were)S-V agreement(3PS 's')Level 3 0.86 0.92 0.5 0.79 1 0.34 0.41passivesLevel 4 0.873 0.973 0.688 1 0.786 0.661 0.526 0.427Level 5 0.886 0.983 0.831 0.923 0.895 0.875 0.669 0.659Level 6 0.982 0.958 0.952 0.909 0.935 0.937 0.81 0.714Level 7 0.971 1 0.944 1 0.966 0.964 0.838 0.767Level 8 1 1 1 0.857 1 1Table 7.1: TLU: L1 Chinese – Tasks 1 and 210.80.60.4number on 'this'number on 'that'number on 'these'number on 'those'copula (am, is, are)copula (was, were)S-V agreement (3PS 's')passives0.203 4 5 6 7 8Band levelFigure 7.1: TLU: L1 Chinese – Tasks 1 and 2© IELTS Research Reports Volume 7 58
<strong>Documenting</strong> <strong>features</strong> <strong>of</strong> <strong>written</strong> <strong>language</strong> <strong>production</strong> <strong>typical</strong> at IELTS band levels – Banerjee, Franceschina + Smithnumber on 'this'number on 'that'number on 'these'number on 'those'copula (am, is, are)copula (was, were)S-V agreement (3PS 's')PassivesLevel 3Level 4 0.769 0.944 0.526 0.667 0.946 1 0.348 0.8Level 5 0.835 0.864 0.313 0.538 0.912 0.914 0.623 0.757Level 6 0.864 1 0.564 1 0.981 0.9 0.8 0.905Level 7 0.851 0.969 0.618 0.9 0.993 1 0.913 0.918Level 8 0.911 1 0.636 0.97 0.889 0.933 0.971Table 7.2: TLU: L1 Spanish – Tasks 1 and 210.80.60.4number on 'this'number on 'that'number on 'these'number on 'those'copula (am, is, are)copula (was, were)S-V agreement (3PS 's')passives0.203 4 5 6 7 8Band levelFigure 7.2: TLU: L1 Spanish – Tasks 1 and 2© IELTS Research Reports Volume 7 59
<strong>Documenting</strong> <strong>features</strong> <strong>of</strong> <strong>written</strong> <strong>language</strong> <strong>production</strong> <strong>typical</strong> at IELTS band levels – Banerjee, Franceschina + Smith7.3.1 Default use <strong>of</strong> the verbs ‘be’ and ‘have’Even when the meanings assigned to the verbs ‘be’ and ‘have’ were slightly unusual, if thegrammatical use in terms <strong>of</strong> agreement and tense was correct they were computed as correct forpurposes <strong>of</strong> grammatical accuracy in the TLU calculation. However, the use <strong>of</strong> these two verbs inseveral instances seemed inappropriate. More specifically, these verbs appear to have been used in asemantic default way (ie they were used in contexts where verbs with more precise meanings couldhave been used). This is more common in lower level scripts, but there are some cases <strong>of</strong> high levelscripts where this can be seen too.One implication <strong>of</strong> this finding may be that vocabulary measures concentrating on range <strong>of</strong> verbtokens used might be worth looking into in more detail. It may be the case that TTR applied to verbsonly will be a good indicator <strong>of</strong> L2 pr<strong>of</strong>iciency, at least when compared with overall TTR or TTRapplied to other word categories. This is an empirical matter worth investigating further.7.3.2 Some number agreement errors seem due to incorrect lexical learningThere are several examples <strong>of</strong> number agreement errors with certain nouns.Typical nouns involved:• information• news• people• women• police.Examples:and these information are all belong to four countries: Jamaica, Ecuador, Singapore andBolivia (088-9873-CN002-100104-000-1-6)To such an extent, the police does not exclude the weapons but require their assistance whenliving in dangerous environments. (110-3367-CN172-200304-000-2-5)7.3.3 Prefabricated patterns do not guarantee TL <strong>production</strong>Prefabricated patterns are known to be part <strong>of</strong> development, especially early on. We found that evenquite frequent constructions were open to grammatical errors.It is well know to everybody that the socity need competition.(037-1997-CN902-230202-083-2-4)It can be clear seen that carbon dioxide produced from power stations takes the biggestamount all over the 2 decades. (025-4749-CN911-121002-090-1-6)7.3.4 Difficulties determining obligatory contexts with low-level scriptsSometimes the clause structure <strong>of</strong> sections <strong>of</strong> texts is very hard to analyse. This is more frequent at thelowest levels <strong>of</strong> pr<strong>of</strong>iciency. When agreement could not be reached on what the correct analysis <strong>of</strong> anitem should be, the item was discarded from the accuracy analysis. A log was kept <strong>of</strong> which itemswere discarded, so further analyses <strong>of</strong> these contexts could be done in future if required.7.3.5 Difficulty distinguishing formulaic vs. productive use <strong>of</strong> <strong>language</strong>We treated all <strong>language</strong> produced by the learners as productive <strong>language</strong>, as it was felt that decisionsabout whether specific utterances were cases <strong>of</strong> formulaic or productive use were to a large degreearbitrary when based on a reader’s judgement. More careful analysis <strong>of</strong> formulaic and/or repetitive<strong>language</strong> use seems to us to be an interesting area for further exploration, but appropriatemethodological techniques need to be developed before this can be done in a reliable way.© IELTS Research Reports Volume 7 60
<strong>Documenting</strong> <strong>features</strong> <strong>of</strong> <strong>written</strong> <strong>language</strong> <strong>production</strong> <strong>typical</strong> at IELTS band levels – Banerjee, Franceschina + SmithWe felt that this was beyond what could be realistically achieved in the time available. However, wehave labelled the cases that at first sight seem obvious candidates to be classified as formulaic use inthe TLU analysis sheets to facilitate further analysis.7.3.6 Inflation <strong>of</strong> scores by repetition <strong>of</strong> certain structuresIn some cases, writers have used the same lexical or grammatical structure repeatedly and this may beinterpreted as an inflation factor. It is difficult to decide whether these repeated structures should bediscarded. We decided to leave them in, but would like the reader to be aware <strong>of</strong> this.Future studies could also look in more detail at the error clusters identified. This work could in turn beused to build materials for teachers, course directors, testers and other stake-holders. For example,concrete examples <strong>of</strong> the <strong>language</strong> described in marking guidelines could be identified from the codeddatabase.8 CONCLUSIONSThe principle objectives <strong>of</strong> this study have been to document the linguistic markers <strong>of</strong> different levels<strong>of</strong> English <strong>language</strong> writing pr<strong>of</strong>iciency defined by the academic version <strong>of</strong> the IELTS writing module.We sampled 275 scripts from test-takers in two major L1 groups (L1 Chinese and L1 Spanish) atlevels 3–8 on the IELTS band scale. We analysed the use <strong>of</strong> the demonstratives ‘this’, ‘that’, ‘these’ inour corpus, finding that L1 interacts with the task to affect demonstrative use in a number <strong>of</strong> ways.1. L1 Spanish speakers use approximately 50% more demonstratives than L1 Chinese speakers.2. For L1 Chinese speakers the task affects the number <strong>of</strong> demonstratives used but therelationship between demonstrative use and IELTS band level remains the same. For L1Spanish speakers, the number <strong>of</strong> demonstratives used is fairly stable but the relationshipbetween demonstrative use and IELTS band level differs from Task 1 to Task 2.We observed, however, that use <strong>of</strong> demonstratives appears to tail <strong>of</strong>f at higher levels <strong>of</strong> <strong>language</strong>pr<strong>of</strong>iciency, suggesting that other cohesive ties (such as lexical ties) come into use. We wouldtherefore expect performances at higher IELTS band levels to display greater lexical variation andsophistication.The findings from our analysis <strong>of</strong> vocabulary richness support this expectation in the sense that scriptsat increasing IELTS band levels displayed greater lexical variation and sophistication. Other findingswere:1. The L1 <strong>of</strong> the test-taker affects lexical output, lexical variation and lexical density but it doesnot affect lexical sophistication.2. The task affects vocabulary richness in different ways. Task 1 scripts tend to be more lexicallydense than Task 2 scripts and also appear to generate the use <strong>of</strong> fewer high-frequency wordsas a proportion <strong>of</strong> total words. However, Task 2 scripts are more lexically varied (as measuredby type-token ratio).Our results also suggest that gains in vocabulary are salient at lower IELTS band levels but that othercriteria become increasingly salient at higher band levels (perhaps even as early as IELTS bandlevel 7). It would be very interesting to take these findings forward by matching these analyses with aninvestigation into the rating process in order to establish the saliency <strong>of</strong> different criteria at differentIELTS band levels. Secondly, future research could explore ways <strong>of</strong> modelling the interactionsbetween the different measures in the expectation that different measures group together to contributeto test-takers’ scores at different IELTS band levels.© IELTS Research Reports Volume 7 61
<strong>Documenting</strong> <strong>features</strong> <strong>of</strong> <strong>written</strong> <strong>language</strong> <strong>production</strong> <strong>typical</strong> at IELTS band levels – Banerjee, Franceschina + SmithOur findings for complexity measures were somewhat disappointing, in that by themselves none <strong>of</strong> themeasures investigated seemed to provide a good predictor <strong>of</strong> IELTS band level. However, negativefindings are also to some extent useful findings in that they should help future researchers to decidewhich measures are not worth pursuing for tracking increasing levels <strong>of</strong> pr<strong>of</strong>iciency.Finally, the analysis <strong>of</strong> grammatical accuracy proved to be quite informative, and the predictions fromthe literature on L2 development were largely confirmed by our data. This suggests to us that futureresearch on predictors <strong>of</strong> levels <strong>of</strong> L2 pr<strong>of</strong>iciency as measured by the IELTS academic writing tasksshould look further into the accuracy <strong>of</strong> grammatical areas such as SV agreement and passives, asthese proved good discriminators <strong>of</strong> level regardless <strong>of</strong> L1 and writing task.© IELTS Research Reports Volume 7 62
<strong>Documenting</strong> <strong>features</strong> <strong>of</strong> <strong>written</strong> <strong>language</strong> <strong>production</strong> <strong>typical</strong> at IELTS band levels – Banerjee, Franceschina + SmithREFERENCESAndersen, RW, 1978, ‘An implicational model for second <strong>language</strong> research’ in Language Learning,vol 28, pp 221-282Bachman, LF and Cohen, AD (eds), 1998, Interfaces between second <strong>language</strong> acquisition and<strong>language</strong> testing research, Cambridge University Press, CambridgeBailey, N, Madden, CG and Krashen, SD, 1974, ‘Is there a ‘natural sequence’ in adult second<strong>language</strong> learning?’ in Language Learning, vol 24, pp 235-243Botley, SP, 2000, Corpora and discourse anaphora: using corpus evidence to test theoretical aims,PhD thesis, Lancaster UniversityBotley, S and McEnery, AM, 2000, ‘Discourse anaphora: the need for synthesis’ in Corpus-based andcomputational approaches to discourse anaphora, eds S Botley and AM McEnery, John Benjamins,Amsterdam, pp 1-41Brown, R, 1973, A first <strong>language</strong>: the early stages, Harvard University Press, Cambridge, MAChurch, KW and Gale, WA, 1995, ‘Poisson mixtures’ in N atural Language Engineering, vol 1(2),pp 163-190Clahsen, H and Muysken, P, 1986, ‘The availability <strong>of</strong> universal grammar to adult and child learners:a study <strong>of</strong> the acquisition <strong>of</strong> German word order’ in Second Language Research, vol 2, pp 93-119Clahsen, H and Muysken, P, 1989, ‘The UG paradox in SLA’ in Second Language Research, vol 5,pp 1-29Cooper, TC, 1976, ‘Measuring <strong>written</strong> syntactic patterns <strong>of</strong> second <strong>language</strong> learners <strong>of</strong> German’in Journal <strong>of</strong> Educational Research, vol 69, pp 176-183Council <strong>of</strong> Europe, 2001, Common European framework <strong>of</strong> reference: learning, teaching, assessment,Cambridge University Press, CambridgeCoxhead, A, 2000, ‘A new academic word list’ in TESOL Quarterly, vol 34, pp 213-238De Villiers, J, and de Villiers, P, 1973, ‘A cross-sectional study <strong>of</strong> the development <strong>of</strong> grammaticalmorphemes in child speech’ in Journal <strong>of</strong> Psycholinguistic Research, vol 2, pp 267-278Douglas, D, 2001, ‘Performance and consistency in second <strong>language</strong> acquisition and <strong>language</strong> testingresearch: a conceptual gap’ in Second Language Research, vol 17, pp 442-456Dulay, H and Burt, M, 1973, ‘Should we teach children syntax?’ in Language Learning, vol 23,pp 245-258Dulay, H and Burt, M, 1974, ‘Natural sequences in child second <strong>language</strong> acquisition’ inLanguage Learning, vol 24, pp 37-53Durán, P, Malvern, D, Richards, B and Chipere, N, 2004, ‘Developmental trends in lexical diversity’in Applied Linguistics, vol 25(2), pp 220-242Ellis, R, 2001, ‘Some thoughts on testing grammar: An SLA perspective’ in Experimenting withuncertainty: essays in honour <strong>of</strong> Alan Davies, eds C Elder, A Brown, E Grove, K Hill, N Iwashita,T Lumley, T McNamara, and K O’Loughlin, University <strong>of</strong> Cambridge Local Examinations Syndicate(UCLES), Cambridge, pp 251 – 263© IELTS Research Reports Volume 7 63
<strong>Documenting</strong> <strong>features</strong> <strong>of</strong> <strong>written</strong> <strong>language</strong> <strong>production</strong> <strong>typical</strong> at IELTS band levels – Banerjee, Franceschina + SmithEllis, R and Barkhuizen, G, 2005, Analysing learner <strong>language</strong>, Oxford University Press, OxfordEngber, C, 1995, ‘The relationship <strong>of</strong> lexical pr<strong>of</strong>iciency to the quality <strong>of</strong> ESL compositions’in Journal <strong>of</strong> Second Language Writing, vol 4, pp 139-155Flahive, DE and Snow, BG, 1980, ‘Measures <strong>of</strong> syntactic complexity in evaluating ESL compositions’in Research in <strong>language</strong> testing, eds JW Oller and K Perkins, Newbury House, Rowley, MA,pp 171-176Flowerdew, L, 1998, ‘Integrating expert and inter<strong>language</strong> computer corpora findings on causality:discoveries for teachers and students’ in English for Specific Purposes, vol 17, pp 329-34<strong>5.</strong>Ghazzoul, N, in progress, ‘Coherence in English academic writing <strong>of</strong> Arab EFL learners with specialreference to Syrian and Emirati university students’, PhD thesis in progress, Lancaster UniversityGoldschneider, JM and DeKeyser, RM, 2001, ‘Explaining the 'natural order <strong>of</strong> L2 morphemeacquisition' in English: a meta-analysis <strong>of</strong> multiple determinants’ in Language Learning,vol 51, pp 1-50Halliday, MAK, 1985, Introduction to functional grammar, Arnold, LondonHalliday, MAK, 1994, An introduction to functional grammar (2 nd Edition), Edward Arnold, LondonHalliday, MAK and Hasan, R, 1976, Cohesion in English, Longman Group Ltd, LondonHawkey, R and Barker, F, 2004, ‘Developing a common scale for the assessment <strong>of</strong> writing’in Assessing Writing, vol 9, pp 122-159Homburg, TJ, 1984, ‘Holistic evaluation <strong>of</strong> ESL compositions: can it be validated objectively?’in TESOL Quarterly, vol 18, pp 87-107Hunt, KW, 1965, Grammatical structures <strong>written</strong> at three grade levels, The National Council <strong>of</strong>Teachers <strong>of</strong> English, Urbana, ILHyltenstam, K and Pienemann, M, 1985, Modelling and assessing second <strong>language</strong> development,Multilingual Matters, ClevedonInternational English Language Testing System (IELTS), (accessed 09 January 2006)International English Language Testing System (IELTS), 2005, IELTS Handbook, (accessed 14 September 2006)Ishikawa, S, 1995, ‘Objective measurement <strong>of</strong> low pr<strong>of</strong>iciency EFL narrative writing’ inJournal <strong>of</strong> Second Language Writing, vol 4, pp 51-70Kennedy, C and Thorp, D, 2002, A corpus investigation <strong>of</strong> linguistic responses to an IELTS AcademicWriting task, IELTS British Council Research ProgrammeLarsen-Freeman, D, 1978, ‘An ESL index <strong>of</strong> development’ in TESOL Quarterly, vol 12, pp 439-448Laufer, B, 2001, ‘Quantitative evaluation <strong>of</strong> vocabulary’ in Experimenting with uncertainty: essays inhonour <strong>of</strong> Alan Davies, eds C Elder, A Brown, E Grove, K Hill, N Iwashita, T Lumley, T McNamara,and K O’Loughlin, University <strong>of</strong> Cambridge Local Examinations Syndicate (UCLES), Cambridge,pp 241-250Laufer, B and Nation, P, 1995, ‘Vocabulary size and use: lexical richness in L2 <strong>written</strong> <strong>production</strong>’in Applied Linguistics, vol 16, pp 307-322© IELTS Research Reports Volume 7 64
<strong>Documenting</strong> <strong>features</strong> <strong>of</strong> <strong>written</strong> <strong>language</strong> <strong>production</strong> <strong>typical</strong> at IELTS band levels – Banerjee, Franceschina + SmithMakino, T, 1980, ‘Acquisition order <strong>of</strong> grammatical morphemes by Japanese secondary schoolstudents’ in Journal <strong>of</strong> Hokkaido University <strong>of</strong> Education, vol 30, pp 101-148Malvern, D and Richards, B, 2002, ‘Investigating accommodation in <strong>language</strong> pr<strong>of</strong>iciency interviewsusing a new measure or lexical diversity’ in Language Testing, vol 19, pp 85-104Mayor, B, Hewings, A, North, S, Swann, J and C<strong>of</strong>fin, C, 2002, A linguistic analysis <strong>of</strong> Chinese andGreek L1 scripts for IELTS Academic Writing Task 2, IELTS British Council Research ProgrammeMcNamara, T, 1996, Measuring second <strong>language</strong> performance, Longman, LondonMeara, P and Miralpeix, I, 2004, D_Tools, Lognostics (Centre for Applied Language Studies,University <strong>of</strong> Wales Swansea), SwanseaMeisel, JM, 1997, ‘The acquisition <strong>of</strong> the syntax <strong>of</strong> negation in French and German: contrasting firstand second <strong>language</strong> development’ in Second Language Research, vol 13, pp 227-263Muhr, T, 2005, Atlas-ti, (accessed 14 September 2006)Nation, P and Heatley, A, 1996, Range, School <strong>of</strong> Linguistics and Applied Language Studies,Victoria University <strong>of</strong> Wellington, WellingtonO’Loughlin, K, 2001, The equivalence <strong>of</strong> semi-direct speaking tests, University <strong>of</strong> CambridgeLocal Examinations Syndicate and Cambridge University Press, CambridgeOdlin, T, 2003, ‘Cross-linguistic influence’ in Handbook <strong>of</strong> Second Language Acquisition,eds CJ Doughty and MH Long, Blackwell, Malden, MA, pp 436-486Ortega, L, 2003, ‘Syntactic complexity measures and their relationship to L2 pr<strong>of</strong>iciency: a researchsynthesis <strong>of</strong> college-level L2 writing’ in Applied Linguistics, vol 24, pp 492-518Perdue, C and Klein, W, 1993, ‘Concluding remarks’, in Adult <strong>language</strong> acquisition: Crosslinguisticperspectives. Volume II: The results, ed C Perdue, Cambridge University Press, Cambridge,pp 253-272Read, J, 2000, Assessing vocabulary, Cambridge University Press, CambridgeRead, J, 2005, ‘Applying lexical statistics to the IELTS speaking test’, Cambridge Research N otes,vol 20, pp 12-16Shaw, SD, 2002, ‘IELTS writing: revising assessment criteria and scales (Phase 2)’,Cambridge Research N otes, vol 10, pp 10-13Shaw, SD, 2004, ‘IELTS writing: revising assessment criteria and scales (Phase 3)’,Cambridge Research N otes, vol 16, pp 3-7Shohamy, E, 1998, ‘How can <strong>language</strong> testing and SLA benefit from each other? The case <strong>of</strong>discourse’ in Interfaces between second <strong>language</strong> acquisition and <strong>language</strong> testing research,eds LF Bachman and AD Cohen, 1998, Cambridge University Press, Cambridge, pp 156-176Skehan, P, 1989, Individual differences in second <strong>language</strong> learning, Arnold, LondonSlav<strong>of</strong>f, GR and Johnson, J, 1995, ‘The effects <strong>of</strong> age on the rate <strong>of</strong> learning a second <strong>language</strong>’in Studies in Second Language Acquisition, vol 17, pp 1-16Teddick, D, 1990, ‘ESL writing assessment: subject matter knowledge and its impact on performance’in English for Specific Purposes, vol 9, pp 123-143© IELTS Research Reports Volume 7 65
<strong>Documenting</strong> <strong>features</strong> <strong>of</strong> <strong>written</strong> <strong>language</strong> <strong>production</strong> <strong>typical</strong> at IELTS band levels – Banerjee, Franceschina + SmithUre, J, 1971, ‘Lexical density and register differentiation’ in Applications <strong>of</strong> Linguistics,eds GE Perren and JLM Trimm, Cambridge University Press, CambridgeWeigle, SC, 2002, Assessing writing, Cambridge University Press, CambridgeWest, M, 1953, A general service list <strong>of</strong> English words, Longman, LondonWolfe Quintero, K, Inagaki, S and Kim, H-Y, 1998, Second <strong>language</strong> development in writing:measures <strong>of</strong> fluency, accuracy and complexity, in Technical Report 17. Honolulu: University <strong>of</strong>Hawai'i at Manoa, Second Language Teaching and Curriculum CentreZobl, H and Liceras, JM, 1994, ‘Review article: functional categories and acquisition orders’in Language Learning, vol 44, pp 159-180© IELTS Research Reports Volume 7 66
<strong>Documenting</strong> <strong>features</strong> <strong>of</strong> <strong>written</strong> <strong>language</strong> <strong>production</strong> <strong>typical</strong> at IELTS band levels – Banerjee, Franceschina + SmithAPPENDIX 1The mean frequency <strong>of</strong> use <strong>of</strong> the demonstratives ‘this’, ‘that’, ‘these’ and ‘those’ (including standarddeviations) according to L1 and IELTS band level for Task 1L1 Chinese Means (SD)L1 Spanish Means (SD)this that these those this that these thoseBand 30.140.710.140.00- - - -(N = 7/0)(0.38)(1.11)(0.38)(0.00)Band 40.660.380.140.032.131.380.870.25(N = 29/8)(0.94)(0.49)(0.44)(0.19)(1.89)(2.77)(2.10)(0.46)Band 50.670.160.760.092.210.570.290.07(N = 45/28)(0.80)(0.42)(1.13)(0.36)(1.99)(0.96)(0.98)(0.26)Band 60.760.790.530.132.110.290.390.11(N = 38/38)(1.05)(1.17)(0.69)(0.48)(1.57)(0.46)(0.86)(0.39)Band 70.671.440.440.221.690.500.470.19(N = 9/32)(1.00)(1.94)(0.73)(0.44)(1.45)(0.84)(0.72)(0.47)Band 8- - - - 2.570.431.000.00(N = 0/7)(2.15)(0.79)(1.00)(0.00)The mean frequency <strong>of</strong> use <strong>of</strong> the demonstratives ‘this’, ‘that’, ‘these’ and ‘those’ (including standarddeviations) according to L1 and IELTS band level for Task 2L1 Chinese Means (SD)L1 Spanish Means (SD)this that these those this that these thoseBand 31.140.290.000.00- - - -(N = 7/0)(2.61)(0.49)(0.00)(0.00)Band 41.621.210.550.031.381.250.250.00(N = 29/8)(1.61)(1.63)(0.78)(0.19)(1.12)(1.04)(0.71)(0.00)Band 51.330.890.440.091.861.250.290.25(N = 45/28)(1.35)(1.27)(0.87)(0.29)(1.74)(1.43)(0.66)(0.52)Band 61.711.030.710.372.661.030.530.32(N = 38/38)(1.37)(1.50)(1.18)(0.79)(2.18)(0.94)(1.03)(0.62)Band 71.440.330.560.892.560.630.530.22(N = 9/32)(1.33)(0.50)(0.53)(1.05)(1.90)(0.97)(0.80)(0.42)Band 8- - - - 4.000.140.290.00(N = 0/7)(3.11)(0.38)(0.49)(0.00)© IELTS Research Reports Volume 7 67
<strong>Documenting</strong> <strong>features</strong> <strong>of</strong> <strong>written</strong> <strong>language</strong> <strong>production</strong> <strong>typical</strong> at IELTS band levels – Banerjee, Franceschina + SmithAPPENDIX 2: 50 MOST FREQUENT WORDSThe 50 most frequent words in the L1 Chinese scriptsN Word Freq. % N Word Freq. %1 THE 5,093 6.83 26 ON 368 0.492 AND 2,248 3.01 27 I 361 0.483 IN 2,192 2.94 28 THIS 360 0.484 OF 1,920 2.57 29 SOME 345 0.465 TO 1,866 2.50 30 THAN 342 0.466 IS 1,435 1.92 31 MEN 340 0.467 A 952 1.28 32 BUT 338 0.458 THAT 789 1.06 33 WILL 334 0.459 CAN 751 1.01 34 COUNTRIES 310 0.4210 IT 745 1.00 35 WHICH 310 0.4211 ARE 735 0.99 36 DO 293 0.3912 MORE 680 0.91 37 THERE 293 0.3913 WOMEN 673 0.90 38 SO 285 0.3814 FOR 656 0.88 39 ABOUT 271 0.3615 PEOPLE 595 0.80 40 RATE 263 0.3516 THEY 546 0.73 41 HAS 257 0.3417 FROM 538 0.72 42 SHOULD 257 0.3418 AS 501 0.67 43 POPULATION 255 0.3419 WE 492 0.66 44 BY 252 0.3420 HAVE 446 0.60 45 ALL 235 0.3221 BE 445 0.60 46 MILLION 233 0.3122 WITH 391 0.52 47 LITERACY 231 0.3123 THEIR 378 0.51 48 OR 229 0.3124 NOT 370 0.50 49 ONLY 226 0.3025 S 369 0.49 50 FEMALE 225 0.30© IELTS Research Reports Volume 7 68
<strong>Documenting</strong> <strong>features</strong> <strong>of</strong> <strong>written</strong> <strong>language</strong> <strong>production</strong> <strong>typical</strong> at IELTS band levels – Banerjee, Franceschina + SmithThe 50 most frequent words in the L1 Spanish scriptsN Word Freq. % N Word Freq. %1 THE 4,092 6.79 26 MORE 304 0.502 IN 2,098 3.48 27 BUT 297 0.493 OF 2,005 3.33 28 LANGUAGE 297 0.494 AND 1,847 3.06 29 NOT 295 0.495 TO 1,636 2.71 30 HAS 285 0.476 A 1,325 2.20 31 THEIR 285 0.477 IS 1,122 1.86 32 WORLD 283 0.478 THAT 939 1.56 33 I 273 0.459 ARE 573 0.95 34 OR 271 0.4510 FOR 560 0.93 35 OTHER 251 0.4211 HAVE 556 0.92 36 ON 230 0.3812 IT 553 0.92 37 ALL 229 0.3813 THIS 544 0.90 38 BY 217 0.3614 AS 536 0.89 39 MOBILE 207 0.3415 WITH 534 0.89 40 COUNTRY 205 0.3416 COUNTRIES 517 0.86 41 THERE 199 0.3317 PEOPLE 507 0.84 42 BECAUSE 196 0.3318 WE 428 0.71 43 WORKFORCE 196 0.3319 BE 427 0.71 44 AN 195 0.3220 WOMEN 364 0.60 45 THAN 194 0.3221 ENGLISH 333 0.55 46 LANDLINE 185 0.3122 THEY 333 0.55 47 IMPORTANT 178 0.3023 EDUCATION 330 0.55 48 ONLY 177 0.2924 PHONES 324 0.54 49 ONE 176 0.2925 CAN 310 0.51 50 FROM 170 0.28© IELTS Research Reports Volume 7 69