USDA Yield Grade - University of Minnesota Extension Service
USDA Yield Grade - University of Minnesota Extension Service
USDA Yield Grade - University of Minnesota Extension Service

Create successful ePaper yourself
Turn your PDF publications into a flip-book with our unique Google optimized e-Paper software.
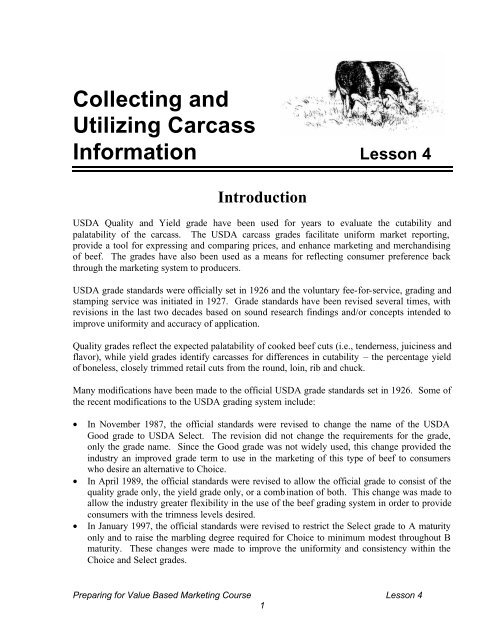
Collecting andUtilizing CarcassInformation Lesson 4Introduction<strong>USDA</strong> Quality and <strong>Yield</strong> grade have been used for years to evaluate the cutability andpalatability <strong>of</strong> the carcass. The <strong>USDA</strong> carcass grades facilitate uniform market reporting,provide a tool for expressing and comparing prices, and enhance marketing and merchandising<strong>of</strong> beef. The grades have also been used as a means for reflecting consumer preference backthrough the marketing system to producers.<strong>USDA</strong> grade standards were <strong>of</strong>ficially set in 1926 and the voluntary fee-for-service, grading andstamping service was initiated in 1927. <strong>Grade</strong> standards have been revised several times, withrevisions in the last two decades based on sound research findings and/or concepts intended toimprove uniformity and accuracy <strong>of</strong> application.Quality grades reflect the expected palatability <strong>of</strong> cooked beef cuts (i.e., tenderness, juiciness andflavor), while yield grades identify carcasses for differences in cutability – the percentage yield<strong>of</strong> boneless, closely trimmed retail cuts from the round, loin, rib and chuck.Many modifications have been made to the <strong>of</strong>ficial <strong>USDA</strong> grade standards set in 1926. Some <strong>of</strong>the recent modifications to the <strong>USDA</strong> grading system include:• In November 1987, the <strong>of</strong>ficial standards were revised to change the name <strong>of</strong> the <strong>USDA</strong>Good grade to <strong>USDA</strong> Select. The revision did not change the requirements for the grade,only the grade name. Since the Good grade was not widely used, this change provided theindustry an improved grade term to use in the marketing <strong>of</strong> this type <strong>of</strong> beef to consumerswho desire an alternative to Choice.• In April 1989, the <strong>of</strong>ficial standards were revised to allow the <strong>of</strong>ficial grade to consist <strong>of</strong> thequality grade only, the yield grade only, or a combination <strong>of</strong> both. This change was made toallow the industry greater flexibility in the use <strong>of</strong> the beef grading system in order to provideconsumers with the trimness levels desired.• In January 1997, the <strong>of</strong>ficial standards were revised to restrict the Select grade to A maturityonly and to raise the marbling degree required for Choice to minimum modest throughout Bmaturity. These changes were made to improve the uniformity and consistency within theChoice and Select grades.Preparing for Value Based Marketing Course Lesson 41
<strong>USDA</strong> grading is a voluntary service and should not be confused with meat inspection, amandatory service that determines the wholesomeness <strong>of</strong> meat for human consumption andincludes responsibilities for sanitation and product labeling.<strong>USDA</strong> <strong>Yield</strong> <strong>Grade</strong><strong>USDA</strong> <strong>Yield</strong> grades is a numerical value from 1 to 5 based upon the yield <strong>of</strong> boneless, closelytrimmed (approximately 0.30 inches), retail cuts (BCTRC) from the round, loin, rib and chuck.These four wholesale cuts make up approximately 75% <strong>of</strong> the weight, but about 90% <strong>of</strong> thecarcass value.In the <strong>of</strong>ficial U.S.D.A. grading standards, yield grades range from 1.0 to 5.9, but only the wholenumber yield grade is “rolled” on the carcass by the grader. Thus, carcasses with yield grades <strong>of</strong>3.0 to 3.9 are rolled yield grade 3; those with yield grades <strong>of</strong> 4.0 to 4.9 are rolled yield grade 4,etc. <strong>Yield</strong> grades are not rounded to the next higher whole number for example a yield grade <strong>of</strong>3.9 is a yield grade 3 carcass not a yield grade 4 carcass.Since it would not be practical to dissect all beef carcass to determine the yield <strong>of</strong> BCTRC the<strong>USDA</strong> identified 4 factors (measurement) that are used to estimate the yield <strong>of</strong> BCTRC (yieldgrade). The 4 factors include• Fat thickness at the 12 th rib• Ribeye area (square inches)• Hot carcass weight• Percentage kidney, pelvic and heart fat (KPH)Using these factors, regression equations were developed that can be used to predict the yieldgrade itself or the percent <strong>of</strong> BCTRC.<strong>Yield</strong> <strong>Grade</strong> = 2.5+ 2.5 (adjusted fat thickness, inches)+ 0.2 (kidney, pelvic and heart fat percent)+ 0.0038 (hot carcass weight, pounds)-0.32 (ribeye area, square inches)An example <strong>of</strong> this formula is illustrated in the following example.Assume:adjusted fat thickness = 0.4 incheskidney, pelvic and heart fat = 3 percent <strong>of</strong> carcasshot carcass weight = 625 poundsribeye area = 12.8 square inches<strong>Yield</strong> <strong>Grade</strong> = 2.5 + 2.5(0.4) + 0.2(3) + 0.0038(625) – 0.32(12.8)= 2.38 (based on this example this is a <strong>USDA</strong> <strong>Yield</strong> <strong>Grade</strong> 2 carcass)In actual everyday grading <strong>of</strong> beef carcasses, the regression equation is not used, but a workingformula has been developed to simplify the procedure. <strong>USDA</strong> graders need to evaluate carcassesfor both yield and quality grade at chain speed or as fast as 300 to 400 head per hour.Preparing for Value Based Marketing Course Lesson 42
An additional regression equations can be used to calculate the percentage <strong>of</strong> boneless, closelytrimmed retail cuts.Percentage BCTRC = 51.34 - 5.78 (adjusted fat thickness, inches)- 0.462 (kidney, pelvic and heart fat, percentage)- 0.0093 (hot carcass weight, pounds)+ 0.74 (ribeye area, square inches)An example <strong>of</strong> this formula is illustrated using the same assumed carcass measurement listedearlier. Additionally, Table 1 can be used as a quick guide to compare <strong>USDA</strong> <strong>Yield</strong> <strong>Grade</strong> withthe Percentage <strong>of</strong> BCTRC from the round, loin, rib and chuck.Percentage BCTRC = 51.34 – 5.78(0.4) – 0.462(3) – 0.0093(625) +0.74(12.8)= 51.3 percentTable 1 Interconversion <strong>of</strong> <strong>Yield</strong> <strong>Grade</strong> and Percentage Boneless, CloselyTrimmed Retail CutsPercentage <strong>of</strong> BCTRC from<strong>USDA</strong> <strong>Yield</strong> <strong>Grade</strong> the Round, Loin, Rib andChuck1 52.6-54.62 50.3-52.33 48.0-50.04 45.7-47.75 43.5-45.4Preliminary yield grades are based on fat thickness measured between the 12 th and 13 th ribbecause the fat thickness is the major factor used to calculate the yield grade. The relationshipbetween 12 th rib fat thickness and the preliminary yield grade is listed.12 th rib fat thickness Preliminary <strong>Yield</strong> <strong>Grade</strong>0.0 2.00.2 2.50.4 3.00.6 3.50.8 4.01.0 4.51.2 5.0Two very important considerations for beef cattle producers can be made from the preliminaryyield grade conversion. First, no matter how trim the carcass is it can not move into the yieldgrade 1 category unless it also excels in muscling. Secondly, most retailers who display meat ina showcase trim their retail product to a quarter inch or less <strong>of</strong> external fat and at 0.6 or greater12 th rib fat thickness requires a lot <strong>of</strong> trimming at some point in the processing chain.Preparing for Value Based Marketing Course Lesson 43
The following illustrations indicate where and how 12 th rib fat thickness and ribeye area ismeasured.The 12 th rib fat thickness is measured perpendicular to theoutside fat at a point ¾ the length <strong>of</strong> the ribeye muscle. Thismeasurement may be adjusted by the grader to reflect unusual fatdistribution in the carcass. Special attention is given to fatdeposition in the cod or udder, rump, inside round, flank, lowerrib, plate and brisket areas. External fat is the most importantyield grade factor.The rib eye area is measured at the 12 th rib by using a grid expressed insquare inches. Evaluators count the number <strong>of</strong> dots on the grid that areover the ribeye muscle. Each dot is equal to 0.1 square inches. Ribeyearea is an indicator <strong>of</strong> carcass muscling.Percentage <strong>of</strong> kidney, pelvic and heart fat (KPH) is a subjectiveestimate <strong>of</strong> the amount <strong>of</strong> fat surrounding the kidney knob, and fat in the pelvic and thoracic(heart) areas as a percentage <strong>of</strong> the carcass weight. Percentage KPH fat normally ranges from1.0 to 4.0 percent.Hot Carcass weight is used along with ribeye area as an indicator or muscling. A larger carcassrequires a larger rib eye area to maintain the same yield grade assuming all other factors areequal (fat thickness and KPH fat).<strong>USDA</strong> Quality <strong>Grade</strong>The United States Department <strong>of</strong> Agriculture (<strong>USDA</strong>) Grading <strong>Service</strong> attempts to sort throughthe diversity in the cattle population and assign carcasses into grades <strong>of</strong> expected eating quality.These <strong>USDA</strong> quality grades are based primarily on evaluations <strong>of</strong> carcass maturity and theamount <strong>of</strong> intramuscular fat (marbling) present in the longissimus muscle between the 12 th and13 th rib. Both <strong>of</strong> these factors, maturity and marbling, have been shown by numerous researchersto significantly impact beef palatability. Increased maturity has been associated with decreasedpalatability.Beef carcass grade standards provide five maturity groups. These are referred to by letters – Athrough E – with A indicating the carcasses from the youngest animals. Carcasses from younganimals (A maturity) are characterized by s<strong>of</strong>t, porous chine bones that terminated in s<strong>of</strong>t,pearly-white cartilage. Rib bones are somewhat narrow and red. The sacral vertebrae showdistinct separation, and cartilage is present on the split aitch bone. Lean from such younganimals is fine in texture and light red in color. Carcasses from animals with evidences <strong>of</strong>advanced maturity or old (C, D and E maturity) have hard, white chine bones with outlines <strong>of</strong> thecartilage on the ends <strong>of</strong> the thoracic vertebrae. The rib bones are wide and flat, and the ribeyemuscle is dark red and coarse in texture.Degree <strong>of</strong> maturity, or physiological age as determined from bone and lean maturity, may not bethe same as the actual age <strong>of</strong> the animal in months or years. However, approximatechronological age groupings for maturity degrees are as follows.Preparing for Value Based Marketing Course Lesson 44
Maturity GroupABCDEAge9 to 30 months30 to 42 months (2.5 to 3.5 years)42 to 72 months (3.5 to 6 years)72 to 96 months (6 to 8 years)Over 96 months (over 8 years)Flecks <strong>of</strong> fat in the lean (marbling), is the other major consideration in quality grading. Marblingis evaluated visually in the ribeye muscle between the 12 th and 13 th ribs. Although it contributesonly slightly to meat tenderness, marbling probably contributes to the palatability traits <strong>of</strong>juiciness and flavor. There are ten degrees <strong>of</strong> marbling (Very Abundant, Abundant, ModeratelyAbundant, Slightly Abundant, Moderate, Modest, Small, Slight, Traces and Practically Devoid).Internet users can find colored pictures <strong>of</strong> marbling scores Slight through Slightly Abundant atthe following web site www.abs.sdstate.edu/ars/animaleval/Beef/beefgrade.htm.The quality grading chartshows that carcasses <strong>of</strong> A andB maturity are eligible for thePrime, Choice, Select, andStandard quality grades.Carcasses with olderphysiological characteristics(C, D and E maturity) qualifyonly for the Commercial,Utility, Cutter and Cannergrades.Quality grades are determinedby combining maturity andmarbling characteristics. Forexample, A maturity carcasses (typical <strong>of</strong> most feedlot cattle) require at least a Small degree <strong>of</strong>marbling to make the Choice grade, whereas a Slightly Abundant amount <strong>of</strong> marbling is requiredfor Prime. Carcasses <strong>of</strong> B maturity require a Modest degree <strong>of</strong> marbling to grade Choice. Also,B maturity carcasses cannot grade Select, but will grade Standard with a small degree <strong>of</strong>marbling or less.Quality grading is voluntary, not all carcasses are quality graded. Packers may apply their own“house brand” to merchandise their beef. Carcasses merchandised as ungraded beef usually arethose that do not grade Choice or Prime. They generally are termed “No Roll” beef by theindustry, because a grade stamp has not been rolled on the carcassDark-Cutting BeefDark-cutters sometimes result if cattle are severely stress 12 to 24 hours prior to slaughter. Suchstress results in a reduced glycogen (starch) content <strong>of</strong> the lean, a failure <strong>of</strong> the muscle color tobrighten (bloom) upon exposure to air and a sticky (gummy texture) condition <strong>of</strong> the lean.Varying degrees <strong>of</strong> dark-cutting beef from slightly shady to black-cutters can be identified.Preparing for Value Based Marketing Course Lesson 45
There is little or no evidence, which indicates that the dark-cutting condition has any adverseeffect on palatability, although the condition does favor microbial growth due to the elevated pH.Dark-cutters are severely discounted by the packing industry, due to poor consumer appeal andshort shelf life, therefore it is important to minimize stress and rough handling prior to slaughter.Using Ultrasound DataReal-time ultrasound enables you to get a fast and objective prediction on the carcasscomposition <strong>of</strong> your beef cattle. This tool can help you to meet specific market demands andproduction systems. In addition, carcass composition information could assist you in the geneticselection and breeding <strong>of</strong> your cow herd.The disadvantage <strong>of</strong> ultrasound includes the equipment required to accurately make themeasurements and the need for a trained, licensed technician to make the evaluation. Some <strong>of</strong>the advantages <strong>of</strong> ultrasound data collection over traditional carcass data collection include:1. More complete information for the cattle being measured because they must havea recorded weaning weight.2. Offers a way to evaluate yearling bulls and developing heifers in a nondestructiveway (without slaughtering them).3. Contemporary groups are more complete and accurate.Real-time ultrasound uses high frequency sound waves. A sound-emitting probe held snugly onthe animal’s back bounces sound waves <strong>of</strong>f tissues <strong>of</strong> different densities, such as fat and muscle.An image is created by the reflected sound and appears on the video screen instantly.The use <strong>of</strong> real-time ultrasound to measure fat thickness and ribeye area in live beef cattle hasbecome widely accepted. Ribeye area and fat thickness are two traits that are highly related toretail product <strong>of</strong> the beef carcass and these two traits can be measured with a high degree <strong>of</strong>accuracy using ultrasound. Additionally, fat thickness and ribeye area are moderately to highlyheritable, suggesting that differences found between animals would be expected to be passed onto their <strong>of</strong>fspring.Real-time ultrasound can also be used to objectively measure marbling in live beef cattle.Marbling, however, is a very subjective score. Therefore, real-time ultrasound is used to predictthe actual percent fat in the ribeye muscle.Marbling is measured or evaluated as the percent intramuscular fat. <strong>USDA</strong> beef Quality gradesare based on the visual amount <strong>of</strong> intramuscular fat as determined by the <strong>USDA</strong> grader. Realtimeultrasound has the capability <strong>of</strong> measuring the actual percent <strong>of</strong> intramuscular fat in theribeye muscle between the 12 th and 13 th rib. The relationship between percent intramuscular fat(% IMF), <strong>USDA</strong> Quality <strong>Grade</strong>, <strong>USDA</strong> Marbling Degrees and Marbling Scores are listed inTable 2.Preparing for Value Based Marketing Course Lesson 46
Table 2.Percent Intramuscular Fat Relationship to <strong>USDA</strong> Quality <strong>Grade</strong>, Degrees <strong>of</strong>Marbling and Marbling Score% IMF Quality <strong>Grade</strong> Marbling Degree Marbling Score2.3 – 3.03.1 – 3.9Select –Select +Slight 0 – 40Slight 50 – 904.0 – 4.44.5 – 4.94.0 – 5.75.8 – 7.67.7 – 9.7Choice –Choice oChoice +Small 0 – 90Modest 0 – 90Moderate 0 – 905.0 – 5.96.0 – 6.97.0 – 7.99.9 – 12.112.3+Prime –Prime oSlightly Ab 0 – 90Moderately AB 0 – 908.0 – 8.99.0 – 10.0Rump fat measurements can also be taken using real-time ultrasound. Rump fat is negativelyrelated to percent retail product and is thought to be an additional indicator <strong>of</strong> carcass fat. Rumpfat measures may be most useful for predicting percent retail product in leaner cattle, which haveless 12 th rib fat.Currently some breed association are utilizing real-time ultrasound measurements to calculatecarcass EPD’s. Participating breed association require qualified technician to collect ultrasoundimages and submits them to the centralized ultrasound processing center for processing.Centralized processing requires standard protocols for image collection, consistency andaccuracy in interpretation, cross checks on problem images and unbiased reporting necessary forcarcass EPD calculations.Participating Breed Associations, Centralized Ultrasound Processing (CUP) Technicians andadditional information about ultrasound technology can be found at the Iowa State Beef CattleUltrasound web page listed. http://www.extension.iastate.edu/Pages/ansci/ultrasound/Additional Methods to Identify Palatability AttributesBeef Check-<strong>of</strong>f dollars have been spent to research and evaluate carcass tenderness to reduce anegative eating experience. Dr. J.O. Reagan, executive director <strong>of</strong> science and Technology forNCBA indicates that the big problem when evaluating tenderness is that most technology used toidentify tender carcasses misses a lot <strong>of</strong> carcasses that should be identified as tenderThe 1995 National Beef Quality Audit reported that 84 % <strong>of</strong> all carcasses from the fed steer andheifer population had marbling scores <strong>of</strong> “small” or “slight”. For young (less than 30 months <strong>of</strong>age – A maturity) fed steers and heifers with small marbling represent <strong>USDA</strong> low Choice beefand slight marbling would represent the <strong>USDA</strong> Select grade. There usually is considerable pricespreads between the <strong>USDA</strong> Choice and Select grades. A research report done in 1984 by Smithreported no significant differences between the average “small” and “slight” marbling scores forall palatability attributes examined. The beef industry is looking for other methods to helpdistinguish carcasses palatability attributes.Dr. Duane Wulf, Meat Science <strong>Extension</strong> and Research Specialist, South Dakota State<strong>University</strong> wrote an article on Technologies for Value Assessment <strong>of</strong> Beef which can be found atthe following web site: www.abs.sdstate.edu/ars/meatsci/may99-3.htm. Dr Wulf reviewed twoon-line methods <strong>of</strong> assessing the palatability <strong>of</strong> beef carcasses (Tenderness Classification SystemPreparing for Value Based Marketing Course Lesson 47
and Colorimeter System) that appear to be promising. Dr Wulf’s paper indicates that theTenderness Classification System is the most accurate system and will probably always be themost accurate system because it is a direct measure <strong>of</strong> tenderness, whereas <strong>USDA</strong> quality gradesand the Colorimeter Systems are indirect measures <strong>of</strong> tenderness and/or eating quality. TheTenderness Classification System uses one steak from each carcass and is also quite expensive tooperate in its present form. The <strong>USDA</strong> quality grades and the Colorimeter System are notevasive and are both relatively simple to operate. Therefore, one must weigh accuracy versusexpense when deciding which system to use. Table 3 shown below compares the accuracy <strong>of</strong> thethree methods discussed.Table 3. Accuracy <strong>of</strong> various methods at predicting eating quality within the young beef (fedsteers and heifers) population.Method (System)r 2 for prediction <strong>of</strong> eating quality<strong>USDA</strong> quality grades 0.05 to 0.15Tenderness Classification (Shackelford 1999) 0.46 to 0.61Colorimeter System (Wulf 1998) 0.36 to .042Heritability Estimates for Carcass CharacteristicHeritability is an estimate <strong>of</strong> the proportion<strong>of</strong> the total variation between individuals fora certain trait that is due to heredity asopposed to environmental factors.Heritability estimates range from 0.0 to 1.0.If a trait is highly heritable, rapid progresscan be made through selection for that trait.Selection for a trait that is low or close tozero in heritability will result in very littlechange. The heritability in Table 4, whichare expressed on an age- or time-on-feedconstantbasis, are moderate to high, rangingfrom 0.35 to 0.64. These values suggest thatselection on most carcass traits should beeffective.Table 4. Average heritabilityestimates for beef carcass traits (ageortime-on-feed constant basis*Trait HeritabilityCarcass weight 0.41Rib eye area 0.3712 th rib fat thickness 0.44Marbling score 0.35Retail product % 0.36Retail product weight 0.47Fat, trim % 0.57Fat trim weight 0.64Bone % 0.53Bone weight 0.57Warner-Bratzier 0.37shear force(tenderness)*Marshall Journal <strong>of</strong> AnimalScience, October 1994Preparing for Value Based Marketing Course Lesson 48
SummaryHarlan Ritchie, Department <strong>of</strong> Animal Science, Michigan State <strong>University</strong> does an excellent job<strong>of</strong> summarizing the importance <strong>of</strong> carcass characteristics.“There is some debate within the beef cattle industry on whether too muchemphasis is being placed on the end-product. This question is raised becausereproductive efficiency, early growth, and cost <strong>of</strong> production are still the factorsthat have the greatest impact on pr<strong>of</strong>itability in cow-calf herds. But as theindustry moves to true value-based marketing and more cattle are sold onindividual merit rather than on the average, traits related to the end-productwill likely increase in economic importance.”Today we are in the information age with computers, Internet, digital scales, digital camera’s,ultrasound machines, fax machines, e-mail, electronic identification and many more technologyadvances. Today more than ever, beef cattle producers need to utilize this technology to meetthe current consumer demands. Utilizing existing carcass evaluation methods along withincorporating new researched based methods <strong>of</strong> carcass evaluation will be key to successfullyproducing a more consistent high quality product.Additional References and ReadingsOfficial United States Standards for <strong>Grade</strong>s <strong>of</strong> Carcass Beef available from the United StatesDepartment <strong>of</strong> Agriculture, Agricultural Marketing <strong>Service</strong>, Livestock and Seed Division,Standardization Branch, Room 2603 South Bldg., P.O. Box 96456, Washington, D.C. 20090-6456, www.ams.usda.gov/lsg/ls-mg.htmMeat Evaluation Handbook available from the American Meat Science Association, 1111 NorthDunlap Avenue, Savoy, IL 61874, www.meatscience.orgQuality and <strong>Yield</strong> <strong>Grade</strong>s for Beef Carcasses can be found on the Internet atianrwww.unl.edu/pubs/beef/rp357.htmThe Meat We Eat (book) and Livestock and Carcasses (book) available from the South DakotaState <strong>University</strong> Bookstore www.sdstatebookstore.com/ or you can call (800) 985-8771.This lesson prepared by:Philip BergPipestone County <strong>Extension</strong> Educator119 2 nd Ave. SW, Suite # 2Pipestone, MN 56164Phone: (507) 825-6715Fax: (507) 825-6719E-mail: bergx034@umn.eduPreparing for Value Based Marketing Course Lesson 49
Notes:Preparing for Value Based Marketing Course Lesson 410
Lesson 4 –QuizCollecting and Utilizing Carcass Information1. True or False <strong>USDA</strong> grade standards were <strong>of</strong>ficially set in 1926.2. True or False <strong>USDA</strong> Quality grades determine the wholesomeness <strong>of</strong> meat for humanconsumption.3. <strong>Yield</strong> grade can be used to estimate the percentage yield <strong>of</strong> boneless closely trimmed retailcuts from what four regions (wholesale cuts) <strong>of</strong> the beef carcass?4. Calculate the yield grade and percent boneless closely trimmed retail cuts (BCTRC) for abeef carcass with the following carcass characteristics.Adjusted fat thickness = 0.6 inchesKidney, pelvic and heart fat = 2.5 percentHot carcass weight = 725 poundsRibeye area = 13.5 square inches<strong>Yield</strong> <strong>Grade</strong> =BCTRC % =5. True or False A beef carcass with little or no 12 th rib fat thickness and average muscleand kidney, pelvic and heart fat would represent a yield grade 1 carcass.6. List four <strong>USDA</strong> quality grades for young beef (A and B maturity).Preparing for Value Based Marketing Course Lesson 411
7. <strong>USDA</strong> quality grades are based primarily on what two carcass evaluations?8. List two reasons why dark-cutters are discounted by the packing industry.9. List a new method used to assess palatability <strong>of</strong> beef carcasses.10. Most carcass traits have ____________________________.a) Low heritabilityb) Low to average heritabilityc) Average to high heritabilityd) No heritabilityPlease list any questions you may have that weren’t answered in this lesson:******************************************************************************Name______________________________________________Phone______________________Address_______________________________________________________________________(Optional) Fax________________________E-mail____________________________________Preparing for Value Based Marketing Course Lesson 412