Paper Substrates and Inks for Printed Electronics - Western ...
Paper Substrates and Inks for Printed Electronics - Western ...
Paper Substrates and Inks for Printed Electronics - Western ...

You also want an ePaper? Increase the reach of your titles
YUMPU automatically turns print PDFs into web optimized ePapers that Google loves.
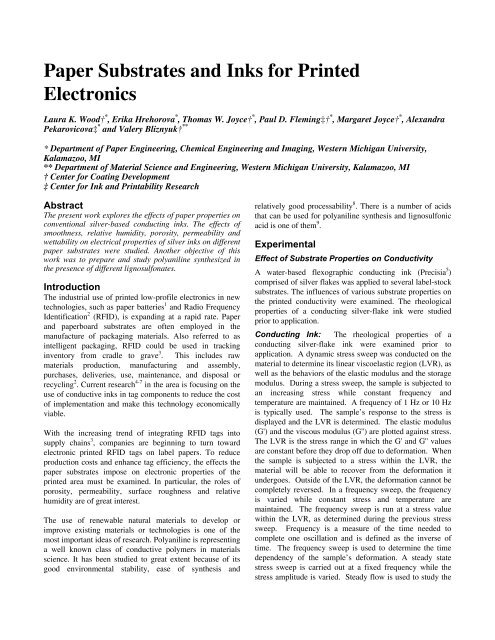
<strong>Paper</strong> <strong>Substrates</strong> <strong>and</strong> <strong>Inks</strong> <strong>for</strong> <strong>Printed</strong><strong>Electronics</strong>Laura K. Wood† * , Erika Hrehorova * , Thomas W. Joyce† * , Paul D. Fleming‡† * , Margaret Joyce† * , Alex<strong>and</strong>raPekarovicova‡ * <strong>and</strong> Valery Bliznyuk† *** Department of <strong>Paper</strong> Engineering, Chemical Engineering <strong>and</strong> Imaging, <strong>Western</strong> Michigan University,Kalamazoo, MI** Department of Material Science <strong>and</strong> Engineering, <strong>Western</strong> Michigan University, Kalamazoo, MI† Center <strong>for</strong> Coating Development‡ Center <strong>for</strong> Ink <strong>and</strong> Printability ResearchAbstractThe present work explores the effects of paper properties onconventional silver-based conducting inks. The effects ofsmoothness, relative humidity, porosity, permeability <strong>and</strong>wettability on electrical properties of silver inks on differentpaper substrates were studied. Another objective of thiswork was to prepare <strong>and</strong> study polyaniline synthesized inthe presence of different lignosulfonates.IntroductionThe industrial use of printed low-profile electronics in newtechnologies, such as paper batteries 1 <strong>and</strong> Radio FrequencyIdentification 2 (RFID), is exp<strong>and</strong>ing at a rapid rate. <strong>Paper</strong><strong>and</strong> paperboard substrates are often employed in themanufacture of packaging materials. Also referred to asintelligent packaging, RFID could be used in trackinginventory from cradle to grave 3 . This includes rawmaterials production, manufacturing <strong>and</strong> assembly,purchases, deliveries, use, maintenance, <strong>and</strong> disposal orrecycling 2 . Current research 4-7 in the area is focusing on theuse of conductive inks in tag components to reduce the costof implementation <strong>and</strong> make this technology economicallyviable.With the increasing trend of integrating RFID tags intosupply chains 3 , companies are beginning to turn towardelectronic printed RFID tags on label papers. To reduceproduction costs <strong>and</strong> enhance tag efficiency, the effects thepaper substrates impose on electronic properties of theprinted area must be examined. In particular, the roles ofporosity, permeability, surface roughness <strong>and</strong> relativehumidity are of great interest.The use of renewable natural materials to develop orimprove existing materials or technologies is one of themost important ideas of research. Polyaniline is representinga well known class of conductive polymers in materialsscience. It has been studied to great extent because of itsgood environmental stability, ease of synthesis <strong>and</strong>relatively good processability 8 . There is a number of acidsthat can be used <strong>for</strong> polyaniline synthesis <strong>and</strong> lignosulfonicacid is one of them 9 .ExperimentalEffect of Substrate Properties on ConductivityA water-based flexographic conducting ink (Precisia 5 )comprised of silver flakes was applied to several label-stocksubstrates. The influences of various substrate properties onthe printed conductivity were examined. The rheologicalproperties of a conducting silver-flake ink were studiedprior to application.Conducting Ink: The rheological properties of aconducting silver-flake ink were examined prior toapplication. A dynamic stress sweep was conducted on thematerial to determine its linear viscoelastic region (LVR), aswell as the behaviors of the elastic modulus <strong>and</strong> the storagemodulus. During a stress sweep, the sample is subjected toan increasing stress while constant frequency <strong>and</strong>temperature are maintained. A frequency of 1 Hz or 10 Hzis typically used. The sample’s response to the stress isdisplayed <strong>and</strong> the LVR is determined. The elastic modulus(G') <strong>and</strong> the viscous modulus (G'') are plotted against stress.The LVR is the stress range in which the G' <strong>and</strong> G'' valuesare constant be<strong>for</strong>e they drop off due to de<strong>for</strong>mation. Whenthe sample is subjected to a stress within the LVR, thematerial will be able to recover from the de<strong>for</strong>mation itundergoes. Outside of the LVR, the de<strong>for</strong>mation cannot becompletely reversed. In a frequency sweep, the frequencyis varied while constant stress <strong>and</strong> temperature aremaintained. The frequency sweep is run at a stress valuewithin the LVR, as determined during the previous stresssweep. Frequency is a measure of the time needed tocomplete one oscillation <strong>and</strong> is defined as the inverse oftime. The frequency sweep is used to determine the timedependency of the sample’s de<strong>for</strong>mation. A steady statestress sweep is carried out at a fixed frequency while thestress amplitude is varied. Steady flow is used to study the
viscosity change under increasing shear stress. It also givesthe idea of how viscous or elastic the material is under shearstress.Upon viewing the sample’s apparent viscosity, the couettegeometry was chosen. The couette is appropriate <strong>for</strong> lowviscosity samples <strong>and</strong> is capable of a high shear rate. Afterinstalling the geometry <strong>and</strong> loading the sample, aconditioning step was per<strong>for</strong>med to pre-shear the substance.The dynamic stress sweep was executed in a range from0.001809 Pa to 100 Pa at a frequency of 1Hz <strong>and</strong> 25°C. Thefrequency sweep was per<strong>for</strong>med on the sample at thepredetermined stress of 0.1 Pa. The sweep ranged from 1Hz to 100 Hz.<strong>Substrates</strong>: Five substrate samples were provided byStora Enso <strong>for</strong> analysis in conjunction with conductingsilver-flake ink. These substrates are listed below in Table 1along with their intended applications.Table 1: <strong>Substrates</strong>GradeLabelSet SPOptiThermPointFlexUniThermUniTherm SharpDescriptionWet strength labels <strong>for</strong> beverage bottlesDirect thermal tickets <strong>and</strong> tagsFlexible packagingPressure-sensitive thermal transferapplications with conventional pre-printapplicationsPressure-sensitive thermal transferapplications with dem<strong>and</strong>ing conventionalpre-print requirementsEach substrate was characterized in terms of its roughness,porosity (Parker Print Surf Tester, Mercury Porosimetry),<strong>and</strong> wettability (contact angle - First Ten AngstromsDynamical Contact Angle Tensiometer). In addition, thepermeability of each substrate was calculated from itsParker Print porosity value <strong>and</strong> its thickness using the10, 11following equation:K = 0.048838 * Q * X (1)Where K is the permeability in µm 2 , Q is the flow rate inml/min <strong>and</strong> X is the thickness in m.Ink/Substrate InteractionsConductivity: The silver-flake ink was drawn down onthe substrate using a Flexographic “h<strong>and</strong>-proofer” 12 <strong>and</strong> theconductivity of each sample was then determined using aKeithley multimeter model 2400. Two flat alligator clipswere placed 20 mm apart on the inked area <strong>and</strong> a voltagerange of -0.1V to 0.1V was passed between the probes.Conductivity was calculated from the I-V curves using thefollowing equation:L Iσ (2)V AWhere L is the length of the gap, I is electric current, V isapplied potential difference <strong>and</strong> A is the cross-sectional areaof the sample calculated as thickness × width of the sample.Porosity: Each substrate was analyzed in the AutoPore IVMercury Porosimeter. Porosimetry is the measurement ofthe porosity-related characteristics of a material. Thesecharacteristics include pore size, volume, distribution <strong>and</strong>density. The mercury porosimeter characterizes theporosity of a material by applying varying levels of pressureto a sample immersed in mercury. The pressure required tointrude mercury into the sample’s pores is inverselyproportional to the size of the pores. The pressure versusintrusion data is collected by the instrument, <strong>and</strong> volume<strong>and</strong> size distributions are generated using the Washburnequation 13 .Table 2: Mercury Porosimeter ParametersOperational ParametersPenetrometer: #s/n – (13) 3 Bulb, 0.412 Stem, SolidHg ParametersAdv. Contact Angle: 130 Rec. Contact Angle:degreesHg Surface Tension:485dynes/cmLow PressureEvacuation PressureEvacuation TimeMercury Filling PressureEquilibrium TimeMaximum Intrusion Vol.High PressureEquilibrium TimeMaximum Intrusion Vol.130 degreesHg Density: 13.5335g/mL50 µmHg5 mins0.48 psia0 secs100.000 mL/g0 secs100.000 mL/gWettability: The contact angle of the silver-flake ink witheach substrate was determined using the First TenAngstroms Dynamical Contact Angle Tensiometer. Thetensiometer works by dispensing a single drop of a chosenliquid from a syringe onto a strip of the sample substrate.The camera takes a picture of this sessile drop <strong>and</strong> theimage is analyzed by computer software. A low contactangle indicates high wettability <strong>and</strong> vice versa.Roughnesss: UniTherm Sharp was calendered to fourroughness levels <strong>and</strong> h<strong>and</strong>-proofed with silver flake ink.UniTherm Sharp was chosen <strong>for</strong> this procedure because ithad the highest initial roughness value of the five substrates.Conductivity measurements were taken to determine theeffect of roughness on the final printed product. ParkerPrint-Surf Roughness values were determined at a clampingpressure of 1000 kPa with a soft backing.
Relative Humidity: OptiTherm samples h<strong>and</strong>-proofedwith silver-flake ink were conditioned at various relativehumidity <strong>and</strong> temperatures. Relative humidity is defined asthe ratio p w /p ws where p w <strong>and</strong> p ws are the vapor pressure <strong>and</strong>saturated vapor pressure at the appropriate temperature. 14The conductivity of each sample was determined to explorethe effect of relative humidity on a final printed product. ACARON 6030 Environmental Test Chamber was used tocondition the samples to the desired temperature <strong>and</strong>humidity levels. The operating parameters of the humiditychamber are displayed in Table 3. In several measurements,the sample was removed from the chamber <strong>and</strong> exposed toambient conditions after the conductivity was determined atthe desired humidity level. Three subsequent measurementswere taken (Open 1, Open 2, <strong>and</strong> Open 3) to observe theeffect the sudden change in relative humidity had onconductivity of the printed sample.Table 3: Humidity Chamber ParametersCARON Model 6030 SpecificationsTemperature Range without 5°C to 60°ClightsTemperature Range with 10°C to 60°ClightsHeater1160 Watts @ 115VACCompressor1/4hp, 2940 BTU/Hr@7°CEvaporatorTemperature Control ± 0.1°CTemperature Uni<strong>for</strong>mity ± 0.3°CRelative Humidity20 to 98% RHHumidity Control ± 2%Electrical115V/25A/60Hz 1Ph.Polyaniline Synthesis <strong>and</strong> its Properties:Aniline was oxidatively polymerized with ammoniumpersulfate (APS) in the presence of lignosulfonic acidprepared from different lignosulfonates (Table 4). Theweight ratio of lignosulfonic acid <strong>and</strong> monomer was 1:1 <strong>and</strong>1:4. The polymerization was carried out at 3-5 °C <strong>and</strong> thereagents were stirred <strong>for</strong> 3 hours. The resulting product waswashed <strong>and</strong> centrifuged from acetone followed with water<strong>and</strong> dried under vacuum overnight at 60 °C. Identificationof prepared polyaniline samples is presented in the Table 5.All the samples were characterized by means of FTIRSpectroscopy, Differential Scanning Calorimetry <strong>and</strong> TotalSulfur Content Analysis. Conductivity of polyaniline films(casted on the glass substrate) <strong>and</strong> pressed pellets wascalculated from I-V characteristics measured using aKeithley multimeter model 2400 operated from a PC withLabview software. More detailed procedures can be foundin the reference 4 .Table 4: Composition of lignosulfonates (LS) used<strong>for</strong> polyaniline polymerizationName Composition ContentTotalSulfur[%]WeightAverageMolec.Wt.REAX88BEDF 350PolyfonOLignosulfonicacid, sodium salt,sulfomethylatedLignosulfonicacid, sodium salt,sulfomethylatedSulfuric acid,disodium saltLignosulfonicacid, sodium salt100% 10.5 290060-70%30-40%13.7 5700100% 6.8 2400Table 5: Identification of prepared polyanilinesamplesSampleWeight Ratio ofStarting LSIDLS : Aniline1.1 Reax 88B 1:11.2 Reax 88B 1:42.1 EDF 350 1:12.2 EDF 350 1:43.1 Polyfon O 1:13.2 Polyfon O 1:4Results <strong>and</strong> Discussion:Effect of Substrate Properties on ConductivityConducting Ink Rheology: The dynamic stress sweepis pictured below in Figure 1. Within the LVR, the G'(storage modulus) values were greater than the G'' (lossmodulus) values, indicating that the sample per<strong>for</strong>med moreelastic than viscous. A stress of 0.1 Pa was chosen <strong>for</strong> thefrequency sweep. A crossover point, in which the paths ofG’ <strong>and</strong> G” crossed, was observed around the stress value of1 Pa. This crossover point corresponds to the point insteady flow in which the viscosity dropped. After the initialdrop of G' <strong>and</strong> G'' outside of the LVR, a second plateau canbe seen be<strong>for</strong>e G' <strong>and</strong> G'' decrease further. The first dropmay be attributed to the de<strong>for</strong>mation of the structure createdby the silver flakes. Likely, the second plateau is due to thestructure of the remaining smaller particles present in thewater-based ink. The second drop would be due to thedestruction of the order of these particles.A frequency sweep (Figure 2) was per<strong>for</strong>med on the sampleat the predetermined stress of 0.1 Pa. Here, the slope of theG’ curve indicates the material’s strength. A large slopereveals low strength, <strong>and</strong> a small slope indicates highstrength. In this case, the G' curve remains fairly level untilthe frequency of 20 Hz is reached. At that point, G' dropsoff sharply. This result indicates that the ink maintains itsstrength until a frequency of 20 Hz, then the samplede<strong>for</strong>ms quickly.
The steady state flow test (Figure 3) was conducted todetermine the critical stress of the ink. As in the dynamicstress sweep, a second plateau of stability can be seen in thesteady state flow. The critical stress of the ink occurs atapproximately 1 Pa.Figure 3: Steady State Flow <strong>for</strong> Silver-Flake InkFigure 1: Dynamic Stress Sweep <strong>for</strong> Silver-Flake InkInk on <strong>Paper</strong>: Silver ink was h<strong>and</strong>-proofed onto fivedifferent paper substrates. Though each substrate was h<strong>and</strong>proofedwith ink in an identical manner, the thickness of theink layer varied from substrate to substrate. The variationsmay be attributed to differences in ink holdout capabilitiesamong the substrates, as well as a slight difference inmanual <strong>for</strong>ce applied during application. These thicknesseswere measured using a caliper <strong>and</strong> taken into considerationduring the conductivity measurements. The LabelSet gradepossessed the thinnest ink layer <strong>and</strong> the highest overallconductivity (Table 6).Table 6: Conductivity of Silver-Flake Ink on Tested<strong>Substrates</strong>SubstrateLength Width Thickness Conductivity[cm] [cm] [cm] [S.cm -1 ]LabelSet 2 1.244 0.0003 2684OptiTherm 2 1.239 0.0013 795PointFlex 2 1.243 0.0005 2169UniTherm 2 1.303 0.0009 1448UniThermSharp2 1.284 0.0010 1177Roughness: UniTherm Sharp was calendered to fourroughness levels <strong>and</strong> h<strong>and</strong>-proofed with silver flake ink.Parker Print-Surf Roughness 15 values were determined at aclamping pressure of 1000 kPa with a soft backing.Figure 2: Frequency Sweep <strong>for</strong> Silver-Flake InkThe results <strong>for</strong> different roughness values (Table 7) indicatethat calendering has an overall detrimental effect onconductivity. Though the thickness of the ink layer showedno relevant difference, the conductivity of the printed areagenerally decreases with a decrease in surface roughness.
Table 7: Effect of Surface Roughness onConductivityCalenderingConditionsRoughness[microns]Thickness[cm]Conductivity[S.cm -1 ]None 1.58 0.001 117710# 1 Pass 1Side1.31 0.001 94540# 1 PassEach Side10 # 2 Pass 1Side50# 3 PassEach Side1.25 0.001 7861.24 0.001 8121.15 0.001 852Substrate Permeability <strong>and</strong> Porosity: TheOptiTherm tag exhibited the highest permeability of the fivesubstrates (Table 8). According to the mercury porosimeterresults (Table 9), the PointFlex substrate has the highestpercent porosity at 23.8%, closely followed by UniThermSharp at 23.1%. OptiTherm Tag displayed the lowestpercentage at 18.6% porosity. The porosity <strong>and</strong>permeability data <strong>for</strong> the substrates are compared to theirfinal conductivity in Table 8 <strong>for</strong> easier comparison. Thehigh permeability, low porosity sample exhibited a lowconductivity; whereas the low permeability, high porositysubstrate exhibited a high conductivity.Table 8: Parker-Print Porosity <strong>and</strong> Permeability of<strong>Substrates</strong>PermeabilitySample PPS Porosity[mL/min]Permeability[µm^2]LabelSet 1.65 5.74E-6OptiTherm 5.74 5.13E-5PointFlex 2.11 5.76E-6UniTherm 2.23 8.03E-6UniTherm Sharp 8.12 3.02E-5Table 9: Mercury Porosimeter Data <strong>for</strong> <strong>Substrates</strong>IntrusionVol.TotalPoreAvg.PorePorosity[%][mL/g] Area[m 2 /g]Diameter[A]LabelSet 0.2273 0.184 49324 22.9OptiTherm 0.2163 0.099 87662 18.6PointFlex 0.2487 0.092 108210 23.8UniTherm 0.2410 0.039 244925 21.8UniThermSharp0.2552 0.046 221776 23.1Table 10: Relationship between SubstratePermeability, Porosity <strong>and</strong> ConductivityPermeability [µm^2]Porosity[%]Conductivity[S.cm -1 ]LabelSet 5.74E-6 22.9 2684OptiTherm 5.13E-5 18.6 795PointFlex 5.76E-6 23.8 2169UniTherm 8.03E-6 21.8 1448UniTherm 3.02E-5 23.1Sharp1177Wettability: The contact angles of the silver ink with thesubstrates ranged from approximately 40 degrees(PointFlex) to 52 degrees (LabelSet). The high contactangle on the LabelSet sample correlates with its lowpermeability. However, the PointFlex sample exhibited alow contact angle despite its low permeability.Table 11: Contact Angles of Conducting Ink with<strong>Substrates</strong>SubstrateContact Angle [deg]LabelSet SP 52.0OptiTherm 46.5PointFlex 39.9UniTherm 45.4UniTherm Sharp 48.0Relative Humidity: An increase in the relative humidityof the sample’s atmosphere at a given temperature resultedin a decrease in the conductivity of the printed area (Table12). However, once removed from the humidity chamber<strong>and</strong> exposed to ambient conditions, the printed substratetypically regained its original conductivity. Exceptions tothis trend are seen at the high relative humidity conditions,where complete recoveries from the humid conditions werenot accomplished. This is likely due to the physical warpingthat the samples experienced at high humidity levels.Table 12: Effect of Relative Humidity onConductivityConditions Conductivity [S.cm -1 ]Temp[°C]RelativeHumidity[%]Avg.Open1Open2Open323 35 1081 n/a n/a 132323 50 1073 1035 1027 102823 80 761 n/a 1095 108723 90 767 806 814 82030 35 1286 1340 1328 133230 50 1051 1373 1373 137330 80 918 704 714 70435 80 1399 1299 1282 1299
As seen in Table 13, an increase in temperature caused anincrease in conductivity at the same relative humidity. Astemperature increases, more moisture is present in the sheetat any given relative humidity. The relationship betweentemperature <strong>and</strong> relative humidity can be seen in Figure 4 12 .It is unknown why increased temperature results inincreased conductivity, since more moisture would bepresent in the sheet. Additional research is required in thisarea.Table 14: Effect of Repeated Humidity Change onConductivityRunNumberTemperature[°C]RelativeHumidityConductivity[S.cm -1 ][%]1 29 50 14842 29 85 14693 29 50 13704 29 85 15095 29 50 1423Figure 4: Relationship between Relative Humidity <strong>and</strong>Water Content of Humid AirTable 13: Effect of Temperature on ConductivityTemperature[°C]RelativeHumidity [%]Conductivity[S.cm -1 ]23 35 108130 35 128623 50 107330 50 105123 80 76130 80 91835 80 1399The effect of repeated increases <strong>and</strong> decreases in relativehumidity at a constant temperature on conductivity was alsoinvestigated (Table 14). The initial increase in relativehumidity caused a decrease in conductivity, as expected.The subsequent decrease in relative humidity caused theconductivity to drop further still. However, the secondhumidity increase resulted in a sudden increase inconductivity. The final humidity decrease again decreasedthe conductivity value. The reason <strong>for</strong> the spike inconductivity following the second humidity increase isunknown <strong>and</strong> should be further explored.Polyaniline Properties:The infrared spectroscopy showed that FTIR spectra ofpolyaniline samples <strong>and</strong> their starting lignosulfonatesshowed overlay of FTIR peaks showing the presence of thetemplate in the polymer, however in different extent. Figure5 shows the changes in Tg’s of samples as calculated fromDSC thermograms. It is evident from the chart that thehigher ratio of LS to aniline caused the higher decrease inTg. In the case of sample 2.2, the slight increase in Tg wasobserved. Decrease in Tg is generally known asplasticization. Lignosulfonates grafted into the polyanilinechain can most probably move more easily because of lessrestrictions <strong>and</strong> crosslinking. On the other h<strong>and</strong>, veryinteresting is that lower amount of LS present in thepolymerization caused smaller decrease in Tg or even slightincrease.Glass Transition Temperature[°C]200180160140120100806040200Series 1 Series 2 Series 3starting LS wt ratio 1:4 wt ratio 1:1Figure 5: Glass Transition Temperature <strong>for</strong> testedsamples of starting LS <strong>and</strong> prepared polyanilines.Table 15: Conductivity of polyaniline samplesConductivity (Films) Conductivity (Pellets)Sample ID[S.cm -1 ][S.cm -1 ]1.1 4.01×10 -09 0.01001.2 2.35×10 -10 0.09462.1 1.32×10 -08 0.07762.2 1.27×10 -09 0.15423.1 7.94×10 -10 -3.2 1.92×10 -10 0.2913
Conductivities of polyaniline films <strong>and</strong> pressed polyanilinepellets are presented in Table 15. Low conductivity levels ofpolyaniline films are due to dedoping effect of the solventused 4 . On the other h<strong>and</strong>, conductivity of pressed pellets isin the order of magnitude of 10 -2 to 10 -1 S.cm -1 .Un<strong>for</strong>tunately, it was not possible to measure the pelletsample 3.1 due to bad integrity of the pellet. The highestconductivity was found <strong>for</strong> the polyaniline sample 3.2;which was prepared in the presence of lignosulfonic acidfrom lignosulfonate Polyfon O.ConclusionThe research conducted in this work yielded someinteresting phenomena. Increased smoothness caused adecrease in the conductivity of the printed sample. Asubstrate possessing high permeability <strong>and</strong> low porosityexhibited a lower conductivity than a substrate consisting oflow permeability <strong>and</strong> high porosity. The contact angle ofthe silver-based ink did not show a strong correlation to thepermeability of the substrate. Finally, an increase inrelative humidity resulted in a decrease in conductivity, <strong>and</strong>an increase in temperature caused an increase inconductivity.<strong>Paper</strong> substrate properties impose significant effects on theconductivity of printed electronics. Underst<strong>and</strong>ing theseeffects is a first step towards producing an ideal printedelectronic substrate to optimize product per<strong>for</strong>mance.Future research will further explore the relationshipbetween temperature, relative humidity <strong>and</strong> printedconductivity.AcknowledgementWe thank the <strong>Western</strong> Michigan University Office of theVice President of Research <strong>for</strong> partial financial support ofthis work.IS&T NIP20: International Conference on Digital PrintingTechnologies, Salt Lake City, 2004, pp275-278.6 Steven K. Volkman, Steven Molesa, Brian Mattis, Paul C.Chang, <strong>and</strong> Vivek Subramanian, “Inkjetted OrganicTransistors using a Novel Pentacene Precursor”, Mat. Res.Soc. Symp. Proc. 769 (2003).7 Daniel Huang, Frank Liao, Steven Molesa, David Redinger,<strong>and</strong> Vivek Subramanian, “Plastic-Compatible Low ResistancePrintable Gold Nanoparticle Conductors <strong>for</strong> Flexible<strong>Electronics</strong>”, Journal of the Electrochemical Society, 150 (7)G412-G417 (2003).8 Epstein, et al, “Sulfonated polyaniline salt composition,processes <strong>for</strong> their preparation <strong>and</strong> uses thereof”, US patent5,164,465 (1992)9 Wiswanathan, T., “Conducting composition of matter”, USpatent 6,059,999, (2000)10 Pal, L., Fleming, P. D., Joyce, M. K., “Pore StructureParameters Measurement", manuscript in preparation.11 Pal L., Joyce M. K., <strong>and</strong> Fleming P. D., “Pore StructureParameters Properties - Effect on Barrier <strong>and</strong> Printingproperties of <strong>Paper</strong> <strong>and</strong> <strong>Paper</strong>board”, 2005 Coating &Graphic Arts Conference & Exhibit, Toronto, April 17-20,2005.12 Field, S., “Minimizing Flexo Ink ‘Toning’ DowntimeDuringPressStartup”http://www.flintink.com/flintinkweb.nsf/GetWebGeneralLib/Minimizing+Startup+Downtime+Due+to+Toning?opendocument&subcat=GenLib.13 E. W. Washburn, Phys. Rev. Ser. 2, 17, 273 (1921).14 Peel, J., <strong>Paper</strong> Science <strong>and</strong> <strong>Paper</strong> Manufacture, Angus WildePublications, Vancouver, B.C., (1999), 53-54.15 T555 om-99 “Roughness of <strong>Paper</strong> <strong>and</strong> <strong>Paper</strong>board (PrintsurfMethod)”, TAPPI (1999).Author’s BioReferences1 Assembly Magazine, “Down the Line: <strong>Paper</strong>Batteries”,08/14/2002,http://www.assemblymag.com/CDA/ArticleIn<strong>for</strong>mation/features/BNP_Features_Item/0,6493,98878,00.html.2 Hoske, M., “RFID: Adoption Increases Despite Costs,”Control Engineering, July 2004, 46-47.3 R. Clarke, “Radio Frequency Identification: Will it Work inYour Supply Chain?” WorldPak 2002: Improving the Qualityof Life Through Packaging Innovation, CRC Press, BacaRaton FL, Book 2, (2002), 654-662.4 Hrehorova, E., Wood ,, L. K., Pekarovic, J., Pekarovicova, A.,Fleming, P. D., <strong>and</strong> Bliznyuk, V., “The Properties ofConducting Polymers <strong>and</strong> <strong>Substrates</strong> <strong>for</strong> <strong>Printed</strong> <strong>Electronics</strong>”,Proceedings of the IS&T DF05 International Conference onDigitalFabrication Technologies, Baltimore, 2005.5 Jennifer Rigney, “Materials <strong>and</strong> Processes <strong>for</strong> High SpeedPrinting <strong>for</strong> Electronic Components”, Proceedings of the