environment and diets. The severe AD group may have ... - AInotes
environment and diets. The severe AD group may have ... - AInotes
environment and diets. The severe AD group may have ... - AInotes
Create successful ePaper yourself
Turn your PDF publications into a flip-book with our unique Google optimized e-Paper software.
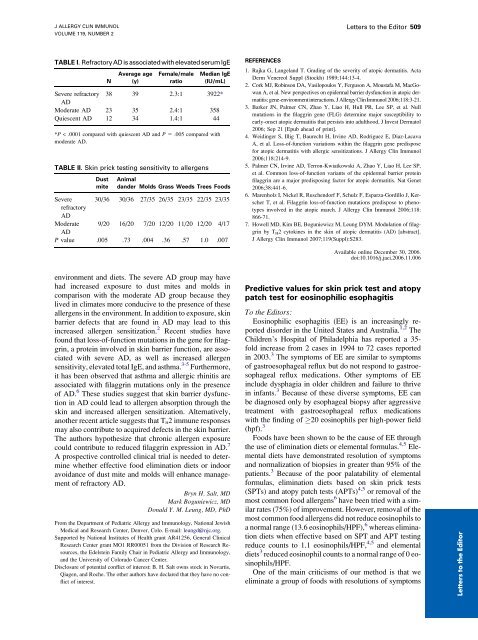
J ALLERGY CLIN IMMUNOLVOLUME 119, NUMBER 2Letters to the Editor 509TABLE I. Refractory<strong>AD</strong> is associatedwith elevated serumIgENAverage age(y)Female/maleratioMedian IgE(IU/mL)Severe refractory 38 39 2.3:1 3922*<strong>AD</strong>Moderate <strong>AD</strong> 23 35 2.4:1 358Quiescent <strong>AD</strong> 12 34 1.4:1 44*P < .0001 compared with quiescent <strong>AD</strong> <strong>and</strong> P 5 .005 compared withmoderate <strong>AD</strong>.TABLE II. Skin prick testing sensitivity to allergensDustmiteAnimald<strong>and</strong>er Molds Grass Weeds Trees FoodsSevere 30/36 30/36 27/35 26/35 23/35 22/35 23/35refractory<strong>AD</strong>Moderate 9/20 16/20 7/20 12/20 11/20 12/20 4/17<strong>AD</strong>P value .005 .73 .004 .36 .57 1.0 .007REFERENCES1. Rajka G, Langel<strong>and</strong> T. Grading of the severity of atopic dermatitis. ActaDerm Venereol Suppl (Stockh) 1989;144:13-4.2. Cork MJ, Robinson DA, Vasilopoulos Y, Ferguson A, Moustafa M, MacGowanA, et al. New perspectives on epidermal barrier dysfunction in atopic dermatitis:gene-<strong>environment</strong> interactions. J Allergy Clin Immunol 2006;118:3-21.3. Barker JN, Palmer CN, Zhao Y, Liao H, Hull PR, Lee SP, et al. Nullmutations in the filaggrin gene (FLG) determine major susceptibility toearly-onset atopic dermatitis that persists into adulthood. J Invest Dermatol2006; Sep 21 [Epub ahead of print].4. Weidinger S, Illig T, Baurecht H, Irvine <strong>AD</strong>, Rodriguez E, Diaz-LacavaA, et al. Loss-of-function variations within the filaggrin gene predisposefor atopic dermatitis with allergic sensitizations. J Allergy Clin Immunol2006;118:214-9.5. Palmer CN, Irvine <strong>AD</strong>, Terron-Kwiatkowski A, Zhao Y, Liao H, Lee SP,et al. Common loss-of-function variants of the epidermal barrier proteinfilaggrin are a major predisposing factor for atopic dermatitis. Nat Genet2006;38:441-6.6. Marenholz I, Nickel R, Ruschendorf F, Schulz F, Esparza-Gordillo J, KerscherT, et al. Filaggrin loss-of-function mutations predispose to phenotypesinvolved in the atopic march. J Allergy Clin Immunol 2006;118:866-71.7. Howell MD, Kim BE, Boguniewicz M, Leung DYM. Modulation of filaggrinby T H 2 cytokines in the skin of atopic dermatitis (<strong>AD</strong>) [abstract].J Allergy Clin Immunol 2007;119(Suppl):S283.Available online December 30, 2006.doi:10.1016/j.jaci.2006.11.006<strong>environment</strong> <strong>and</strong> <strong>diets</strong>. <strong>The</strong> <strong>severe</strong> <strong>AD</strong> <strong>group</strong> <strong>may</strong> <strong>have</strong>had increased exposure to dust mites <strong>and</strong> molds incomparison with the moderate <strong>AD</strong> <strong>group</strong> because theylived in climates more conducive to the presence of theseallergens in the <strong>environment</strong>. In addition to exposure, skinbarrier defects that are found in <strong>AD</strong> <strong>may</strong> lead to thisincreased allergen sensitization. 2 Recent studies <strong>have</strong>found that loss-of-function mutations in the gene for filaggrin,a protein involved in skin barrier function, are associatedwith <strong>severe</strong> <strong>AD</strong>, as well as increased allergensensitivity, elevated total IgE, <strong>and</strong> asthma. 3-5 Furthermore,it has been observed that asthma <strong>and</strong> allergic rhinitis areassociated with filaggrin mutations only in the presenceof <strong>AD</strong>. 6 <strong>The</strong>se studies suggest that skin barrier dysfunctionin <strong>AD</strong> could lead to allergen absorption through theskin <strong>and</strong> increased allergen sensitization. Alternatively,another recent article suggests that T H 2 immune responses<strong>may</strong> also contribute to acquired defects in the skin barrier.<strong>The</strong> authors hypothesize that chronic allergen exposurecould contribute to reduced filaggrin expression in <strong>AD</strong>. 7A prospective controlled clinical trial is needed to determinewhether effective food elimination <strong>diets</strong> or indooravoidance of dust mite <strong>and</strong> molds will enhance managementof refractory <strong>AD</strong>.Bryn H. Salt, MDMark Boguniewicz, MDDonald Y. M. Leung, MD, PhDFrom the Department of Pediatric Allergy <strong>and</strong> Immunology, National JewishMedical <strong>and</strong> Research Center, Denver, Colo. E-mail: leungd@njc.org.Supported by National Institutes of Health grant AR41256, General ClinicalResearch Center grant MO1 RR00051 from the Division of Research Resources,the Edelstein Family Chair in Pediatric Allergy <strong>and</strong> Immunology,<strong>and</strong> the University of Colorado Cancer Center.Disclosure of potential conflict of interest: B. H. Salt owns stock in Novartis,Qiagen, <strong>and</strong> Roche. <strong>The</strong> other authors <strong>have</strong> declared that they <strong>have</strong> no conflictof interest.Predictive values for skin prick test <strong>and</strong> atopypatch test for eosinophilic esophagitisTo the Editors:Eosinophilic esophagitis (EE) is an increasingly reporteddisorder in the United States <strong>and</strong> Australia. 1,2 <strong>The</strong>Children’s Hospital of Philadelphia has reported a 35-fold increase from 2 cases in 1994 to 72 cases reportedin 2003. 3 <strong>The</strong> symptoms of EE are similar to symptomsof gastroesophageal reflux but do not respond to gastroesophagealreflux medications. Other symptoms of EEinclude dysphagia in older children <strong>and</strong> failure to thrivein infants. 3 Because of these diverse symptoms, EE canbe diagnosed only by esophageal biopsy after aggressivetreatment with gastroesophageal reflux medicationswith the finding of 20 eosinophils per high-power field(hpf). 3Foods <strong>have</strong> been shown to be the cause of EE throughthe use of elimination <strong>diets</strong> or elemental formulas. 4,5 Elemental<strong>diets</strong> <strong>have</strong> demonstrated resolution of symptoms<strong>and</strong> normalization of biopsies in greater than 95% of thepatients. 3 Because of the poor palatability of elementalformulas, elimination <strong>diets</strong> based on skin prick tests(SPTs) <strong>and</strong> atopy patch tests (APTs) 4,5 or removal of themost common food allergens 6 <strong>have</strong> been tried with a similarrates (75%) of improvement. However, removal of themost common food allergens did not reduce eosinophils toa normal range (13.6 eosinophils/HPF), 6 whereas elimination<strong>diets</strong> when effective based on SPT <strong>and</strong> APT testingreduce counts to 1.1 eosinophils/HPF, 4,5 <strong>and</strong> elemental<strong>diets</strong> 3 reduced eosinophil counts to a normal range of 0 eosinophils/HPF.One of the main criticisms of our method is that weeliminate a <strong>group</strong> of foods with resolutions of symptomsLetters to the Editor
510 Letters to the EditorJ ALLERGY CLIN IMMUNOLFEBRUARY 2007TABLE I. Predictive values for SPT <strong>and</strong> APT*SPTAPTFood PPV NPV Specificity Sensitivity PPV NPV Specificity SensitivityMilk (n 5 46) 95.7% 57.7% 42.3% 97.6% 83.3% 58.7% 43.5% 90.2%Egg (n 5 39) 84.8% 75.4% 65.1% 90.2% 78.3% 82.8% 62.1% 91.4%Soy (n 5 28) 70.0% 68.9% 37.8% 89.5% 66.7% 87.3% 66.7% 87.3%Wheat (n 5 26) 77.8% 64.7% 18.9% 96.5% 74.2% 83.9% 71.9% 85.5%Corn (n 5 26) 57.1% 71.3% 13.8% 95.4% 65.8% 93.9% 89.3% 78.0%Beef (n 5 23) 81.8% 74.7% 30.0% 96.9% 94.4% 87.0% 65.4% 98.4%Chicken (n 5 15) 50.0% 83.3% 26.3% 93.3% 66.7% 95.7% 80.0% 91.7%Rice (n 5 14) 50.0% 85.6% 13.3% 97.5% 59.1% 96.9% 86.7% 87.5%Potato (n 5 11) 60.0% 89.9% 25.0% 97.6% 53.8% 94.6% 63.6% 92.1%Peanut (n 5 10) 77.8% 97.6% 77.8% 97.6% 75.0% 97.6% 60.0% 98.8%Oat (n 5 9) 33.3% 90.1% 10.0% 97.6% 47.4% 98.5% 90.0% 87.0%Barley (n 5 9) 42.9% 90.8% 27.3% 95.2% 90.0% 98.7% 90.0% 98.7%*n, number of patients with positive change in biopsy after diet modification.Letters to the Editor<strong>and</strong> normalization of biopsies, but we cannot tell whichfoods are responsible for this improvement. <strong>The</strong>refore,we examined a sub<strong>group</strong> of patients in whom we coulddefinitively identify the foods that were causing thedisease <strong>and</strong> calculated the negative predictive values(NPVs), positive predictive values (PPVs), specificity,<strong>and</strong> sensitivity for SPT <strong>and</strong> APT. All patients in this cohorthad EE on the basis of 20 eosinophils per HPF after atleast 1 month treatment with a proton pump inhibitor. <strong>The</strong><strong>group</strong> used for statistical evaluation were patients forwhom we could identify the individual foods that causedEE on the basis of the following: Removal of an individual food led to normal esophagealbiopsy (0 eosinophils/HPF), <strong>and</strong>/or Addition of an individual food led to increasedesophageal eosinophils (greater than 20 eosinophils/HPF)on biopsy after a previously normalbiopsyThis sub<strong>group</strong> is similar to our entire EE cohort of 316patients who <strong>have</strong> undergone APT <strong>and</strong> SPT. However,these patients had biopsies 1 to 2 months after single foodintroduction or removal of an individual food. <strong>The</strong>sepatients elected to <strong>have</strong> biopsies after individual foods for2 reasons: (1) they wanted to definitive know the causativefood, or they had only 1 to 3 positive foods on testing <strong>and</strong>were adding back a single food at a time (25 patients,1 food; 27 patients, 2 foods; 22 patients, 3 foods). <strong>The</strong>refore,we did not use the entire cohort for calculating thepredictive values because patients improved when acollection of foods (3-5) was removed in the entire cohort,making it impossible to determine which food or foodswere responsible for the improvement in biopsies orsymptoms. <strong>The</strong> most common foods for APT in the entirecohort <strong>and</strong> the subcohort were the same: milk, wheat, corn,beef, egg, potato, chicken, soy, barley, oat, <strong>and</strong> rice.<strong>The</strong> population was also similar to a previously describedpopulation in which there was a predominanceof males (64 males, 30 females) <strong>and</strong> atopy (78%diagnosed with asthma, allergic rhinitis, or atopic dermatitis).Eighteen patients had atopic dermatitis, with 1having <strong>severe</strong> atopic dermatitis. <strong>The</strong> average age was 6.4 64.2 (range, 2-18) years, <strong>and</strong> 84% were white. SPT <strong>and</strong>APT were performed as previously described. 4<strong>The</strong> PPVs <strong>and</strong> NPVs along with specificity <strong>and</strong> sensitivitywere calculated on the basis of identification ofsingle foods causing increased eosinophils in biopsies.<strong>The</strong> values are listed for the 12 most common foods inTables I <strong>and</strong> II. Milk <strong>and</strong> egg were the most common foodscausing EE in 46 <strong>and</strong> 39 patients, respectively. <strong>The</strong> PPVfor SPT was greater than 75% for milk, egg, beef, <strong>and</strong> peanut.This is better than traditional skin testing for IgEmediatedreactions, with PPV reported around 50%. 7<strong>The</strong> predictive value for APT ranged from 94% for beefto 54% for potato. <strong>The</strong> specificity for APT ranged from43% to 89%, lower than the reported 91% for APT inatopic dermatitis (<strong>AD</strong>). 8 <strong>The</strong> predictive values for the 5most common foods for the sub<strong>group</strong> in patients with<strong>AD</strong> are reported in Table III. <strong>The</strong> PPVs are better in theEE sub<strong>group</strong> compared with the EE sub<strong>group</strong> with <strong>AD</strong>,suggesting that the <strong>AD</strong> population had a lower sensitivityrate. Similarly, the sensitivity was better for EE (78% to99%) than the published rate for atopic dermatitis (30%to 33%) with APT. 7Because EE is most likely a mixed IgE <strong>and</strong> non-IgEfood-mediated reaction, the combination of SPT <strong>and</strong> APTin the management of EE has been effective <strong>and</strong> needs tobe examined. <strong>The</strong> combination of the 2 testing methodshad an excellent NPV (88% to 100%) for all foods exceptmilk, which was very low at 41% (Table II). <strong>The</strong> PPV wasgreater than 74% for the most common foods (milk, egg,<strong>and</strong> soy), but dropped off as the food became a less commoncause of EE. Similarly, the sensitivity for identificationof foods causing EE ranged from 77% to 97%,depending on the food.<strong>The</strong>refore, the combination of SPT <strong>and</strong> APT in designinga diet plan has a high success rate for food eliminationor food reintroduction in EE with the exception of milk.Milk’s NPV was unacceptably low, suggesting that a
J ALLERGY CLIN IMMUNOLVOLUME 119, NUMBER 2Letters to the Editor 511TABLE II. Predictive values for the combination of SPT<strong>and</strong> APTCombined SPT <strong>and</strong> APTFood PPV NPV Specificity SensitivityMilk 92.0% 40.9% 63.9% 81.8%Egg 84.8% 87.5% 86.7% 85.7%Soy 73.7% 92.9% 87.5% 83.9%Wheat 76.5% 90.0% 81.3% 87.1%Corn 63.4% 92.5% 86.7% 76.6%Beef 85.2% 92.5% 82.1% 93.9%Chicken 62.5% 98.6% 93.8% 88.5%Apple 57.1% 97.7% 66.7% 96.6%Rice 60.9% 100.0% 100.0% 88.8%Potato 61.1% 97.4% 84.6% 91.4%Peanut 71.4% 100.0% 100.0% 95.2%Oat 50.0% 100.0% 100.0% 89.4%Barley 73.3% 100.0% 100.0% 95.2%negative test to milk on SPT <strong>and</strong> APT does not rule outmilk triggering EE. Our method of dry milk powder <strong>may</strong>lead to false-negatives; therefore, alternative methodsshould be explored such as using liquid milk for APT,as in other studies, 9 or larger Finn Chambers (AllerdermLaboratories, Inc., Petaluma, Calif).Is it possible to extend the sub<strong>group</strong> analysis to theentire cohort? <strong>The</strong> fact that the population of the sub<strong>group</strong>had similar APT <strong>and</strong> SPT to the entire cohort on APT <strong>and</strong>SPT would suggest that the predictive values could beextrapolated to the entire <strong>group</strong>, but additional studies areneeded to confirm this. A potential confounding variablefor the predictive values is that we did not monitor forcontamination with other food. Also, similar to previouspublished results, the more positive APT had a higherbut not significantly higher correlation with PPV. Usingthe current PPV <strong>and</strong> sensitivity for all of the foods, thecombination of SPT <strong>and</strong> APT would correctly identify acorrect diet in about 70% of the population with resolutionof the symptoms <strong>and</strong> biopsies, with the remaining 30% requiringan elemental diet for resolution of their symptoms<strong>and</strong> biopsies, similar to our previous published results. 4,5<strong>The</strong>refore, we would suggest elimination <strong>diets</strong> based onpositive foods found on APT <strong>and</strong> SPT <strong>and</strong> milk eliminationregardless of the testing results can prevent the needfor an elemental diet in a majority of children with EE.Jonathan M. Spergel, MD, PhD aTerri Brown-Whitehorn, MD aJanet L. Beausoleil, MD aMichele Shuker, MS, RD, CSP, LDN aChris A. Liacouras, MD bTABLE III. Predictive values for patients with atopicdermatitis <strong>and</strong> EEFrom a the Allergy Section, Division of Allergy <strong>and</strong> Immunology, <strong>and</strong> b theDivision of Gastroenterology <strong>and</strong> Nutrition, Children’s Hospital of Philadelphia,Philadelphia, Pa. E-mail: spergel@email.chop.edu.Disclosure of potential conflict of interest: J. M. Spergel has received grantsupport from Nutricia. C. A. Liacouras has consulting arrangements withCeption, Ross, SHS, <strong>and</strong> Nutricia; has received grant support from Wyeth;is on the speakers’ bureau for TAP <strong>and</strong> AstraZeneca; <strong>and</strong> serves once a yearas an expert witness in litigation <strong>and</strong> receives compensation for it. <strong>The</strong> restof the authors <strong>have</strong> declared that they <strong>have</strong> no conflict of interest.REFERENCESSPTAPTFood PPV NPV PPV NPVMilk (n 5 14) 84.6% 66.7% 100.0% 55.6%Egg (n 5 10) 87.5% 72.7% 71.4% 88.9%Soy (n 5 10) 33.3% 38.5% 80.0% 100.0%Wheat (n 5 5) 0.0% 76.5% 42.9% 77.8%Peanut (n 5 5) 100.0% 87.5% NA 87.5%Beef (n 5 5) 66.7% 81.3% 42.9% 100.0%Corn (n 5 4) 0.0% 61.1% 50.0% 75.0%NA, Not applicable.1. Noel RJ, Putnam PE, Rothenberg ME. Eosinophilic esophagitis. N Engl JMed 2004;351:940-1.2. Cherian S, Smith NM, Forbes DA. Rapidly increasing prevalence ofeosinophilic oesophagitis in Western Australia. Arch Dis Child 2006;91:1000-4.3. Liacouras CA, Spergel JM, Ruchelli E, Verma R, Mascarenhas M, SemeaoE, et al. Eosinophilic esophagitis: a 10-year experience in 381 children.Clin Gastroenterol Hepatol 2005;3:1198-206.4. Spergel JM, Beausoleil JL, Mascarenhas M, Liacouras CA. <strong>The</strong> use ofskin prick tests <strong>and</strong> patch tests to identify causative foods in eosinophilicesophagitis. J Allergy Clin Immunol 2002;109:363-8.5. Spergel JM, Andrews T, Brown-Whitehorn TF, Beausoleil JL, LiacourasCA. Treatment of eosinophilic esophagitis with specific food eliminationdiet directed by a combination of skin prick <strong>and</strong> patch tests. Ann AllergyAsthma Immunol 2005;95:336-43.6. Kagalwalla AF, Sentongo TA, Ritz S, Hess T, Nelson SP, Emerick KM,et al. Effect of six-food elimination diet on clinical <strong>and</strong> histologic outcomesin eosinophilic esophagitis. Clin Gastroenterol Hepatol 2006;4:1097-102.7. Verstege A, Mehl A, Rolinck-Werninghaus C, Staden U, Nocon M, BeyerK, et al. <strong>The</strong> predictive value of the skin prick test weal size for theoutcome of oral food challenges. Clin Exp Allergy 2005;35:1220-6.8. Darsow U, Laifaoui J, Kerschenlohr K, Wollenberg A, Przybilla B, WuthrichB, et al. <strong>The</strong> prevalence of positive reactions in the atopy patchtest with aeroallergens <strong>and</strong> food allergens in subjects with atopic eczema:a European multicenter study. Allergy 2004;59:1318-25.9. De Boissieu D, Waguet JC, Dupont C. <strong>The</strong> atopy patch tests for detectionof cow’s milk allergy with digestive symptoms. J Pediatr 2003;142:203-5.doi:10.1016/j.jaci.2006.11.016Letters to the Editor


