Project paper - The Department of Physics and Astronomy
Project paper - The Department of Physics and Astronomy
Project paper - The Department of Physics and Astronomy

Create successful ePaper yourself
Turn your PDF publications into a flip-book with our unique Google optimized e-Paper software.
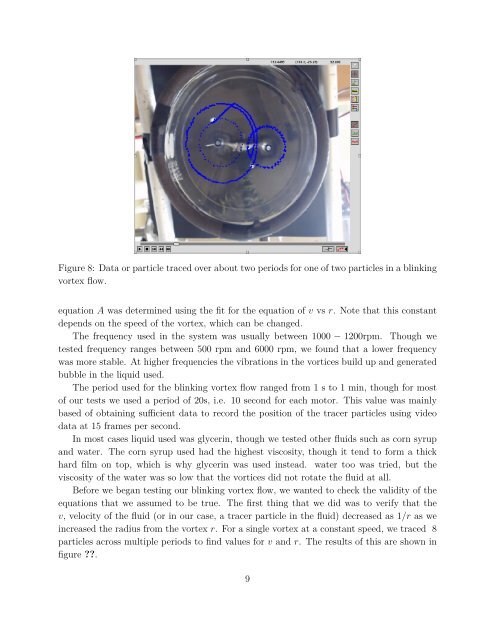
Figure 8: Data or particle traced over about two periods for one <strong>of</strong> two particles in a blinkingvortex flow.equation A was determined using the fit for the equation <strong>of</strong> v vs r. Note that this constantdepends on the speed <strong>of</strong> the vortex, which can be changed.<strong>The</strong> frequency used in the system was usually between 1000 − 1200rpm. Though wetested frequency ranges between 500 rpm <strong>and</strong> 6000 rpm, we found that a lower frequencywas more stable. At higher frequencies the vibrations in the vortices build up <strong>and</strong> generatedbubble in the liquid used.<strong>The</strong> period used for the blinking vortex flow ranged from 1 s to 1 min, though for most<strong>of</strong> our tests we used a period <strong>of</strong> 20s, i.e. 10 second for each motor. This value was mainlybased <strong>of</strong> obtaining sufficient data to record the position <strong>of</strong> the tracer particles using videodata at 15 frames per second.In most cases liquid used was glycerin, though we tested other fluids such as corn syrup<strong>and</strong> water. <strong>The</strong> corn syrup used had the highest viscosity, though it tend to form a thickhard film on top, which is why glycerin was used instead. water too was tried, but theviscosity <strong>of</strong> the water was so low that the vortices did not rotate the fluid at all.Before we began testing our blinking vortex flow, we wanted to check the validity <strong>of</strong> theequations that we assumed to be true. <strong>The</strong> first thing that we did was to verify that thev, velocity <strong>of</strong> the fluid (or in our case, a tracer particle in the fluid) decreased as 1/r as weincreased the radius from the vortex r. For a single vortex at a constant speed, we traced 8particles across multiple periods to find values for v <strong>and</strong> r. <strong>The</strong> results <strong>of</strong> this are shown infigure ??.9