Field Guide. cropping and pastoral grazing on flat to rolling country.
Field Guide. cropping and pastoral grazing on flat to rolling country.
Field Guide. cropping and pastoral grazing on flat to rolling country.

Create successful ePaper yourself
Turn your PDF publications into a flip-book with our unique Google optimized e-Paper software.
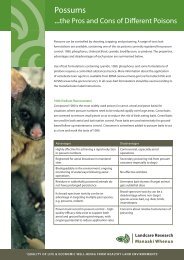
VISUAL SOILASSESSMENTCROPPED SOILPASTORALSOILVOLUME 1<str<strong>on</strong>g>Field</str<strong>on</strong>g> guide for <str<strong>on</strong>g>cropping</str<strong>on</strong>g> <str<strong>on</strong>g>and</str<strong>on</strong>g> <str<strong>on</strong>g>pas<strong>to</strong>ral</str<strong>on</strong>g> <str<strong>on</strong>g>grazing</str<strong>on</strong>g><strong>on</strong> <strong>flat</strong> <strong>to</strong> <strong>rolling</strong> <strong>country</strong>Graham Shepherd
VISUAL SOIL ASSESSMENTVolume 1: <str<strong>on</strong>g>Field</str<strong>on</strong>g> guide for <str<strong>on</strong>g>cropping</str<strong>on</strong>g> & <str<strong>on</strong>g>pas<strong>to</strong>ral</str<strong>on</strong>g> <str<strong>on</strong>g>grazing</str<strong>on</strong>g><strong>on</strong> <strong>flat</strong> <strong>to</strong> <strong>rolling</strong> <strong>country</strong>T. Graham ShepherdL<str<strong>on</strong>g>and</str<strong>on</strong>g>care ResearchPrivate Bag 11 052Palmerst<strong>on</strong> NorthNew Zeal<str<strong>on</strong>g>and</str<strong>on</strong>g>BIBLIOGRAPHICAL REFERENCEShepherd, T.G. 2000: Visual Soil Assessment. Volume 1. <str<strong>on</strong>g>Field</str<strong>on</strong>g>guide for <str<strong>on</strong>g>cropping</str<strong>on</strong>g> <str<strong>on</strong>g>and</str<strong>on</strong>g> <str<strong>on</strong>g>pas<strong>to</strong>ral</str<strong>on</strong>g> <str<strong>on</strong>g>grazing</str<strong>on</strong>g> <strong>on</strong> <strong>flat</strong> <strong>to</strong> <strong>rolling</strong> <strong>country</strong>.horiz<strong>on</strong>s.mw & L<str<strong>on</strong>g>and</str<strong>on</strong>g>care Research, Palmerst<strong>on</strong> North. 84pISBN 1-877221-92-9horiz<strong>on</strong>s.mw Report Number 20/EXT/425© horiz<strong>on</strong>s.mw & L<str<strong>on</strong>g>and</str<strong>on</strong>g>care Research New Zeal<str<strong>on</strong>g>and</str<strong>on</strong>g> Ltd 2000No part of this work covered by copyright may be reproduced orcopied in any form or by any means (graphic, electr<strong>on</strong>ic or mechanical,including pho<strong>to</strong>copying, recording, taping, informati<strong>on</strong> retrievalsystems, or otherwise) without the written permissi<strong>on</strong> of the publishers.ACKNOWLEDGEMENTSThe author gratefully acknowledges the c<strong>on</strong>tributi<strong>on</strong>s of Gregor Yeates(L<str<strong>on</strong>g>and</str<strong>on</strong>g>care Research), Helmut Janssen, Lou Bird <str<strong>on</strong>g>and</str<strong>on</strong>g> Malcom Todd(horiz<strong>on</strong>s.mw), <str<strong>on</strong>g>and</str<strong>on</strong>g> of Dan Bloomer (Hawke’s Bay Regi<strong>on</strong>al Council). Thec<strong>on</strong>tributi<strong>on</strong> of farmers, regi<strong>on</strong>al council <str<strong>on</strong>g>and</str<strong>on</strong>g> Crown Research Institutestaff, MAFPolicy, Agriculture NZ <str<strong>on</strong>g>and</str<strong>on</strong>g> industry people who attended theworkshop/field day <strong>on</strong> trialing the VSA was also very helpful in developingthe VSA field guide. The c<strong>on</strong>tributi<strong>on</strong> <str<strong>on</strong>g>and</str<strong>on</strong>g> discussi<strong>on</strong>s held with AlecMackay, David Barker <str<strong>on</strong>g>and</str<strong>on</strong>g> Keith Betteridge of AgResearch are gratefullyacknowledged. The review of the manuscript by Craig Ross, <str<strong>on</strong>g>and</str<strong>on</strong>g> theedi<strong>to</strong>rial <str<strong>on</strong>g>and</str<strong>on</strong>g> administrative role of Anne Austin, David Swain <str<strong>on</strong>g>and</str<strong>on</strong>g> PeterStephens are greatly appreciated.The Ministry for the Envir<strong>on</strong>ment is gratefully acknowledged for itsgenerous funding of the publicati<strong>on</strong> of this book. horiz<strong>on</strong>s.mw, Hawke’sBay Regi<strong>on</strong>al Council <str<strong>on</strong>g>and</str<strong>on</strong>g> Wellingt<strong>on</strong> Regi<strong>on</strong>al Council are also gratefullyacknowledged for funding the project.Book design: Lynn Peck, Central Media Ltd
TABLE OF CONTENTSIntroducti<strong>on</strong> 5Visual soil assessmen<strong>to</strong>f soil qualityunder <str<strong>on</strong>g>cropping</str<strong>on</strong>g> 11Score cardSoil indica<strong>to</strong>rs 13Plant indica<strong>to</strong>rs 14Instructi<strong>on</strong>s forassessing soil qualityunder <str<strong>on</strong>g>cropping</str<strong>on</strong>g> 15Soil indica<strong>to</strong>rs 15Plant indica<strong>to</strong>rs 33Visual soil assessmen<strong>to</strong>f soil qualityunder <str<strong>on</strong>g>pas<strong>to</strong>ral</str<strong>on</strong>g> <str<strong>on</strong>g>grazing</str<strong>on</strong>g><strong>on</strong> <strong>flat</strong> <strong>to</strong> <strong>rolling</strong> l<str<strong>on</strong>g>and</str<strong>on</strong>g> 51Score cardSoil indica<strong>to</strong>rs 53Plant indica<strong>to</strong>rs 54Instructi<strong>on</strong>s forassessing soil qualityunder <str<strong>on</strong>g>pas<strong>to</strong>ral</str<strong>on</strong>g> <str<strong>on</strong>g>grazing</str<strong>on</strong>g> 55Soil indica<strong>to</strong>rs 55Plant indica<strong>to</strong>rs 69
4 VISUAL SOIL ASSESSMENT: Volume 1
INTRODUCTIONTHE QUESTION – To profit or <strong>to</strong> pug?The soil’s physical properties are vital <strong>to</strong> the ecological <str<strong>on</strong>g>and</str<strong>on</strong>g> ec<strong>on</strong>omic sustainability ofl<str<strong>on</strong>g>and</str<strong>on</strong>g>. They c<strong>on</strong>trol the movement of water <str<strong>on</strong>g>and</str<strong>on</strong>g> air through the soil, <str<strong>on</strong>g>and</str<strong>on</strong>g> the ease withwhich roots penetrate the soil. Damage <strong>to</strong> the soil can change these properties <str<strong>on</strong>g>and</str<strong>on</strong>g>reduce plant growth, regardless of nutrient status. Decline in soil physical propertiestakes c<strong>on</strong>siderable expense <str<strong>on</strong>g>and</str<strong>on</strong>g> many years <strong>to</strong> correct, <str<strong>on</strong>g>and</str<strong>on</strong>g> can increase the risk of soilerosi<strong>on</strong> by water or wind.CropPastureTop soilUnrestrictedpenetrati<strong>on</strong> <str<strong>on</strong>g>and</str<strong>on</strong>g>developmen<strong>to</strong>f plant rootsCO 2AirUnrestrictedmovemen<strong>to</strong>f air <str<strong>on</strong>g>and</str<strong>on</strong>g>waterSubsoilThe primary functi<strong>on</strong>s of the soil are <strong>to</strong> provide plants with air, water,nutrients <str<strong>on</strong>g>and</str<strong>on</strong>g> a rooting medium for growth <str<strong>on</strong>g>and</str<strong>on</strong>g> physical support.Safeguarding the soil resource for present <str<strong>on</strong>g>and</str<strong>on</strong>g> future generati<strong>on</strong>s is a key task of l<str<strong>on</strong>g>and</str<strong>on</strong>g>managers. Loss of soil quality (soil degradati<strong>on</strong>) can significantly affect theenvir<strong>on</strong>mental sustainability of the soil, <str<strong>on</strong>g>and</str<strong>on</strong>g> the ec<strong>on</strong>omic sustainability of farmingbusinesses.There is more <strong>to</strong> measuring soil quality than just assessing carrying capacity, cropyield or soil fertility. Often, not enough attenti<strong>on</strong> is given <strong>to</strong>: the basic role of soil quality in efficient <str<strong>on</strong>g>and</str<strong>on</strong>g> sustained producti<strong>on</strong> the effect of soil quality <strong>on</strong> the farm’s gross profit margin the l<strong>on</strong>g-term planning needed <strong>to</strong> sustain good soil quality the need for l<str<strong>on</strong>g>and</str<strong>on</strong>g> managers <strong>to</strong> be able <strong>to</strong> identify <str<strong>on</strong>g>and</str<strong>on</strong>g> predict the effects of theirshort- <str<strong>on</strong>g>and</str<strong>on</strong>g> medium-term l<str<strong>on</strong>g>and</str<strong>on</strong>g> management decisi<strong>on</strong>s <strong>on</strong> soil quality.As a l<str<strong>on</strong>g>and</str<strong>on</strong>g> manager, you need reliable <strong>to</strong>ols <strong>to</strong> help you make decisi<strong>on</strong>s that will lead <strong>to</strong>sustainable l<str<strong>on</strong>g>and</str<strong>on</strong>g> management. The way you manage your farm has profound effects <strong>on</strong>your soil, <str<strong>on</strong>g>and</str<strong>on</strong>g> your soil has profound effects <strong>on</strong> your l<strong>on</strong>g-term profit.VISUAL SOIL ASSESSMENT: Volume 15
THE ANSWER – Visual soil assessment (VSA)Many physical, biological <str<strong>on</strong>g>and</str<strong>on</strong>g>, <strong>to</strong> a lesser degree, chemical soil properties show up asvisual characteristics. Changes in l<str<strong>on</strong>g>and</str<strong>on</strong>g> use or l<str<strong>on</strong>g>and</str<strong>on</strong>g> management can markedly alter these.Research in New Zeal<str<strong>on</strong>g>and</str<strong>on</strong>g> <str<strong>on</strong>g>and</str<strong>on</strong>g> overseas shows that many visual indica<strong>to</strong>rs are closelyrelated <strong>to</strong> key quantitative (measurement-based) indica<strong>to</strong>rs of soil quality.Visual assessment providesan immediate effectivediagnostic <strong>to</strong>ol <strong>to</strong> assesssoil quality, <str<strong>on</strong>g>and</str<strong>on</strong>g> the resultsare easy <strong>to</strong> interpret <str<strong>on</strong>g>and</str<strong>on</strong>g>underst<str<strong>on</strong>g>and</str<strong>on</strong>g>. Compare a soilunder well-managed<str<strong>on</strong>g>pas<strong>to</strong>ral</str<strong>on</strong>g> <str<strong>on</strong>g>grazing</str<strong>on</strong>g> (<strong>on</strong> theright of the palm), <str<strong>on</strong>g>and</str<strong>on</strong>g>poorly managed l<strong>on</strong>g-termc<strong>on</strong>tinuous <str<strong>on</strong>g>cropping</str<strong>on</strong>g> (<strong>on</strong>the left)These relati<strong>on</strong>ships have been used <strong>to</strong> develop VSA. The VSA <str<strong>on</strong>g>Field</str<strong>on</strong>g> <str<strong>on</strong>g>Guide</str<strong>on</strong>g> has beendeveloped <strong>to</strong> help l<str<strong>on</strong>g>and</str<strong>on</strong>g> managers assess soil quality easily, quickly, reliably <str<strong>on</strong>g>and</str<strong>on</strong>g> cheaply <strong>on</strong>a paddock scale. It requires little equipment, training or technical skills. Assessing <str<strong>on</strong>g>and</str<strong>on</strong>g>m<strong>on</strong>i<strong>to</strong>ring soil quality <strong>on</strong> your farm with VSA, <str<strong>on</strong>g>and</str<strong>on</strong>g> following guidelines for preventi<strong>on</strong>or recovery of soil degradati<strong>on</strong>, can help you develop <str<strong>on</strong>g>and</str<strong>on</strong>g> implement sustainable l<str<strong>on</strong>g>and</str<strong>on</strong>g>management practices.The VSA methodVSA is based <strong>on</strong> the visual assessment of key soil ‘state’ <str<strong>on</strong>g>and</str<strong>on</strong>g> plant ‘performance’ indica<strong>to</strong>rsof soil quality, presented <strong>on</strong> a score card. Soil quality is ranked by assessment of the soilindica<strong>to</strong>rs al<strong>on</strong>e. It does not require knowledge of paddock his<strong>to</strong>ry. Plant indica<strong>to</strong>rs,however, require knowledge of immediate crop <str<strong>on</strong>g>and</str<strong>on</strong>g> paddock his<strong>to</strong>ry. Because of this, <strong>on</strong>lythose who have this informati<strong>on</strong> will be able <strong>to</strong> complete the plant indica<strong>to</strong>r score cardsatisfac<strong>to</strong>rily.Plant indica<strong>to</strong>rs extend or qualify the soil quality assessment <strong>to</strong> allow you <strong>to</strong> make cause<str<strong>on</strong>g>and</str<strong>on</strong>g> effect links between management practices <str<strong>on</strong>g>and</str<strong>on</strong>g> soil characteristics. By looking atboth soil indica<strong>to</strong>rs <str<strong>on</strong>g>and</str<strong>on</strong>g> plant indica<strong>to</strong>rs, VSA links the natural resource (soil) with plantperformance <str<strong>on</strong>g>and</str<strong>on</strong>g> farm enterprise profitability. Because of this, the soil quality assessmentis not a combinati<strong>on</strong> of the ‘soil’ <str<strong>on</strong>g>and</str<strong>on</strong>g> ‘plant’ scores. Rather, the scores should be looked atseparately, <str<strong>on</strong>g>and</str<strong>on</strong>g> compared.6 VISUAL SOIL ASSESSMENT: Volume 1
The following examples illustrate the practical applicati<strong>on</strong> of VSA: A farmer records good crop yields <str<strong>on</strong>g>and</str<strong>on</strong>g>, as a result, thinks ‘things are fine’. But <strong>on</strong> applyingVSA, the farmer discovers that the soil quality score is moderate, <str<strong>on</strong>g>and</str<strong>on</strong>g> realises that thenumber of passes for cultivati<strong>on</strong>, the need for weed <str<strong>on</strong>g>and</str<strong>on</strong>g> pest c<strong>on</strong>trol, <str<strong>on</strong>g>and</str<strong>on</strong>g> the fertiliserrequirements, have been increasing over time, al<strong>on</strong>g with the cost. With this knowledge,the farmer can make choices so that appropriate future management can lead <strong>to</strong> reducedinput costs, increase profitability <str<strong>on</strong>g>and</str<strong>on</strong>g> improve soil quality. A farmer wants <strong>to</strong> exp<str<strong>on</strong>g>and</str<strong>on</strong>g> <str<strong>on</strong>g>cropping</str<strong>on</strong>g> by leasing or buying additi<strong>on</strong>al l<str<strong>on</strong>g>and</str<strong>on</strong>g>. VSA canprovide important informati<strong>on</strong> about the soil quality of the l<str<strong>on</strong>g>and</str<strong>on</strong>g> under c<strong>on</strong>siderati<strong>on</strong>,which can help the farmer decide whether <strong>to</strong> lease/buy, or look for an alternativeblock of l<str<strong>on</strong>g>and</str<strong>on</strong>g>.VSA provides a usefuleducati<strong>on</strong>al <str<strong>on</strong>g>and</str<strong>on</strong>g> vocati<strong>on</strong>altraining <strong>to</strong>ol forthose unfamiliar with soilscience. It can bring abetter underst<str<strong>on</strong>g>and</str<strong>on</strong>g>ing ofsoil quality <str<strong>on</strong>g>and</str<strong>on</strong>g> its fundamentalimportance <strong>to</strong>sustainable resource <str<strong>on</strong>g>and</str<strong>on</strong>g>envir<strong>on</strong>mental management.In particular, VSAcan develop a greaterawareness of the importanceof soil physicalproperties (such as soilaerati<strong>on</strong>) in governingsoil quality <str<strong>on</strong>g>and</str<strong>on</strong>g> <strong>on</strong>-farmproducti<strong>on</strong>.COURTESY OF GUY VICKERSVisual scoring (VS)Each indica<strong>to</strong>r is given a visual score (VS) of 0 (poor), 1 (moderate), or 2 (good), based<strong>on</strong> the soil quality observed when comparing the paddock sample with three pho<strong>to</strong>graphsin the field guide manual. The scoring is flexible, so if the sample you are assessing doesnot clearly align with any <strong>on</strong>e of the pho<strong>to</strong>graphs but sits between two, a score in betweencan be given, for example 0.5 or 1.5. An explanati<strong>on</strong> of the scoring criteria accompanieseach set of pho<strong>to</strong>graphs.Because some soil fac<strong>to</strong>rs or indica<strong>to</strong>rs are relatively more important for soil qualitythan others, VSA provides a weighting fac<strong>to</strong>r of 1, 2 or 3. For example, soil structure is amore important indica<strong>to</strong>r (a fac<strong>to</strong>r of 3) than clod development (a fac<strong>to</strong>r of 1). The scoreyou give each indica<strong>to</strong>r is multiplied by the weighting fac<strong>to</strong>r <strong>to</strong> give a VS ranking. The<strong>to</strong>tal of the VS rankings gives the overall ranking score for the sample you are assessing.Compare this with the score ranges at the bot<strong>to</strong>m of the page <strong>to</strong> determine whether yoursoil has good, moderate, or poor soil quality.VISUAL SOIL ASSESSMENT: Volume 17
The soil quality assessment is not a combinati<strong>on</strong> of the scores from the soil <str<strong>on</strong>g>and</str<strong>on</strong>g> plantscore cards. Placing the soil <str<strong>on</strong>g>and</str<strong>on</strong>g> plant indica<strong>to</strong>r scores of soil quality side by side at thebot<strong>to</strong>m of the plant indica<strong>to</strong>r scorecard should prompt you <strong>to</strong> look for reas<strong>on</strong>s if there is asignificant discrepancy between the soil <str<strong>on</strong>g>and</str<strong>on</strong>g> plant indica<strong>to</strong>rs. The soil management guidelinesfor <str<strong>on</strong>g>cropping</str<strong>on</strong>g> <str<strong>on</strong>g>and</str<strong>on</strong>g> <str<strong>on</strong>g>pas<strong>to</strong>ral</str<strong>on</strong>g> <str<strong>on</strong>g>grazing</str<strong>on</strong>g> (Volume 2) can help you do this.CARRYING OUT THE ASSESSMENTThe VSA <strong>to</strong>ol kitThe equipment needed for the VSA ‘<strong>to</strong>olkit’ is simple <str<strong>on</strong>g>and</str<strong>on</strong>g> inexpensive. It comprises: 1 spade – <strong>to</strong> dig out a 20 cm cube of <strong>to</strong>psoil. 1 plastic basin (approx. 35x35x19 cm) – <strong>to</strong> c<strong>on</strong>tain the soil when carrying out thedrop shatter test. 1 hard square board (approx. 26x26x1.8 cm) – <strong>to</strong> fit the bot<strong>to</strong>m of the plastic basin<strong>on</strong> <strong>to</strong> which the soil cube is dropped for the shatter test. 1 heavy duty plastic bag (approx. 74x49 cm) – <strong>on</strong> which <strong>to</strong> spread the soil, after theshatter test has been carried out. 1 VSA field guide (weather proof) – <strong>to</strong> make the pho<strong>to</strong>graphic comparis<strong>on</strong>s. 1 pad of score cards – <strong>to</strong> record the visual score (VS) for each indica<strong>to</strong>r. Separate padsare needed for <str<strong>on</strong>g>cropping</str<strong>on</strong>g> <str<strong>on</strong>g>and</str<strong>on</strong>g> <str<strong>on</strong>g>pas<strong>to</strong>ral</str<strong>on</strong>g> <str<strong>on</strong>g>grazing</str<strong>on</strong>g> <strong>on</strong> <strong>flat</strong> <strong>to</strong> <strong>rolling</strong> l<str<strong>on</strong>g>and</str<strong>on</strong>g>. The soil <str<strong>on</strong>g>and</str<strong>on</strong>g> plantscore cards have been printed back-<strong>to</strong>-back. See examples <strong>on</strong> pp 13 & 14.THE PROCEDURE1. When should soil quality assessment be carried out?The following recommendati<strong>on</strong>s are given as a general guide: For <str<strong>on</strong>g>cropping</str<strong>on</strong>g> soils – Test <strong>on</strong>ce a year after harvest <str<strong>on</strong>g>and</str<strong>on</strong>g> before cultivati<strong>on</strong>. You could makea sec<strong>on</strong>d test after the final cultivati<strong>on</strong> <strong>to</strong> check the c<strong>on</strong>diti<strong>on</strong> of the seedbed. For <str<strong>on</strong>g>pas<strong>to</strong>ral</str<strong>on</strong>g> <str<strong>on</strong>g>grazing</str<strong>on</strong>g> soils – Test <strong>on</strong>ce a year in late winter or early spring.VSA can be carried out effectively <str<strong>on</strong>g>and</str<strong>on</strong>g> reliably over a range of soil moisture levels, acharacteristic that enhances the robustness of VSA as a <strong>to</strong>ol. However, we suggest thatyou carry out the VSA when you judge that the soil is at the correct moisture c<strong>on</strong>tent forcultivati<strong>on</strong>, or is sufficiently dry <strong>to</strong> prevent compacti<strong>on</strong> <str<strong>on</strong>g>and</str<strong>on</strong>g> pugging by wheel traffic <str<strong>on</strong>g>and</str<strong>on</strong>g>s<strong>to</strong>ck treading.If you’re not sure, apply the ‘worm test’. Roll a ‘worm’ of soil <strong>on</strong> the palm of <strong>on</strong>e h<str<strong>on</strong>g>and</str<strong>on</strong>g> with thefingers of the other until it is 50 mm l<strong>on</strong>g <str<strong>on</strong>g>and</str<strong>on</strong>g> 4 mm thick for cropped soils <str<strong>on</strong>g>and</str<strong>on</strong>g> 2 mm thick for<str<strong>on</strong>g>pas<strong>to</strong>ral</str<strong>on</strong>g> soils. If the soil cracks before the worm is made, or if you cannot form a worm (forexample, if the soil is s<str<strong>on</strong>g>and</str<strong>on</strong>g>y), the soil is suitable for testing. If you can make the worm, the soilis <strong>to</strong>o wet <strong>to</strong> test. (See details in Volume 2.)As l<strong>on</strong>g as the soil moisture c<strong>on</strong>diti<strong>on</strong> is right, test at a similar time each year. This willmake your results more comparable from year <strong>to</strong> year.8 VISUAL SOIL ASSESSMENT: Volume 1
2. Setting upIt is important <strong>to</strong> be properly prepared <strong>to</strong> carry out soil quality assessments. Time – Allow about 20 minutes per site. The assessment process takes about 15 minutes<strong>to</strong> complete the soil indica<strong>to</strong>r score card, <str<strong>on</strong>g>and</str<strong>on</strong>g> five minutes <strong>to</strong> complete the plantindica<strong>to</strong>r score card for each site. Sample three or four sites in the paddock for arepresentative assessment of soil quality. Reference sample – Take a small soil sample from under the fence. The paddock <strong>to</strong> besampled will have had a his<strong>to</strong>ry of <str<strong>on</strong>g>grazing</str<strong>on</strong>g> or <str<strong>on</strong>g>cropping</str<strong>on</strong>g>. Taking a spade-depth samplefrom under a fenceline where there has been little if any cultivati<strong>on</strong> or treading, allowsyou <strong>to</strong> see the relatively unaltered soil. This helps you give the correct visual score <strong>to</strong>the soil colour matrix indica<strong>to</strong>r. Sites – Select sites that are representative of the paddock. When carrying out paddockassessments, avoid areas such as headl<str<strong>on</strong>g>and</str<strong>on</strong>g>s or loading areas, which may have had heaviertraffic than the rest of the paddock. VSA can also be used, however, <strong>to</strong> assess theeffects of high traffic loading <strong>on</strong> soil quality; wheel tracks in row crops, for example,can be selected <str<strong>on</strong>g>and</str<strong>on</strong>g> the results compared with low traffic areas.It is important <strong>to</strong> record the positi<strong>on</strong> of the assessment sites in your paddock accurately soyou can come back <strong>to</strong> them for future m<strong>on</strong>i<strong>to</strong>ring. The simplest way <strong>to</strong> do this is <strong>to</strong> notethe number of paces al<strong>on</strong>g a fence line from the paddock gate, <str<strong>on</strong>g>and</str<strong>on</strong>g> in from the fence line. Set up the gear. At the chosen site, put the square of wood in the bot<strong>to</strong>m of theplastic basin, <str<strong>on</strong>g>and</str<strong>on</strong>g> spread out <str<strong>on</strong>g>and</str<strong>on</strong>g> anchor down the plastic bag beside it.3. Site informati<strong>on</strong>Complete the site informati<strong>on</strong> secti<strong>on</strong> at the <strong>to</strong>p of the score card. Then record anyspecial aspects you think relevant in the notes secti<strong>on</strong> at the bot<strong>to</strong>m of the reverse side ofthe score card (for example, wet weather at harvest last seas<strong>on</strong>; soil heavily pugged bys<strong>to</strong>ck <str<strong>on</strong>g>grazing</str<strong>on</strong>g> stubble; <strong>to</strong>psoil blew off two years ago, etc.).4. Carrying out the test Take the test sample. Dig out a 20 cm cube of <strong>to</strong>psoil with the spade. If the <strong>to</strong>psoilis less than 20 cm deep, trim off the subsoil before moving <strong>on</strong> <strong>to</strong> the next step. Thesample provides the soil from which most of the soil state indica<strong>to</strong>rs are assessed.The drop shatter test – Drop thesame test sample a maximum ofthree times from a height of 1 m(waist height) <strong>on</strong><strong>to</strong> the woodensquare in the plastic basin. Thentransfer the soil <strong>on</strong><strong>to</strong> the largeplastic bag <str<strong>on</strong>g>and</str<strong>on</strong>g> grade so that thecoarsest clods are at <strong>on</strong>e end <str<strong>on</strong>g>and</str<strong>on</strong>g>the finest aggregates are at theother end (as shown in the“Instructi<strong>on</strong>s” secti<strong>on</strong>s).COURTESY OF GUY VICKERSVISUAL SOIL ASSESSMENT: Volume 19
The drop shatter test. Drop the same test sample a maximum of three times from aheight of 1m (waist height) <strong>on</strong><strong>to</strong> the wooden square in the plastic basin. Transfer thesoil <strong>on</strong><strong>to</strong> the large plastic bag <str<strong>on</strong>g>and</str<strong>on</strong>g> grade so that the coarsest clods are at <strong>on</strong>e end <str<strong>on</strong>g>and</str<strong>on</strong>g> thefinest aggregates are at the other end (as shown in the ‘instructi<strong>on</strong>s’ secti<strong>on</strong>s, pages17 <str<strong>on</strong>g>and</str<strong>on</strong>g> 57).Systematically work through the score card, assigning a visual score (VS) <strong>to</strong> eachindica<strong>to</strong>r by comparing the soil laid out <strong>on</strong> the plastic bag with the pho<strong>to</strong>graphs <str<strong>on</strong>g>and</str<strong>on</strong>g>descripti<strong>on</strong> in the relevant secti<strong>on</strong> of the field guide.5. The plant indica<strong>to</strong>rsYou can normally complete the plant indica<strong>to</strong>r score card at the time you carry out thesoil indica<strong>to</strong>r assessment, by comparing your recollecti<strong>on</strong> of crop development orobservati<strong>on</strong>s of the pasture, with the pho<strong>to</strong>graphs in the field guide manual. But someplant indica<strong>to</strong>rs, such as the degree <str<strong>on</strong>g>and</str<strong>on</strong>g> nature of root development <str<strong>on</strong>g>and</str<strong>on</strong>g> grain development,cannot be assessed at the same time as the soil indica<strong>to</strong>rs. Ideally, these should be assessedat plant maturity.The plant indica<strong>to</strong>rs are scored <str<strong>on</strong>g>and</str<strong>on</strong>g> ranked in the same way as soil indica<strong>to</strong>rs: a weightingfac<strong>to</strong>r is used <strong>to</strong> indicate the relative importance of each indica<strong>to</strong>r, with each c<strong>on</strong>tributing<strong>to</strong> the final determinati<strong>on</strong> of soil quality. The ranking score is the <strong>to</strong>tal of the individualVS rankings in the right-h<str<strong>on</strong>g>and</str<strong>on</strong>g> column.SPECIAL USES OF VSAThe VSA procedure can be used <strong>to</strong> assess particular characteristics, <str<strong>on</strong>g>and</str<strong>on</strong>g> at any depth. Forexample: During winter, there was severe pugging of the <strong>to</strong>p 10 cm of <strong>to</strong>psoil.Instead of taking <strong>on</strong>e 20 cm cube of <strong>to</strong>psoil, take two 20x20x10 cm samples from 0 <strong>to</strong>10 cm depth <str<strong>on</strong>g>and</str<strong>on</strong>g> combine <strong>to</strong> form a single sample. Take another two 20x20x10 cmsamples from 10 <strong>to</strong> 20 cm depth <str<strong>on</strong>g>and</str<strong>on</strong>g> again combine <strong>to</strong> form a single sample. Test eachcombined sample separately <str<strong>on</strong>g>and</str<strong>on</strong>g> compare the results. The comparis<strong>on</strong> will dem<strong>on</strong>stratethe degree <strong>to</strong> which the upper part of the <strong>to</strong>psoil has been damaged by treadingcompared with the lower <strong>to</strong>psoil. A plough pan layer is suspected at 10–20 cm depth – Again, as describedabove, take two combined samples from 0 <strong>to</strong> 10 cm depth, <str<strong>on</strong>g>and</str<strong>on</strong>g> two combined samplesfrom 10 <strong>to</strong> 20 cm depth, test separately <str<strong>on</strong>g>and</str<strong>on</strong>g> compare the results. The comparis<strong>on</strong> willdem<strong>on</strong>strate whether the plough pan is significant or not.USING THE VSA RESULTSVSA allows you <strong>to</strong> assess soil quality in a paddock but does not solve any identified soilquality issues. Once soil is degraded, it can take a l<strong>on</strong>g time (sometimes decades) <strong>to</strong> recover.To help l<str<strong>on</strong>g>and</str<strong>on</strong>g> managers preserve or improve soil quality, guidelines are included in Volume 2for the sustainable management of <str<strong>on</strong>g>cropping</str<strong>on</strong>g> <str<strong>on</strong>g>and</str<strong>on</strong>g> <str<strong>on</strong>g>pas<strong>to</strong>ral</str<strong>on</strong>g> <str<strong>on</strong>g>grazing</str<strong>on</strong>g> <strong>on</strong> <strong>flat</strong> <strong>to</strong> <strong>rolling</strong> <strong>country</strong>.10 VISUAL SOIL ASSESSMENT: Volume 1
VISUAL SOILASSESSMENTNO-TILLCONVENTIONAL CULTIVATIONPART ONEOf soil quality under <str<strong>on</strong>g>cropping</str<strong>on</strong>g>
SCORE CARDVisual indica<strong>to</strong>rs for assessing soil quality under <str<strong>on</strong>g>cropping</str<strong>on</strong>g>SOIL INDICATORSL<str<strong>on</strong>g>and</str<strong>on</strong>g> use:Site locati<strong>on</strong>/Paddock name:Date:Soil type:Textural qualifier: S<str<strong>on</strong>g>and</str<strong>on</strong>g>y Loamy ClayeyMoisture c<strong>on</strong>diti<strong>on</strong>: Dry Slightly moist Moist WetSeas<strong>on</strong>al weatherc<strong>on</strong>diti<strong>on</strong>s:Dry Wet Cold Warm AverageVisual Indica<strong>to</strong>r Visual Score (VS) Weighting VS Rankingof Soil Quality0 = Poor c<strong>on</strong>diti<strong>on</strong>1 = Moderate c<strong>on</strong>diti<strong>on</strong>2 = Good c<strong>on</strong>diti<strong>on</strong>Soil structure & c<strong>on</strong>sistence(Fig. 1, p.17) × 3Soil porosity(Fig. 2, p.19) × 3Soil colour(Fig. 3, p.21) × 2Number <str<strong>on</strong>g>and</str<strong>on</strong>g> colour of soilmottles (Fig. 4, p.23) × 2Earthworm counts(Fig. 5, p. 25) × 2Tillage pan(Fig. 6, p. 27) × 2Degree of clod development(Fig. 7, p. 29) × 1Degree of soil erosi<strong>on</strong>(wind/water) (Fig. 8, p. 31) × 2RANKING SCORE (Sum of VS rankings)Soil Quality AssessmentRanking ScorePoor < 10Moderate 10 – 25Good > 25If your soil quality assessment is moderate or poor, guidelines for sustainable managementare given in Volume 2, Part One.PTO
SCORE CARDVisual indica<strong>to</strong>rs for assessing soil quality under <str<strong>on</strong>g>cropping</str<strong>on</strong>g>PLANT INDICATORSVisual Indica<strong>to</strong>r Visual Score (VS) Weighting VS Rankingof Soil Quality0 = Poor c<strong>on</strong>diti<strong>on</strong>1 = Moderate c<strong>on</strong>diti<strong>on</strong>2 = Good c<strong>on</strong>diti<strong>on</strong>Crop emergence(Fig. 9, p. 35) × 2Crop height at maturity(Fig. 10, p. 37) × 3Size <str<strong>on</strong>g>and</str<strong>on</strong>g> development of thecrop root system (Fig. 11, p. 39) × 2Crop yields(Fig. 12, p. 41) × 3Root diseases *(Fig. 13, p. 43) × 1Weed infestati<strong>on</strong> *(Fig. 14, p. 45) × 1Surface p<strong>on</strong>ding *(Fig. 15, p. 47) × 2Producti<strong>on</strong> costs (fertilizer,tillage, etc.) * (Fig. 16, p. 49) × 2RANKING SCORE (Sum of VS rankings)* PerceivedSoil Quality AssessmentRanking ScorePoor 25SUMMARYSOIL INDICATORSRankingscorePlant indica<strong>to</strong>rsDo the soil <str<strong>on</strong>g>and</str<strong>on</strong>g> plant scoresdiffer? If so, why?NOTES:
INSTRUCTIONS FOR ASSESSINGSOIL QUALITY UNDER CROPPINGSOIL INDICATORS
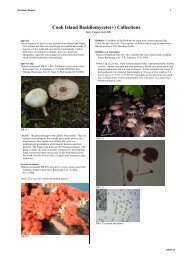
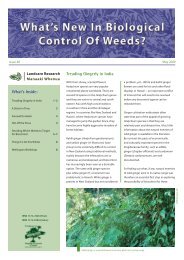
SOIL INDICATORSSoil structure <str<strong>on</strong>g>and</str<strong>on</strong>g> c<strong>on</strong>sistence under <str<strong>on</strong>g>cropping</str<strong>on</strong>g> Remove a 20 cm cube of <strong>to</strong>psoil with a spade (between traffic-free rows). Drop the soil sample a maximum of three times from a height of <strong>on</strong>e metre(waist height) <strong>on</strong><strong>to</strong> the firm base in the plastic basin. If large clods breakaway after the first or sec<strong>on</strong>d drop, drop them individually again <strong>on</strong>ce ortwice. If a clod shatters in<strong>to</strong> small (primary structural) units after the firs<strong>to</strong>r sec<strong>on</strong>d drop, it does not need dropping again. D<strong>on</strong>’t drop any piece ofsoil more than three times. Part each clod by h<str<strong>on</strong>g>and</str<strong>on</strong>g> al<strong>on</strong>g any exposed fracture planes or fissures. Transfer the soil <strong>on</strong><strong>to</strong> the large plastic bag. Move the coarsest fracti<strong>on</strong>s <strong>to</strong> <strong>on</strong>e end <str<strong>on</strong>g>and</str<strong>on</strong>g> the finest <strong>to</strong> the other end. Thisprovides a measure of the aggregate-size distributi<strong>on</strong>. Compare the resultingdistributi<strong>on</strong> of aggregates with the three pho<strong>to</strong>graphs opposite.GOOD SOIL STRUCTURE is vital for growing crops. It regulates soil aerati<strong>on</strong><str<strong>on</strong>g>and</str<strong>on</strong>g> gaseous exchange rates, the movement <str<strong>on</strong>g>and</str<strong>on</strong>g> s<strong>to</strong>rage of water, soiltemperature, root penetrati<strong>on</strong> <str<strong>on</strong>g>and</str<strong>on</strong>g> development, nutrient cycling, <str<strong>on</strong>g>and</str<strong>on</strong>g> resistance<strong>to</strong> structural degradati<strong>on</strong> <str<strong>on</strong>g>and</str<strong>on</strong>g> soil erosi<strong>on</strong>. It also promotes seed germinati<strong>on</strong><str<strong>on</strong>g>and</str<strong>on</strong>g> emergence, crop yields <str<strong>on</strong>g>and</str<strong>on</strong>g> grain quality.The effect of soil structure <strong>on</strong> crop yields is shown in Figure 16 (page 49), <str<strong>on</strong>g>and</str<strong>on</strong>g> inthe graph below. Crop & Food Research have shown that soils with structuralc<strong>on</strong>diti<strong>on</strong> scores under 5 have a high risk of yielding below the regi<strong>on</strong>al average.Soils with scores higher than 5 tend <strong>to</strong> yield at or greater than the regi<strong>on</strong>al average.Structural c<strong>on</strong>diti<strong>on</strong> scores are based <strong>on</strong>the size, porosity <str<strong>on</strong>g>and</str<strong>on</strong>g> relative140abundance of soil aggregates <str<strong>on</strong>g>and</str<strong>on</strong>g> clods.Soils with low scores have large, dense120clods or fine unaggregated particles;those with high scores have a nutty, wellaggregatedporous structure.10080Good structure also increases thewindow of opportunity <strong>to</strong> cultivate at 60the right time, <str<strong>on</strong>g>and</str<strong>on</strong>g> minimises tillage40costs in terms of trac<strong>to</strong>r hours, the2 3 4 5 6 7 8 9 10number of passes required <strong>to</strong> prepareSTRUCTURAL CONDITION SCOREa seedbed, <str<strong>on</strong>g>and</str<strong>on</strong>g> the size of the trac<strong>to</strong>rPOORGOOD<str<strong>on</strong>g>and</str<strong>on</strong>g> implements required.YIELD (% REGIONAL AVG)GRAPH SUPPLIED BY DR M.H. BEARE,CROP & FOOD RESEARCH16 VISUAL SOIL ASSESSMENT: Volume 1
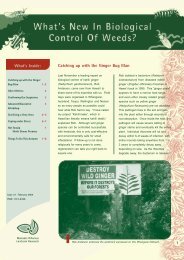
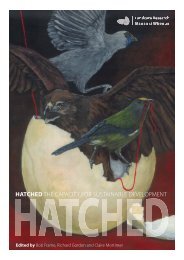
FIGURE 1: Visual scoring (VS) of soil structure <str<strong>on</strong>g>and</str<strong>on</strong>g> c<strong>on</strong>sistence under <str<strong>on</strong>g>cropping</str<strong>on</strong>g>POOR CONDITION VS = 0Soil dominated by extremely coarse, very firmclods with very few finer aggregatesMODERATE CONDITION VS = 1Soil c<strong>on</strong>tains significant proporti<strong>on</strong>s of bothcoarse firm clods <str<strong>on</strong>g>and</str<strong>on</strong>g> friable, fineaggregatesGOOD CONDITION VS = 2Good distributi<strong>on</strong> of friable fineraggregates with no significant cloddingVISUAL SOIL ASSESSMENT: Volume 117
SOIL INDICATORSSoil porosity under <str<strong>on</strong>g>cropping</str<strong>on</strong>g> Remove a spade slice of soil from the side of the hole created bytaking the 20 cm cube of <strong>to</strong>psoil, or take a number of clods from thesoil structure <str<strong>on</strong>g>and</str<strong>on</strong>g> c<strong>on</strong>sistence test. Examine the sample for soil porosity by comparing against the threepho<strong>to</strong>graphs opposite.SOIL POROSITY, <str<strong>on</strong>g>and</str<strong>on</strong>g> particularly macroporosity (the number of largepores), influences the movement of air <str<strong>on</strong>g>and</str<strong>on</strong>g> water in the soil. It isimportant <strong>to</strong> assess soil porosity as well as aggregate size distributi<strong>on</strong>.Soils with good structure have a high porosity between <str<strong>on</strong>g>and</str<strong>on</strong>g> withinaggregates, but soils with large structural units may not havemacropores <str<strong>on</strong>g>and</str<strong>on</strong>g> coarse micropores within the large clods, <str<strong>on</strong>g>and</str<strong>on</strong>g> thereforemay not be adequately aerated.18 VISUAL SOIL ASSESSMENT: Volume 1
FIGURE 2: Visual scoring (VS) of soil porosity under <str<strong>on</strong>g>cropping</str<strong>on</strong>g>POOR CONDITION VS = 0No soil macropores are visually apparentwithin compact, massive structureless clods.The clod surface is smooth with few cracks orholes, <str<strong>on</strong>g>and</str<strong>on</strong>g> can have sharp anglesMODERATE CONDITION VS = 1Soil macropores between <str<strong>on</strong>g>and</str<strong>on</strong>g> withinaggregates have declined significantly butare present <strong>on</strong> close examinati<strong>on</strong> of clodsshowing a moderate amount ofc<strong>on</strong>solidati<strong>on</strong>GOOD CONDITION VS = 2Soils have many macropores between <str<strong>on</strong>g>and</str<strong>on</strong>g>within aggregates associated with readilyapparent good soil structureVISUAL SOIL ASSESSMENT: Volume 119
SOIL INDICATORSSoil colour under <str<strong>on</strong>g>cropping</str<strong>on</strong>g> Compare the colour of a h<str<strong>on</strong>g>and</str<strong>on</strong>g>ful of soil from the soil structure testwith the soil taken from under the nearest fenceline. Using the three pho<strong>to</strong>graphs below, compare the relative change insoil colour that has occurred.As <strong>to</strong>psoil colour can vary markedly between soil types, thepho<strong>to</strong>graphs illustrate the trend rather than the absolute colour ofthe soil.SOIL COLOUR CHANGES give a general indicati<strong>on</strong> of trends in soilorganic matter levels under <str<strong>on</strong>g>cropping</str<strong>on</strong>g>. Soil organic matter plays a pivotalrole in regulating most biological, physical <str<strong>on</strong>g>and</str<strong>on</strong>g> chemical processes insoil, which collectively determine soil health. It promotes infiltrati<strong>on</strong><str<strong>on</strong>g>and</str<strong>on</strong>g> water retenti<strong>on</strong>, it helps <strong>to</strong> develop <str<strong>on</strong>g>and</str<strong>on</strong>g> stabilise soil structure <str<strong>on</strong>g>and</str<strong>on</strong>g>cushi<strong>on</strong> the impact of wheel traffic <str<strong>on</strong>g>and</str<strong>on</strong>g> cultiva<strong>to</strong>rs, <str<strong>on</strong>g>and</str<strong>on</strong>g> it reduces thepotential for wind <str<strong>on</strong>g>and</str<strong>on</strong>g> water erosi<strong>on</strong>. Organic matter is also an importantsource of, <str<strong>on</strong>g>and</str<strong>on</strong>g> major reservoir for, plant nutrients. Its decline reducesthe fertility <str<strong>on</strong>g>and</str<strong>on</strong>g> nutrient-supplying potential of the soil; nitrogen <str<strong>on</strong>g>and</str<strong>on</strong>g>phosphorus requirements for crops increase markedly, <str<strong>on</strong>g>and</str<strong>on</strong>g> other major<str<strong>on</strong>g>and</str<strong>on</strong>g> minor elements are more readily leached. The result is an increaseddependency <strong>on</strong> fertiliser input <strong>to</strong> maintain nutrient status.20 VISUAL SOIL ASSESSMENT: Volume 1
FIGURE 3: Visual scoring (VS) of soil colour under <str<strong>on</strong>g>cropping</str<strong>on</strong>g>POOR CONDITION VS = 0Soil colour has become significantly palercompared with under the fence lineMODERATE CONDITION VS = 1The colour of the <strong>to</strong>psoil is somewhatpaler than under the fence line, but notmarkedly soGOOD CONDITION VS = 2Dark coloured <strong>to</strong>psoil that is not <strong>to</strong>odissimilar <strong>to</strong> that under the fence lineVISUAL SOIL ASSESSMENT: Volume 121
SOIL INDICATORSNumber <str<strong>on</strong>g>and</str<strong>on</strong>g> colour of soil mottles under <str<strong>on</strong>g>cropping</str<strong>on</strong>g> Assess the number, size <str<strong>on</strong>g>and</str<strong>on</strong>g> colour of mottles by comparing the sideof the soil profile, or a number of soil clods from the soil structuretest, with the three pho<strong>to</strong>graphs opposite.Mottles are spots or blotches of different colour interspersed withthe dominant soil colour.The percentage chart below will help you determine the percent ofthe soil occupied by mottles.THE NUMBER, SIZE AND COLOUR of soil mottles provide a goodindicati<strong>on</strong> of how well the soil is aerated. Loss of structure reduces thenumber of macropores <str<strong>on</strong>g>and</str<strong>on</strong>g> coarse micropores that c<strong>on</strong>duct air <str<strong>on</strong>g>and</str<strong>on</strong>g> water.With the loss of pores, oxygen in the soil is reduced, <str<strong>on</strong>g>and</str<strong>on</strong>g> carb<strong>on</strong> dioxidebuilds up. As oxygen depleti<strong>on</strong> increases, orange, <str<strong>on</strong>g>and</str<strong>on</strong>g> ultimately grey,mottles form. A high proporti<strong>on</strong> of medium <str<strong>on</strong>g>and</str<strong>on</strong>g> coarse grey mottlesindicates that the soil is waterlogged <str<strong>on</strong>g>and</str<strong>on</strong>g> starved of oxygen for asignificant part of the year. Poor aerati<strong>on</strong> <str<strong>on</strong>g>and</str<strong>on</strong>g> the build-up of carb<strong>on</strong>dioxide <str<strong>on</strong>g>and</str<strong>on</strong>g> methane reduce the uptake of water by plants, <str<strong>on</strong>g>and</str<strong>on</strong>g> induceearly wilting. They can also reduce the uptake of plant nutrients,particularly nitrogen, phosphorus <str<strong>on</strong>g>and</str<strong>on</strong>g> potassium, by wheat <str<strong>on</strong>g>and</str<strong>on</strong>g> maize.Poor aerati<strong>on</strong> also retards the breakdown of stubble <str<strong>on</strong>g>and</str<strong>on</strong>g> other organicresidues, <str<strong>on</strong>g>and</str<strong>on</strong>g> can cause reacti<strong>on</strong>s that form chemicals <strong>to</strong>xic <strong>to</strong> plant roots.22 VISUAL SOIL ASSESSMENT: Volume 1
FIGURE 4: Visual scoring (VS) of number <str<strong>on</strong>g>and</str<strong>on</strong>g> colour of soil mottles under <str<strong>on</strong>g>cropping</str<strong>on</strong>g>POOR CONDITION VS = 0Soil has abundant <strong>to</strong> profuse (>50%) medium<str<strong>on</strong>g>and</str<strong>on</strong>g> coarse orange <str<strong>on</strong>g>and</str<strong>on</strong>g> particularly greymottlesMODERATE CONDITION VS = 1Soil has comm<strong>on</strong> (10–25%) fine <str<strong>on</strong>g>and</str<strong>on</strong>g> mediumorange <str<strong>on</strong>g>and</str<strong>on</strong>g> grey mottlesGOOD CONDITION VS = 2Mottles are generally absent.VISUAL SOIL ASSESSMENT: Volume 123
SOIL INDICATORSEarthworm counts under <str<strong>on</strong>g>cropping</str<strong>on</strong>g> Sort carefully through the soil sample used <strong>to</strong> assess soil structure,<str<strong>on</strong>g>and</str<strong>on</strong>g> count the earthworms found in a 5 minute search. Earthwormsvary in size <str<strong>on</strong>g>and</str<strong>on</strong>g> number depending <strong>on</strong> the seas<strong>on</strong>, so for year-<strong>to</strong>-yearcomparis<strong>on</strong> earthworm counts must be made at the same time ofyear, <str<strong>on</strong>g>and</str<strong>on</strong>g> preferably during the winter. The class limits for earthwormnumbers given opposite are based <strong>on</strong> the probability that you willfind <strong>on</strong>ly two-thirds of the worms present during a 5-minute search.(Earthworm numbers are comm<strong>on</strong>ly reported <strong>on</strong> a square-metre basis.A 20 cm cube sample is equivalent <strong>to</strong> 1/25 square metre <str<strong>on</strong>g>and</str<strong>on</strong>g> so thenumber of earthworms counted should be multiplied by 25 <strong>to</strong> c<strong>on</strong>vert<strong>to</strong> a square-metre basis. If your sample depth is <strong>on</strong>ly 0-10cm, thesame class limits <str<strong>on</strong>g>and</str<strong>on</strong>g> c<strong>on</strong>versi<strong>on</strong> fac<strong>to</strong>rs apply, because comm<strong>on</strong>earthworms are most abundant in the upper <strong>to</strong>psoil.)EARTHWORMS PLAY A MAJOR ROLE, through their burrowing, feeding<str<strong>on</strong>g>and</str<strong>on</strong>g> casting, in decomposing <str<strong>on</strong>g>and</str<strong>on</strong>g> cycling organic matter, <str<strong>on</strong>g>and</str<strong>on</strong>g> in supplyingnutrients. They can also improve soil porosity <str<strong>on</strong>g>and</str<strong>on</strong>g> aerati<strong>on</strong>, waterinfiltrati<strong>on</strong> <str<strong>on</strong>g>and</str<strong>on</strong>g> c<strong>on</strong>ductivity, aggregate size <str<strong>on</strong>g>and</str<strong>on</strong>g> stability, reduce surfacecrusting, <str<strong>on</strong>g>and</str<strong>on</strong>g> increase root growth <str<strong>on</strong>g>and</str<strong>on</strong>g> subsequent grain yield.24 VISUAL SOIL ASSESSMENT: Volume 1
FIGURE 5: Visual scoring (VS) of earthworm counts under <str<strong>on</strong>g>cropping</str<strong>on</strong>g>Visual score Earthworm counts(VS)(per 20 cm cube of soil)2 >81 4–80
SOIL INDICATORSPresence of a tillage pan under <str<strong>on</strong>g>cropping</str<strong>on</strong>g> Examine the lower part of the <strong>to</strong>psoil <str<strong>on</strong>g>and</str<strong>on</strong>g> compare with the upper<strong>to</strong>psoil. This can be d<strong>on</strong>e in situ or by removing a spade slice fromthe side of the hole exposed by removing the 20 cm cube extractedfor the structural assessment. Compare against the three pho<strong>to</strong>graphs opposite.WELL-DEVELOPED TILLAGE PANS can impede the movement of water,air <str<strong>on</strong>g>and</str<strong>on</strong>g> oxygen through the profile, increasing the susceptibility <strong>to</strong> waterlogging <str<strong>on</strong>g>and</str<strong>on</strong>g> erosi<strong>on</strong> by rilling <str<strong>on</strong>g>and</str<strong>on</strong>g> sheet wash. Well-developed tillagepans are difficult for roots <strong>to</strong> penetrate, <str<strong>on</strong>g>and</str<strong>on</strong>g> can cause roots <strong>to</strong> growsidewards, restricting vertical root growth <str<strong>on</strong>g>and</str<strong>on</strong>g> development. Thisreduces the ability of the root system <strong>to</strong> take up water <str<strong>on</strong>g>and</str<strong>on</strong>g> nutrients.26 VISUAL SOIL ASSESSMENT: Volume 1
FIGURE 6: Visual scoring (VS) of the presence of a tillage pan under <str<strong>on</strong>g>cropping</str<strong>on</strong>g>POOR CONDITION VS = 0Very firm <strong>to</strong> hard, well-developed tillagepan in the lower <strong>to</strong>psoil, showing severec<strong>on</strong>solidati<strong>on</strong> with no structure, nomacropores <str<strong>on</strong>g>and</str<strong>on</strong>g> few or no cracksMODERATE CONDITION VS = 1Firm, moderately developed tillage pan inthe lower <strong>to</strong>psoil showing clear z<strong>on</strong>es ofc<strong>on</strong>solidati<strong>on</strong> but including areas withweakly developed structure, cracks,fissures <str<strong>on</strong>g>and</str<strong>on</strong>g> a few macroporesGOOD CONDITION VS = 2No tillage pan with a friable, clearlyapparent structure <str<strong>on</strong>g>and</str<strong>on</strong>g> soil poresthroughout the <strong>to</strong>psoilVISUAL SOIL ASSESSMENT: Volume 127
SOIL INDICATORSDegree of clod development under <str<strong>on</strong>g>cropping</str<strong>on</strong>g> Assess the degree of clodding <strong>on</strong> the soil surface between rows bycomparing it against the three pho<strong>to</strong>graphs opposite. C<strong>on</strong>sider also the amount of tillage <str<strong>on</strong>g>and</str<strong>on</strong>g> time that was required <strong>to</strong>prepare the seedbed. Some soil clods may slake during rainfall so, <strong>to</strong>be meaningful, several assessments should be made up <strong>to</strong> cropmaturity.THE DEGREE OF CLODDING depends <strong>on</strong> many fac<strong>to</strong>rs, includingrecent tillage, water c<strong>on</strong>tent at the time of tillage, the shear strengthof clods <str<strong>on</strong>g>and</str<strong>on</strong>g> the quality of the soil structure. The loss of soil structure<str<strong>on</strong>g>and</str<strong>on</strong>g> the subsequent formati<strong>on</strong> of clods reduce the quality of the soiltilth, impair seed germinati<strong>on</strong> <str<strong>on</strong>g>and</str<strong>on</strong>g> emergence, <str<strong>on</strong>g>and</str<strong>on</strong>g> reduce crop yields<str<strong>on</strong>g>and</str<strong>on</strong>g> grain quality. Very cloddy soils indicate that the soil has become sodegraded that it cannot maintain a fine aggregated seedbed throughoutthe growing seas<strong>on</strong>. The size, density, <str<strong>on</strong>g>and</str<strong>on</strong>g> strength of soil clods increasewith increasing loss of soil structure, so careful timing <str<strong>on</strong>g>and</str<strong>on</strong>g> c<strong>on</strong>siderableadditi<strong>on</strong>al energy is needed <strong>to</strong> break them down <strong>to</strong> the requiredseedbed. This usually means that more intensive methods of cultivati<strong>on</strong><str<strong>on</strong>g>and</str<strong>on</strong>g> a greater number of passes are needed.28 VISUAL SOIL ASSESSMENT: Volume 1
FIGURE 7: Visual scoring (VS) of the degree of clod development under <str<strong>on</strong>g>cropping</str<strong>on</strong>g>POOR CONDITION VS = 0Soil dominated by coarse, very firm clodswith fewer finer aggregates. Clod resistanceis high <str<strong>on</strong>g>and</str<strong>on</strong>g> the window for cultivati<strong>on</strong> isvery narrowMODERATE CONDITION VS = 1Soil c<strong>on</strong>tains significant proporti<strong>on</strong>s ofboth coarse firm clods <str<strong>on</strong>g>and</str<strong>on</strong>g> friable, fineaggregates. If cultivati<strong>on</strong> is not carefullytimed, clods show significant tillageresistanceGOOD CONDITION VS = 2Good distributi<strong>on</strong> of the friable, fineraggregates with no significant clodding. Agood seedbed is readily preparedVISUAL SOIL ASSESSMENT: Volume 129
SOIL INDICATORSSusceptibility <strong>to</strong> wind <str<strong>on</strong>g>and</str<strong>on</strong>g> water erosi<strong>on</strong> under <str<strong>on</strong>g>cropping</str<strong>on</strong>g> Assess, based <strong>on</strong> your knowledge of the area or visual observati<strong>on</strong>sduring the seas<strong>on</strong>, whether the amount of wind erosi<strong>on</strong> during <str<strong>on</strong>g>and</str<strong>on</strong>g>after cultivati<strong>on</strong> has become a c<strong>on</strong>cern. Take in<strong>to</strong> account the size of the dust plume or clouds raised bycultivati<strong>on</strong>, <str<strong>on</strong>g>and</str<strong>on</strong>g> whether the material stays within the paddock,within the farm, or is blown in<strong>to</strong> the surrounding district (seeopposite). Determine the severity of water erosi<strong>on</strong> by augering or digging holes<strong>to</strong> compare the difference in <strong>to</strong>psoil depths between the crest <str<strong>on</strong>g>and</str<strong>on</strong>g>footslope, <str<strong>on</strong>g>and</str<strong>on</strong>g> by observing the amount of rill <str<strong>on</strong>g>and</str<strong>on</strong>g> sheet erosi<strong>on</strong>,<str<strong>on</strong>g>and</str<strong>on</strong>g> sedimentati<strong>on</strong> in<strong>to</strong> adjacent drains <str<strong>on</strong>g>and</str<strong>on</strong>g> streams.THE SUSCEPTIBILITY OF A SOIL TO WIND EROSION depends <strong>on</strong>fac<strong>to</strong>rs including soil moisture, <str<strong>on</strong>g>and</str<strong>on</strong>g> wind velocity, surface roughness<str<strong>on</strong>g>and</str<strong>on</strong>g> particle size. Soils that have low amounts of organic matter <str<strong>on</strong>g>and</str<strong>on</strong>g>have lost their soil structure through compacti<strong>on</strong> <str<strong>on</strong>g>and</str<strong>on</strong>g> over-cultivati<strong>on</strong>are pulverised <strong>to</strong> dust <strong>on</strong> further cultivati<strong>on</strong>, making them vulnerable<strong>to</strong> wind erosi<strong>on</strong> if unprotected. Wind erosi<strong>on</strong> reduces the productivepotential of soils through nutrient losses, lower available water-holdingcapacity, <str<strong>on</strong>g>and</str<strong>on</strong>g> reduced rooting volume <str<strong>on</strong>g>and</str<strong>on</strong>g> depth. Research has shownthat an extra 25 mm of water s<strong>to</strong>red in the soil has the potential <strong>to</strong>increase maize yields by approximately 600 kg/ha. Wind-blown materialdeposited after a str<strong>on</strong>g north-westerly wind in north Canterbury hasbeen shown <strong>to</strong> c<strong>on</strong>tain high levels of Ca, K, Mg, <str<strong>on</strong>g>and</str<strong>on</strong>g> N. Available Plevels present were equivalent <strong>to</strong> a loss of 73 kg of superphosphateper hectare. The water erodibility of soil <strong>on</strong> sloping ground is governedby fac<strong>to</strong>rs including the amount <str<strong>on</strong>g>and</str<strong>on</strong>g> intensity of rainfall, <str<strong>on</strong>g>and</str<strong>on</strong>g> the soilinfiltrati<strong>on</strong> rate <str<strong>on</strong>g>and</str<strong>on</strong>g> permeability. The latter two are governed by soilstructure.30 VISUAL SOIL ASSESSMENT: Volume 1
FIGURE 8: Visual scoring (VS) of susceptibility <strong>to</strong> wind & water erosi<strong>on</strong> under <str<strong>on</strong>g>cropping</str<strong>on</strong>g>GOOD CONDITION VS = 2Wind erosi<strong>on</strong> is not a c<strong>on</strong>cern:<strong>on</strong>ly small dust plumesemanate from the cultiva<strong>to</strong>r<strong>on</strong> windy days. Most winderodedmaterial is c<strong>on</strong>tainedwithin the paddock. Watererosi<strong>on</strong> is not a c<strong>on</strong>cern asthere is <strong>on</strong>ly a little rill <str<strong>on</strong>g>and</str<strong>on</strong>g>sheet erosi<strong>on</strong>. Topsoil depthsin footslope areas are
32 VISUAL SOIL ASSESSMENT: Volume 1
INSTRUCTIONS FOR ASSESSINGSOIL QUALITY UNDER CROPPINGPLANT INDICATORSVISUAL SOIL ASSESSMENT: Volume 133
PLANT INDICATORSCrop emergence Assess the degree <str<strong>on</strong>g>and</str<strong>on</strong>g> uniformity of crop emergence within a m<strong>on</strong>thof sowing by comparing the number <str<strong>on</strong>g>and</str<strong>on</strong>g> height of established plantswith the three pho<strong>to</strong>graphs provided.GOOD SEED GERMINATION AND PLANT EMERGENCE depend <strong>on</strong>fac<strong>to</strong>rs that include the quality of soil tilth at the time of sowing <str<strong>on</strong>g>and</str<strong>on</strong>g>during the weeks immediately following. Soils that have poor structurethrough compacti<strong>on</strong> <str<strong>on</strong>g>and</str<strong>on</strong>g> over-cultivati<strong>on</strong> can resettle <str<strong>on</strong>g>and</str<strong>on</strong>g> c<strong>on</strong>solidaterapidly after the seed bed has been prepared. Impeded water <str<strong>on</strong>g>and</str<strong>on</strong>g> airmovement through the soil can give rise <strong>to</strong> small areas low in oxygen(anoxic z<strong>on</strong>es). These produce chemical <str<strong>on</strong>g>and</str<strong>on</strong>g> biochemical reducti<strong>on</strong>reacti<strong>on</strong>s, the by-products of which are <strong>to</strong>xic <strong>to</strong> plants. These anoxicz<strong>on</strong>es <str<strong>on</strong>g>and</str<strong>on</strong>g> poor soil aerati<strong>on</strong> reduce seed germinati<strong>on</strong> <str<strong>on</strong>g>and</str<strong>on</strong>g> plantemergence. As a result, bare patches <str<strong>on</strong>g>and</str<strong>on</strong>g> poor <str<strong>on</strong>g>and</str<strong>on</strong>g> uneven early growthare comm<strong>on</strong>ly observed throughout paddocks that have poor soilstructure. Young plants can also show off-colouring of leaves <str<strong>on</strong>g>and</str<strong>on</strong>g>moisture stress.The loss of soil structure can reduce crop establishment of barley from315 <strong>to</strong> 131 plants/m 2 , <str<strong>on</strong>g>and</str<strong>on</strong>g> grain yields from 6.7 <strong>to</strong> 3.9 t/ha. Corngerminati<strong>on</strong> slows, <str<strong>on</strong>g>and</str<strong>on</strong>g> plant populati<strong>on</strong>s also decrease. Seedlingmortality of winter cereals can be high if the soil is waterlogged formore than 3 <strong>to</strong> 4 days between germinati<strong>on</strong> <str<strong>on</strong>g>and</str<strong>on</strong>g> emergence.34 VISUAL SOIL ASSESSMENT: Volume 1
FIGURE 9: Visual scoring (VS) of crop emergence under <str<strong>on</strong>g>cropping</str<strong>on</strong>g>GOOD CONDITION VS = 2Good emergence <str<strong>on</strong>g>and</str<strong>on</strong>g> plantestablishment, with fewgaps al<strong>on</strong>g the plantingrow <str<strong>on</strong>g>and</str<strong>on</strong>g> crop showing aneven heightMODERATE CONDITIONVS = 1Moderate emergence <str<strong>on</strong>g>and</str<strong>on</strong>g>plant establishment, with asignificant number of gapsal<strong>on</strong>g the planting row <str<strong>on</strong>g>and</str<strong>on</strong>g>a significant variati<strong>on</strong> inseedling heightPOOR CONDITION VS = 0Poor emergence <str<strong>on</strong>g>and</str<strong>on</strong>g> plantestablishment, with a largenumber of gaps al<strong>on</strong>g theplanting row <str<strong>on</strong>g>and</str<strong>on</strong>g> a largevariati<strong>on</strong> in seedling heightVISUAL SOIL ASSESSMENT: Volume 135
PLANT INDICATORSCrop height at maturity Measure crop height <str<strong>on</strong>g>and</str<strong>on</strong>g> height variability when the crop has reachedmaturity. Your observati<strong>on</strong>s of crop growth <str<strong>on</strong>g>and</str<strong>on</strong>g> vigour during thegrowing seas<strong>on</strong> may also provide a useful indicati<strong>on</strong> of seedbedc<strong>on</strong>diti<strong>on</strong>. In a good seas<strong>on</strong>, under n<strong>on</strong>-limiting c<strong>on</strong>diti<strong>on</strong>s, a cultivarshould grow <strong>to</strong> a particular height, with about a 10–15% variati<strong>on</strong>.Allowances should be made for excepti<strong>on</strong>ally good seas<strong>on</strong>s <str<strong>on</strong>g>and</str<strong>on</strong>g> forpoor seas<strong>on</strong>s.ALTHOUGH IT DEPENDS ON CLIMATIC FACTORS, the cultivar, soilfertility <str<strong>on</strong>g>and</str<strong>on</strong>g> time of sowing, crop height <str<strong>on</strong>g>and</str<strong>on</strong>g> variability in crop height atmaturity can be useful visual indica<strong>to</strong>rs of soil quality. This is particularlyuseful if agr<strong>on</strong>omic fac<strong>to</strong>rs have not limited crop emergence <str<strong>on</strong>g>and</str<strong>on</strong>g>development during the growing seas<strong>on</strong>. The growth <str<strong>on</strong>g>and</str<strong>on</strong>g> vigour ofgrain crops depend in part <strong>on</strong> the ability of the seedbed <strong>to</strong> maintain anadequate soil tilth throughout the growing seas<strong>on</strong>. Poor soil aerati<strong>on</strong><str<strong>on</strong>g>and</str<strong>on</strong>g> resistance <strong>to</strong> root penetrati<strong>on</strong> as a result of structural degradati<strong>on</strong>reduce plant growth <str<strong>on</strong>g>and</str<strong>on</strong>g> vigour, <str<strong>on</strong>g>and</str<strong>on</strong>g> delay maturity.36 VISUAL SOIL ASSESSMENT: Volume 1
FIGURE 10: Visual scoring (VS) of crop height at maturity under <str<strong>on</strong>g>cropping</str<strong>on</strong>g>POOR CONDITION VS = 0Crop heights are very uneven <str<strong>on</strong>g>and</str<strong>on</strong>g> patchy<str<strong>on</strong>g>and</str<strong>on</strong>g> well below maximum height at cropmaturity. Crop height for maize, forexample, is generally between 1.2–1.7 m atmaturity (chest height).MODERATE CONDITION VS = 1Crop heights are significantly belowmaximum <str<strong>on</strong>g>and</str<strong>on</strong>g> show moderate variability inheight at crop maturity. Crop height formaize, for example, is generally between1.8–2.2 m at maturityGOOD CONDITION VS = 2Crops are at or near maximum height,with little variability in height at cropmaturity. Maize crops, for example, aregenerally between 2.3–2.7 m at maturityVISUAL SOIL ASSESSMENT: Volume 137
PLANT INDICATORSThe size <str<strong>on</strong>g>and</str<strong>on</strong>g> development of the crop root system Determine size <str<strong>on</strong>g>and</str<strong>on</strong>g> development of the root system, ideally at plantmaturity, by carefully prizing the plant out of the soil <str<strong>on</strong>g>and</str<strong>on</strong>g> gentlyshaking it <strong>to</strong> remove adhering soil from the roots. Compare the rootsystem against the three pho<strong>to</strong>graphs opposite.CONSOLIDATION AND COMPACTION of the seedbed restrict plantgrowth <str<strong>on</strong>g>and</str<strong>on</strong>g> vigour by restricting root development (rooting depth <str<strong>on</strong>g>and</str<strong>on</strong>g>root density), owing <strong>to</strong> increased mechanical resistance <str<strong>on</strong>g>and</str<strong>on</strong>g> impededsoil aerati<strong>on</strong>. High mechanical resistance <strong>to</strong> roots limits plant uptake ofwater <str<strong>on</strong>g>and</str<strong>on</strong>g> nutrients, restricts the producti<strong>on</strong> of several plant horm<strong>on</strong>esin roots necessary for growth, <str<strong>on</strong>g>and</str<strong>on</strong>g> increases the susceptibility of thecrop <strong>to</strong> windthrow.38 VISUAL SOIL ASSESSMENT: Volume 1
FIGURE 11: Visual scoring (VS) of size & development of crop root system under <str<strong>on</strong>g>cropping</str<strong>on</strong>g>POOR CONDITION VS = 0Vertical <str<strong>on</strong>g>and</str<strong>on</strong>g> lateral root development isseverely restricted, with root systemsshowing either right-angle syndrome, overthickening,or growth down coulter channelsMODERATE CONDITION VS = 1The main root bulb is comm<strong>on</strong>ly 15 cm wide<str<strong>on</strong>g>and</str<strong>on</strong>g> 15–18 cm deep. Vertical rootdevelopment is often restricted below 12cm with right-angle syndrome notuncomm<strong>on</strong>GOOD CONDITION VS = 2Unrestricted root development with themain large root bulb up <strong>to</strong> 25 cm wide<str<strong>on</strong>g>and</str<strong>on</strong>g> 20–25 cm deepVISUAL SOIL ASSESSMENT: Volume 139
PLANT INDICATORSCrop yield Assess relative crop yield.In a maize crop, for example, strip a number of cobs at r<str<strong>on</strong>g>and</str<strong>on</strong>g>om atcrop maturity <str<strong>on</strong>g>and</str<strong>on</strong>g> compare cob size <str<strong>on</strong>g>and</str<strong>on</strong>g> characteristics against thethree pho<strong>to</strong>graphs opposite. Similar comparative assessments canbe made for wheat, barley, peas <str<strong>on</strong>g>and</str<strong>on</strong>g> other crops. Estimate heads orpods per square metre, grains or seeds per head or pod, <str<strong>on</strong>g>and</str<strong>on</strong>g> size ofgrains or seeds. Compare these with an ‘ideal’ crop.WITH A DECLINE IN SOIL QUALITY, crops can come under stress fromdrought, poor aerati<strong>on</strong>, lack of nutrients <str<strong>on</strong>g>and</str<strong>on</strong>g> adverse temperatures.Toxic chemicals build up, <str<strong>on</strong>g>and</str<strong>on</strong>g> root growth can be mechanically impeded.This results in poor germinati<strong>on</strong> <str<strong>on</strong>g>and</str<strong>on</strong>g> emergence, poor plant growth<str<strong>on</strong>g>and</str<strong>on</strong>g> vigour, the need <strong>to</strong> resow, delays in sowing, root diseases, pestattack, <str<strong>on</strong>g>and</str<strong>on</strong>g> c<strong>on</strong>sequently lower crop yields. Plant stress induced bystructural degradati<strong>on</strong> can also affect the quality of grain by changingthe amount <str<strong>on</strong>g>and</str<strong>on</strong>g> type of protein <str<strong>on</strong>g>and</str<strong>on</strong>g> starch formed, <str<strong>on</strong>g>and</str<strong>on</strong>g> the enzymicpotential. These affect the amount of fermentable carbohydrate <str<strong>on</strong>g>and</str<strong>on</strong>g>the malting potential of barley, <str<strong>on</strong>g>and</str<strong>on</strong>g> the baking quality of wheat.40 VISUAL SOIL ASSESSMENT: Volume 1
FIGURE 12: Visual scoring (VS) of crop yield under <str<strong>on</strong>g>cropping</str<strong>on</strong>g>GOODCONDITIONVS = 2Maize cobs are large,with complete grainfilling, <str<strong>on</strong>g>and</str<strong>on</strong>g> fewmoisture stressfeatures areapparent. Cobs oftenvary from 18–22 cmin lengthMODERATECONDITIONVS = 1Maize cobs are ofmedium size, oftenvarying in lengthfrom 15–18 cm. Cobsmay show occasi<strong>on</strong>alincomplete grainfilling, <str<strong>on</strong>g>and</str<strong>on</strong>g> stressfeatures are oftenapparentPOORCONDITIONVS = 0Maize cobs aregenerally smallvarying in lengthfrom 10–15 cm. Grainfilling is invariablyincomplete <str<strong>on</strong>g>and</str<strong>on</strong>g>stress features arevery comm<strong>on</strong>VISUAL SOIL ASSESSMENT: Volume 141
PLANT INDICATORSRoot diseases Assess the prevalence of root diseases by pulling a number of stemsout of the soil <str<strong>on</strong>g>and</str<strong>on</strong>g> carefully examining the root system at, or anytime before, crop maturity.C<strong>on</strong>sider how comm<strong>on</strong>ly root diseases occur in a particular paddockfrom seas<strong>on</strong> <strong>to</strong> seas<strong>on</strong> (see table opposite).POOR SOIL AERATION, high levels of soil saturati<strong>on</strong>, <str<strong>on</strong>g>and</str<strong>on</strong>g> highmechanical resistance <strong>to</strong> root development due <strong>to</strong> soil structuraldegradati<strong>on</strong> can increase root rot <str<strong>on</strong>g>and</str<strong>on</strong>g> soil-borne pathogens. They canalso reduce the ability of root systems <strong>to</strong> overcome the harmful effectsof pathogens resident in the <strong>to</strong>psoil. Plant diseases encouraged bydegradati<strong>on</strong> of soil structure include Fusarium, Pythium, Phy<strong>to</strong>phthora,Rhizoct<strong>on</strong>ia, Take-all <str<strong>on</strong>g>and</str<strong>on</strong>g> vesicular-arbuscular mycorrhizal fungi.42 VISUAL SOIL ASSESSMENT: Volume 1
FIGURE 13: Visual scoring (VS) of root diseases under <str<strong>on</strong>g>cropping</str<strong>on</strong>g>Visual score (VS) Occurrence of root diseasesdue <strong>to</strong> soil qualities2 Root diseases are rare1 Root diseases are comm<strong>on</strong>0 Root diseases are very comm<strong>on</strong>VISUAL SOIL ASSESSMENT: Volume 143
PLANT INDICATORSWeed infestati<strong>on</strong> Assess the degree of weed infestati<strong>on</strong> by visually estimating thenumber of weeds between rows at crop maturity according <strong>to</strong> thetable opposite. C<strong>on</strong>sider how often a given level of weed infestati<strong>on</strong>occurs in the paddock from seas<strong>on</strong> <strong>to</strong> seas<strong>on</strong>, <str<strong>on</strong>g>and</str<strong>on</strong>g> at what level it isperceived <strong>to</strong> be a problem.THE QUALITY OF THE SEEDBED <str<strong>on</strong>g>and</str<strong>on</strong>g> the use <str<strong>on</strong>g>and</str<strong>on</strong>g> timing of herbicidesprays influence the level of weed infestati<strong>on</strong>. Soil structural degradati<strong>on</strong>reduces soil aerati<strong>on</strong> <str<strong>on</strong>g>and</str<strong>on</strong>g> the rooting potential of the crop, allowingmore vigorous weeds <strong>to</strong> establish <str<strong>on</strong>g>and</str<strong>on</strong>g> compete with the crop. A highweed populati<strong>on</strong> uses a lot of the soil moisture <str<strong>on</strong>g>and</str<strong>on</strong>g> nutrients otherwiseavailable <strong>to</strong> the crop. In extreme cases, weeds can shade out the crop.44 VISUAL SOIL ASSESSMENT: Volume 1
FIGURE 14: Visual scoring (VS) of weed infestati<strong>on</strong> under <str<strong>on</strong>g>cropping</str<strong>on</strong>g>Visual score(VS)Degree of weed infestati<strong>on</strong>2 Weeds are not comm<strong>on</strong> in most seas<strong>on</strong>s<str<strong>on</strong>g>and</str<strong>on</strong>g> are not c<strong>on</strong>sidered <strong>to</strong> be a problem1 Weeds are comm<strong>on</strong> in most seas<strong>on</strong>s <str<strong>on</strong>g>and</str<strong>on</strong>g>are a moderate problem0 Weeds are very comm<strong>on</strong> in most seas<strong>on</strong>s<str<strong>on</strong>g>and</str<strong>on</strong>g> are a serious problemVISUAL SOIL ASSESSMENT: Volume 145
PLANT INDICATORSSurface p<strong>on</strong>ding under <str<strong>on</strong>g>cropping</str<strong>on</strong>g> Assess the degree of surface p<strong>on</strong>ding.Base your assessment <strong>on</strong> p<strong>on</strong>ding present at the time, or your generalrecollecti<strong>on</strong> of the time p<strong>on</strong>ded water <strong>to</strong>ok <strong>to</strong> disappear after a wetperiod, or after heavy rainfall in the winter (see opposite).THE LENGTH OF TIME WATER REMAINS PONDED <strong>on</strong> the surfaceindicates the rate of infiltrati<strong>on</strong> in<strong>to</strong> the soil, <str<strong>on</strong>g>and</str<strong>on</strong>g> the time the soil remainssaturated. Prol<strong>on</strong>ged waterlogging depletes oxygen <str<strong>on</strong>g>and</str<strong>on</strong>g> causes carb<strong>on</strong>dioxide <strong>to</strong> build up. Anaerobic c<strong>on</strong>diti<strong>on</strong>s develop <str<strong>on</strong>g>and</str<strong>on</strong>g> induce a seriesof chemical <str<strong>on</strong>g>and</str<strong>on</strong>g> biochemical reducti<strong>on</strong> reacti<strong>on</strong>s that produce byproducts<strong>to</strong>xic <strong>to</strong> plant roots. These include hydrogen sulphide <str<strong>on</strong>g>and</str<strong>on</strong>g>ferrous sulphide produced by the reducti<strong>on</strong> of sulphate <str<strong>on</strong>g>and</str<strong>on</strong>g> ir<strong>on</strong>, <str<strong>on</strong>g>and</str<strong>on</strong>g>nitrite produced by denitrificati<strong>on</strong>. Organic substances can alsoanaerobically degrade in degraded soils, the most <strong>to</strong>xic by-products ofwhich include ethylene, <str<strong>on</strong>g>and</str<strong>on</strong>g> acetic, butyric, <str<strong>on</strong>g>and</str<strong>on</strong>g> phenolic acids. In aword, the soil goes ‘sour’. Waterlogging delays cultivati<strong>on</strong> because thelow load-bearing capacities of the soil increase its susceptibility <strong>to</strong>damage through deformati<strong>on</strong> <str<strong>on</strong>g>and</str<strong>on</strong>g> excessive wheel slip. Sowing is alsodelayed because the seedbed is below the critical temperature for cropgerminati<strong>on</strong>.46 VISUAL SOIL ASSESSMENT: Volume 1
FIGURE 15: Visual scoring (VS) of surface p<strong>on</strong>ding under <str<strong>on</strong>g>cropping</str<strong>on</strong>g>GOODCONDITIONVS = 2No evidence ofsurface p<strong>on</strong>ding after1 day following heavyrainfall <strong>on</strong> soils thatwere already at ornear saturati<strong>on</strong>MODERATECONDITIONVS = 1Moderate surfacep<strong>on</strong>ding can occurup <strong>to</strong> 3 days afterheavy rainfall <strong>on</strong> soilsthat were already a<strong>to</strong>r close <strong>to</strong> saturati<strong>on</strong>POORCONDITIONVS = 0Significant surfacep<strong>on</strong>ding can occurfor l<strong>on</strong>ger than 3days after heavyrainfall <strong>on</strong> soils thatwere already at orclose <strong>to</strong> saturati<strong>on</strong>VISUAL SOIL ASSESSMENT: Volume 147
PLANT INDICATORSProducti<strong>on</strong> costs Assess whether producti<strong>on</strong> costs have increased because of increasedtillage <str<strong>on</strong>g>and</str<strong>on</strong>g> fertiliser requirements over the years (see opposite). Theassessment can be based <strong>on</strong> your broad percepti<strong>on</strong>s (‘gut feeling’),but reference <strong>to</strong> annual balance sheets will probably give a moreprecise answer.TILLAGE AND FERTILISER INPUTS account for some of the highestcosts in any <str<strong>on</strong>g>cropping</str<strong>on</strong>g> operati<strong>on</strong>, <str<strong>on</strong>g>and</str<strong>on</strong>g> can increase significantly withincreasing soil degradati<strong>on</strong>. As degradati<strong>on</strong> increases, the density <str<strong>on</strong>g>and</str<strong>on</strong>g>strength of the soil increases <str<strong>on</strong>g>and</str<strong>on</strong>g>, as a result, the soil becomes moreresistant <strong>to</strong> tillage forces. Plough resistance increases so that largertrac<strong>to</strong>rs are required <strong>to</strong> avoid excessive wheel slip <str<strong>on</strong>g>and</str<strong>on</strong>g> the need <strong>to</strong>operate at slow ground speeds in a lower gear. The size, density, <str<strong>on</strong>g>and</str<strong>on</strong>g>strength of soil clods also increase with increasing loss of soil structure,<str<strong>on</strong>g>and</str<strong>on</strong>g> careful timing <str<strong>on</strong>g>and</str<strong>on</strong>g> additi<strong>on</strong>al energy is needed <strong>to</strong> break them down<strong>to</strong> a seedbed. This energy is generally applied by using more intensivemethods of cultivati<strong>on</strong> <str<strong>on</strong>g>and</str<strong>on</strong>g> by making a greater number of passes. As aresult, tillage costs can increase by over 300 percent.C<strong>on</strong>tinuous <str<strong>on</strong>g>cropping</str<strong>on</strong>g> using c<strong>on</strong>venti<strong>on</strong>al cultivati<strong>on</strong> techniques can giverise <strong>to</strong> a significant loss of organic matter <str<strong>on</strong>g>and</str<strong>on</strong>g>, as a result, cansubstantially reduce soil fertility <str<strong>on</strong>g>and</str<strong>on</strong>g> the ability of the soil <strong>to</strong> supplynutrients. Soil organic matter provides <str<strong>on</strong>g>and</str<strong>on</strong>g> s<strong>to</strong>res significant amountsof several plant nutrients. High amounts of fertiliser are needed <strong>to</strong>compensate for the loss of these nutrients.Reducti<strong>on</strong>s in crop yield are often not recognised as the result of thedegradati<strong>on</strong> of soil structure. Growers often assume that plant nutriti<strong>on</strong>is at fault <str<strong>on</strong>g>and</str<strong>on</strong>g> increase their producti<strong>on</strong> costs by applying extra fertiliser.48 VISUAL SOIL ASSESSMENT: Volume 1
FIGURE 16: Visual scoring (VS) of producti<strong>on</strong> costs3000Gross receipts(crop yield paid Wt)Gross profitmarginPoor germinati<strong>on</strong>Poor plant growth <str<strong>on</strong>g>and</str<strong>on</strong>g> vigourLow grain qualitySoil erosi<strong>on</strong>Fungi infestati<strong>on</strong>Gross profitmargin2000Producti<strong>on</strong> costsPreparati<strong>on</strong> of seedbedIncreased tillage costsIncreased fertiliser costsResowingUneven ripening rates$/HASeed cost <str<strong>on</strong>g>and</str<strong>on</strong>g> sowing1000FertiliserSprayingHarvestingCartageDryingAdministrati<strong>on</strong>FinanceRatesRent/mortgageSoil structure degradati<strong>on</strong>Visual score Producti<strong>on</strong> costs(VS)2 Tillage <str<strong>on</strong>g>and</str<strong>on</strong>g> fertiliser requirements have notincreased significantly1 Tillage <str<strong>on</strong>g>and</str<strong>on</strong>g> fertiliser requirements haveincreased moderately0 Tillage <str<strong>on</strong>g>and</str<strong>on</strong>g> fertiliser requirements haveincreased greatlyEc<strong>on</strong>omic impact becomes more severe as soil structure declines (see figureabove). As an example, maize grown for grain <strong>on</strong> well-structured soil gavegross margins in excess of $1100/ha by maintaining producti<strong>on</strong> costs below$2000/ha, <str<strong>on</strong>g>and</str<strong>on</strong>g> sustaining yields above 12t/ha. On degraded soils, producti<strong>on</strong>costs were significantly higher, <str<strong>on</strong>g>and</str<strong>on</strong>g> yields of 7–8 t/ha were just sufficient <strong>to</strong>break even. Gross receipts are reduced by the effects of soil erosi<strong>on</strong>, poorgerminati<strong>on</strong> <str<strong>on</strong>g>and</str<strong>on</strong>g> emergence, poor <str<strong>on</strong>g>and</str<strong>on</strong>g> patchy plant growth <str<strong>on</strong>g>and</str<strong>on</strong>g> vigour,root diseases, <str<strong>on</strong>g>and</str<strong>on</strong>g> poor grain quality. Producti<strong>on</strong> costs, <strong>on</strong> the other h<str<strong>on</strong>g>and</str<strong>on</strong>g>,escalate through increased tillage <str<strong>on</strong>g>and</str<strong>on</strong>g> fertiliser requirements, resowing,<str<strong>on</strong>g>and</str<strong>on</strong>g> uneven ripening rates. As a result, gross profit margins can decreaserapidly as yields drop <str<strong>on</strong>g>and</str<strong>on</strong>g> producti<strong>on</strong> costs rise c<strong>on</strong>currently.VISUAL SOIL ASSESSMENT: Volume 149
50 VISUAL SOIL ASSESSMENT: Volume 1
VISUAL SOILASSESSMENTPART TWOOf soil quality under <str<strong>on</strong>g>pas<strong>to</strong>ral</str<strong>on</strong>g> <str<strong>on</strong>g>grazing</str<strong>on</strong>g><strong>on</strong> <strong>flat</strong> <strong>to</strong> <strong>rolling</strong> <strong>country</strong>
SCORE CARDVisual indica<strong>to</strong>rs for assessing soil qualityunder <str<strong>on</strong>g>pas<strong>to</strong>ral</str<strong>on</strong>g> <str<strong>on</strong>g>grazing</str<strong>on</strong>g> <strong>on</strong> <strong>flat</strong> <strong>to</strong> <strong>rolling</strong> <strong>country</strong>SOIL INDICATORSL<str<strong>on</strong>g>and</str<strong>on</strong>g> use:Site locati<strong>on</strong>/Paddock name:Date:Soil type:Textural qualifier: S<str<strong>on</strong>g>and</str<strong>on</strong>g>y Loamy ClayeyMoisture c<strong>on</strong>diti<strong>on</strong>: Dry Slightly moist Moist WetSeas<strong>on</strong>al weatherc<strong>on</strong>diti<strong>on</strong>s:Dry Wet Cold Warm AverageVisual Indica<strong>to</strong>r Visual Score (VS) Weighting VS Rankingof Soil Quality0 = Poor c<strong>on</strong>diti<strong>on</strong>1 = Moderate c<strong>on</strong>diti<strong>on</strong>2 = Good c<strong>on</strong>diti<strong>on</strong>Soil structure & c<strong>on</strong>sistence(Fig. 1, p.57) × 3Soil porosity(Fig. 2, p.59) × 3Soil colour(Fig. 3, p.61) × 2Number <str<strong>on</strong>g>and</str<strong>on</strong>g> colour of soilmottles (Fig. 4, p.63) × 2Earthworm counts(Fig. 5, p. 65) × 3Surface relief(Fig. 6, p. 67) × 1RANKING SCORE (Sum of VS rankings)Soil Quality AssessmentRanking ScorePoor < 10Moderate 10 – 20Good > 20If your soil quality assessment is moderate or poor, guidelines for sustainable managementare given in Volume 2, Part Two.PTO
SCORE CARDVisual indica<strong>to</strong>rs for ranking soil qualityunder <str<strong>on</strong>g>pas<strong>to</strong>ral</str<strong>on</strong>g> <str<strong>on</strong>g>grazing</str<strong>on</strong>g> <strong>on</strong> <strong>flat</strong> <strong>to</strong> <strong>rolling</strong> <strong>country</strong>PLANT INDICATORSVisual Indica<strong>to</strong>r Visual Score (VS) Weighting VS Rankingof Soil Quality0 = Poor c<strong>on</strong>diti<strong>on</strong>1 = Moderate c<strong>on</strong>diti<strong>on</strong>2 = Good c<strong>on</strong>diti<strong>on</strong>Pasture compositi<strong>on</strong>(Fig. 7, p. 71) × 3Pasture growth <str<strong>on</strong>g>and</str<strong>on</strong>g> regrowthrates* (Fig. 8, p. 73) × 3Pasture utilisati<strong>on</strong>*(Fig. 9, p. 75) × 2Area of bare ground(Fig. 10, p. 77) × 2Drought stress(Fig. 11, p. 79) × 1Surface p<strong>on</strong>ding(Fig. 12, p. 81) × 2S<strong>to</strong>ck carrying capacity <str<strong>on</strong>g>and</str<strong>on</strong>g>fertiliser use* (Fig. 13, p. 83) × 2RANKING SCORE (Sum of VS Rankings)* PerceivedSoil Quality AssessmentRanking ScorePoor 20SUMMARYSOIL INDICATORSRankingscorePlant indica<strong>to</strong>rsDo the soil <str<strong>on</strong>g>and</str<strong>on</strong>g> plant scoresdiffer? If so, why?NOTES:
INSTRUCTIONS FORASSESSING SOIL QUALITYUNDER PASTORAL GRAZINGSOIL INDICATORS
SOIL INDICATORSSoil structure <str<strong>on</strong>g>and</str<strong>on</strong>g> c<strong>on</strong>sistence under pasture Remove a 20 cm cube of <strong>to</strong>psoil with a spade. Drop the soil sample a maximum of three times from a height of <strong>on</strong>emetre (waist height) <strong>on</strong><strong>to</strong> the firm base in the plastic basin. If largeclods break away after the first or sec<strong>on</strong>d drop, drop them individuallyagain <strong>on</strong>ce or twice. If a clod shatters in<strong>to</strong> small (primary structural)units after the first or sec<strong>on</strong>d drop, it does not need dropping again.D<strong>on</strong>’t drop any piece of soil more than three times. Separate each clod from enmeshing roots, <str<strong>on</strong>g>and</str<strong>on</strong>g> part it by h<str<strong>on</strong>g>and</str<strong>on</strong>g> al<strong>on</strong>gany exposed fracture planes or fissures. Transfer the soil <strong>on</strong><strong>to</strong> the large plastic bag. Move the coarsest fracti<strong>on</strong>s <strong>to</strong> <strong>on</strong>e end <str<strong>on</strong>g>and</str<strong>on</strong>g> the finest <strong>to</strong> the other end.This provides a measure of the aggregate-size distributi<strong>on</strong>. Comparethe resulting distributi<strong>on</strong> of aggregates with the three pho<strong>to</strong>graphsopposite.GOOD SOIL STRUCTURE is vital for growing good pastures. It regulatessoil aerati<strong>on</strong> <str<strong>on</strong>g>and</str<strong>on</strong>g> gaseous exchange rates, the movement <str<strong>on</strong>g>and</str<strong>on</strong>g> s<strong>to</strong>rageof water, soil temperature, root penetrati<strong>on</strong> <str<strong>on</strong>g>and</str<strong>on</strong>g> development, nutrientcycling, <str<strong>on</strong>g>and</str<strong>on</strong>g> resistance <strong>to</strong> structural degradati<strong>on</strong>. Good structure alsoincreases the number of days during the year when the soil will supportthe hoof pressure of heavy animals without pugging.56 VISUAL SOIL ASSESSMENT: Volume 1
FIGURE 1: Visual scoring (VS) of soil structure <str<strong>on</strong>g>and</str<strong>on</strong>g> c<strong>on</strong>sistence under pasturePOOR CONDITION VS = 0Soil dominated by extremely coarse, very firmclods with very few finer aggregatesMODERATE CONDITION VS = 1Soil c<strong>on</strong>tains significant proporti<strong>on</strong>s of bothcoarse firm clods <str<strong>on</strong>g>and</str<strong>on</strong>g> friable, fineaggregatesGOOD CONDITION VS = 2Good distributi<strong>on</strong> of friable fineraggregates with no significant cloddingVISUAL SOIL ASSESSMENT: Volume 157
SOIL INDICATORSSoil porosity under pasture Remove a spade slice of soil from the side of the hole created bytaking the 20 cm cube of <strong>to</strong>psoil, or take a number of clods from theaggregate distributi<strong>on</strong> test. Examine for soil porosity, comparing with the three pho<strong>to</strong>graphsopposite.SOIL POROSITY, <str<strong>on</strong>g>and</str<strong>on</strong>g> particularly macroporosity (the number of largepores), c<strong>on</strong>trols the movement of air <str<strong>on</strong>g>and</str<strong>on</strong>g> water in the soil. It is important<strong>to</strong> assess soil porosity as well as aggregate-size distributi<strong>on</strong>. Soils withgood structure have a high porosity between <str<strong>on</strong>g>and</str<strong>on</strong>g> within aggregates,but soils with large structural units may not have macropores <str<strong>on</strong>g>and</str<strong>on</strong>g> coarsemicropores within the large clods, <str<strong>on</strong>g>and</str<strong>on</strong>g> may not be adequately aerated.Restricted air <str<strong>on</strong>g>and</str<strong>on</strong>g> water movement reduces root activity <str<strong>on</strong>g>and</str<strong>on</strong>g> pasturegrowth.58 VISUAL SOIL ASSESSMENT: Volume 1
FIGURE 2: Visual scoring (VS) of soil porosity under pasturePOOR CONDITION VS = 0No macropores or coarse micropores arevisually apparent within compact, massivestructureless clods that typically showsmooth faces with sharp angles, <str<strong>on</strong>g>and</str<strong>on</strong>g> havefew cracks or holesMODERATE CONDITION VS = 1Soil macropores between <str<strong>on</strong>g>and</str<strong>on</strong>g> withinaggregates have declined significantly butare present <strong>on</strong> close examinati<strong>on</strong> of clodsshowing a moderate amount ofc<strong>on</strong>solidati<strong>on</strong>GOOD CONDITION VS = 2Soils have many macropores between <str<strong>on</strong>g>and</str<strong>on</strong>g>within aggregates associated with readilyapparent good soil structureVISUAL SOIL ASSESSMENT: Volume 159
SOIL INDICATORSSoil colour under pasture Compare the colour of a h<str<strong>on</strong>g>and</str<strong>on</strong>g>ful of soil from the soil structure testwith soil taken from under the nearest fence line. Using the three pho<strong>to</strong>graphs below, compare the relative change insoil colour that has occurred.As <strong>to</strong>psoil colour can vary between soil types, the pho<strong>to</strong>graphsillustrate the trend rather than the absolute colour of the soil.THE COLOUR OF THE SOIL is a useful indicati<strong>on</strong> of soil drainage <str<strong>on</strong>g>and</str<strong>on</strong>g>aerati<strong>on</strong>, soiI wetness from late autumn <strong>to</strong> early spring, <str<strong>on</strong>g>and</str<strong>on</strong>g> whetherthe soil is being damaged by pugging. Grey subsoil colours in loamy,silty or clayey soils suggest the soil is poorly drained. Grey soil coloursin the <strong>to</strong>psoil suggest the soil is waterlogged <str<strong>on</strong>g>and</str<strong>on</strong>g> deficient of oxygenfor l<strong>on</strong>g periods. Poor aerati<strong>on</strong> leads <strong>to</strong> a build-up of carb<strong>on</strong> dioxide<str<strong>on</strong>g>and</str<strong>on</strong>g> methane, <str<strong>on</strong>g>and</str<strong>on</strong>g> reduces the ability of plants <strong>to</strong> take up water <str<strong>on</strong>g>and</str<strong>on</strong>g>nutrients, particularly nitrogen, phosphorus <str<strong>on</strong>g>and</str<strong>on</strong>g> potassium. Pooraerati<strong>on</strong> also slows the breakdown of organic residues, <str<strong>on</strong>g>and</str<strong>on</strong>g> can inducechemical reacti<strong>on</strong>s <strong>to</strong>xic <strong>to</strong> plant roots.60 VISUAL SOIL ASSESSMENT: Volume 1
FIGURE 3: Visual scoring (VS) of soil colour under pasturePOOR CONDITION VS = 0Soil colour has become significantly palerdue <strong>to</strong> gleying because of persistentpuggingMODERATE CONDITION VS = 1The colour of the <strong>to</strong>psoil is somewhatpaler due <strong>to</strong> the early stages of gleyingbecause of moderate puggingGOOD CONDITION VS = 2Dark coloured <strong>to</strong>psoil indicating a wellaeratedsoil with a good turnover oforganic matterVISUAL SOIL ASSESSMENT: Volume 161
SOIL INDICATORSNumber <str<strong>on</strong>g>and</str<strong>on</strong>g> colour of soil mottles under pasture Assess the number, size <str<strong>on</strong>g>and</str<strong>on</strong>g> colour of mottles by comparing the sideof the soil profile, or a number of soil clods from the soil structuretest, with the three pho<strong>to</strong>graphs opposite.Mottles are spots or blotches of different colour interspersed withthe dominant soil colour.The percentage chart below will help you determine the percent ofthe soil occupied by mottles.THE NUMBER, SIZE AND COLOUR OF MOTTLES indicate how wellthe soil is drained <str<strong>on</strong>g>and</str<strong>on</strong>g> how well it is aerated. They are also an earlywarning of a decline in soil structure, <str<strong>on</strong>g>and</str<strong>on</strong>g> show whether the soil is beingdamaged by pugging. Loss of soil structure reduces the number ofchannels <str<strong>on</strong>g>and</str<strong>on</strong>g> pores in the soil that c<strong>on</strong>duct air <str<strong>on</strong>g>and</str<strong>on</strong>g> water. This results ina deficiency of oxygen <str<strong>on</strong>g>and</str<strong>on</strong>g> a build-up of carb<strong>on</strong> dioxide. As oxygendepleti<strong>on</strong> increases, orange <str<strong>on</strong>g>and</str<strong>on</strong>g> ultimately grey, mottles form. A highproporti<strong>on</strong> of grey mottles indicates the soil is waterlogged <str<strong>on</strong>g>and</str<strong>on</strong>g> starvedof oxygen for much of the year. Poor aerati<strong>on</strong> reduces the uptake ofwater <str<strong>on</strong>g>and</str<strong>on</strong>g> plant nutrients, particularly nitrogen, phosphorous <str<strong>on</strong>g>and</str<strong>on</strong>g>potassium. Poor aerati<strong>on</strong> also retards the breakdown of organicresidues, <str<strong>on</strong>g>and</str<strong>on</strong>g> can induce chemical reacti<strong>on</strong>s that form chemicals <strong>to</strong>xic<strong>to</strong> plant roots.62 VISUAL SOIL ASSESSMENT: Volume 1
FIGURE 4: Visual scoring (VS) of number <str<strong>on</strong>g>and</str<strong>on</strong>g> colour of soil mottles under pasturePOOR CONDITION VS = 0Soil has abundant <strong>to</strong> profuse (>50%),medium <str<strong>on</strong>g>and</str<strong>on</strong>g> coarse orange <str<strong>on</strong>g>and</str<strong>on</strong>g> greymottlesMODERATE CONDITION VS = 1Soil has comm<strong>on</strong> (10-25%) fine <str<strong>on</strong>g>and</str<strong>on</strong>g>medium orange <str<strong>on</strong>g>and</str<strong>on</strong>g> grey mottlesGOOD CONDITION VS = 2Mottles are generally absentVISUAL SOIL ASSESSMENT: Volume 163
SOIL INDICATORSEarthworm counts under pasture Sort carefully through the soil sample used <strong>to</strong> assess soil structure,<str<strong>on</strong>g>and</str<strong>on</strong>g> count the earthworms found in a 5 minute search. Pay particularattenti<strong>on</strong> <strong>to</strong> the turf mat. Earthworms vary in size <str<strong>on</strong>g>and</str<strong>on</strong>g> numberdepending <strong>on</strong> the seas<strong>on</strong>, so for year-<strong>to</strong>-year comparis<strong>on</strong>, earthwormcounts must be made at the same time of year, <str<strong>on</strong>g>and</str<strong>on</strong>g> preferably duringthe winter. The class limits for earthworm numbers given oppositeare based <strong>on</strong> the probability that you will find <strong>on</strong>ly two thirds of theworms present during a 5-minute search.(Earthworm numbers are comm<strong>on</strong>ly reported <strong>on</strong> a square-metre basis.A 20 cm cube sample is equivalent <strong>to</strong> 1/25 square metre <str<strong>on</strong>g>and</str<strong>on</strong>g> so thenumber of earthworms counted should be multiplied by 25 <strong>to</strong> c<strong>on</strong>vert<strong>to</strong> a square metre basis. If your sample depth is <strong>on</strong>ly 0-10cm, thesame class limits <str<strong>on</strong>g>and</str<strong>on</strong>g> c<strong>on</strong>versi<strong>on</strong> fac<strong>to</strong>rs apply, because comm<strong>on</strong>earthworks are most abundant in the upper <strong>to</strong>psoil.)EARTHWORMS play a major role, through their burrowing, feeding <str<strong>on</strong>g>and</str<strong>on</strong>g>casting, in decomposing <str<strong>on</strong>g>and</str<strong>on</strong>g> cycling organic matter, <str<strong>on</strong>g>and</str<strong>on</strong>g> in supplyingnutrients. They can also improve soil porosity <str<strong>on</strong>g>and</str<strong>on</strong>g> aerati<strong>on</strong>, waterinfiltrati<strong>on</strong> <str<strong>on</strong>g>and</str<strong>on</strong>g> c<strong>on</strong>ductivity, aggregate size <str<strong>on</strong>g>and</str<strong>on</strong>g> stability, root growth<str<strong>on</strong>g>and</str<strong>on</strong>g> subsequent pasture productivity. Earthworm numbers can decline(3-fold) under severe pugging <str<strong>on</strong>g>and</str<strong>on</strong>g> can have adverse l<strong>on</strong>g-term effects<strong>on</strong> nutrient cycling, organic matter decompositi<strong>on</strong>, soil structure <str<strong>on</strong>g>and</str<strong>on</strong>g>porosity.64 VISUAL SOIL ASSESSMENT: Volume 1
FIGURE 5: Visual scoring (VS) of earthworm counts under pastureVisual score Earthworm counts(VS)(per 20 cm cube of soil)2 >201 10–200
SOIL INDICATORSSurface relief under pasture Observe the surface relief (smoothness) of the paddock at the end ofwinter. Compare it with the three pho<strong>to</strong>graphs opposite.Although soils are most susceptible <strong>to</strong> pugging during the wet winterm<strong>on</strong>ths, observati<strong>on</strong>s of surface relief at any time of the year willgive useful informati<strong>on</strong> <strong>on</strong> damage caused by past <str<strong>on</strong>g>grazing</str<strong>on</strong>g>, <str<strong>on</strong>g>and</str<strong>on</strong>g> itslikely effects <strong>on</strong> soil quality.SURFACE RELIEF shows the severity of pugging under s<strong>to</strong>ck treading,<str<strong>on</strong>g>and</str<strong>on</strong>g> indicates structural damage below the surface. Wet soil can pugseverely under intensive <str<strong>on</strong>g>grazing</str<strong>on</strong>g>. This reduces the pores in the soil,which are important for water, nutrient <str<strong>on</strong>g>and</str<strong>on</strong>g> air movement, <str<strong>on</strong>g>and</str<strong>on</strong>g> rootpenetrati<strong>on</strong>.66 VISUAL SOIL ASSESSMENT: Volume 1
FIGURE 6: Visual scoring (VS) of surface relief under pasturePOOR CONDITION VS = 0Surface is very broken <str<strong>on</strong>g>and</str<strong>on</strong>g> deeply incised bysevere repeated treading. The terrain isdifficult <strong>to</strong> walk across <str<strong>on</strong>g>and</str<strong>on</strong>g> care must betaken <strong>to</strong> avoid twisting anklesMODERATE CONDITION VS = 1Surface terrain is somewhat broken up <str<strong>on</strong>g>and</str<strong>on</strong>g>incised by occasi<strong>on</strong>al heavy treadingevents but it is not difficult <strong>to</strong> walk overGOOD CONDITION VS = 2Surface is relatively smooth <str<strong>on</strong>g>and</str<strong>on</strong>g>unbrokenVISUAL SOIL ASSESSMENT: Volume 167
68 VISUAL SOIL ASSESSMENT: Volume 1
INSTRUCTIONS FORASSESSING SOIL QUALITYUNDER PASTORAL GRAZINGPLANT INDICATORSVISUAL SOIL ASSESSMENT: Volume 169
PLANT INDICATORSPasture compositi<strong>on</strong> Assess the botanical compositi<strong>on</strong> of the pasture (the proporti<strong>on</strong> ofeach species present) in the winter or early spring.PASTURE SPECIES vary in their <strong>to</strong>lerance <strong>to</strong> poor soil aerati<strong>on</strong>,waterlogging <str<strong>on</strong>g>and</str<strong>on</strong>g> pugging. C<strong>on</strong>sequently, their nitrogen uptake, drymatter producti<strong>on</strong> <str<strong>on</strong>g>and</str<strong>on</strong>g> survival ability also vary markedly. Phalarisaquatica, tall fescue, meadow fescue, meadow foxtail, Poa trivialis,timothy, creeping bent, sweet grass, pennyroyal, buttercup, duckweed<str<strong>on</strong>g>and</str<strong>on</strong>g> dock are <strong>to</strong>lerant of waterlogging due <strong>to</strong> pugging or poor drainage.Perennial ryegrass, white clover, chewing fescue, brown<strong>to</strong>p, Poa annua,<str<strong>on</strong>g>and</str<strong>on</strong>g> crested dogstail are moderately <strong>to</strong>lerant of waterlogging. Matuaprairie grass, cocksfoot, sweet vernal, Poa pratensis, ratstail, meadowrice grass <str<strong>on</strong>g>and</str<strong>on</strong>g> yarrow are sensitive <strong>to</strong> waterlogging <str<strong>on</strong>g>and</str<strong>on</strong>g> will die out ifwet c<strong>on</strong>diti<strong>on</strong>s persist.Pasture compositi<strong>on</strong> will also change according <strong>to</strong> the degree of treadingdamage. Ryegrass <str<strong>on</strong>g>and</str<strong>on</strong>g> Poa pratensis resist treading damage betterthan many other species, <str<strong>on</strong>g>and</str<strong>on</strong>g> often become more comm<strong>on</strong> in puggedpastures. Poa trivialis, brown <strong>to</strong>p, white clover <str<strong>on</strong>g>and</str<strong>on</strong>g> timothy aremoderately <strong>to</strong>lerant <strong>to</strong> treading. Cocksfoot, red clover <str<strong>on</strong>g>and</str<strong>on</strong>g> yorkshirefog, <str<strong>on</strong>g>and</str<strong>on</strong>g> many low fertility pasture species such as sweet vernal <str<strong>on</strong>g>and</str<strong>on</strong>g>chewing fescue are sensitive <strong>to</strong> intensive treading <str<strong>on</strong>g>and</str<strong>on</strong>g> disappear underprol<strong>on</strong>ged pugging. Treading damage <str<strong>on</strong>g>and</str<strong>on</strong>g> the exposing of bare groundwill also allow invasi<strong>on</strong> by opportunist species such as white clover <str<strong>on</strong>g>and</str<strong>on</strong>g>Poa annua, more vigorous weeds, <str<strong>on</strong>g>and</str<strong>on</strong>g> less desirable pasture species.White clover, being s<strong>to</strong>l<strong>on</strong>iferous, can rapidly col<strong>on</strong>ise bare ground <str<strong>on</strong>g>and</str<strong>on</strong>g>become dominant in severely pugged pasture.70 VISUAL SOIL ASSESSMENT: Volume 1
FIGURE 7: Visual scoring (VS) of pasture compositi<strong>on</strong>POOR CONDITION VS = 0Pastures are often dominated by species thatare more <strong>to</strong>lerant of poor aerati<strong>on</strong> <str<strong>on</strong>g>and</str<strong>on</strong>g>waterlogging due <strong>to</strong> pugging, by species suchas ryegrass that are more <strong>to</strong>lerant of s<strong>to</strong>cktreading, <str<strong>on</strong>g>and</str<strong>on</strong>g> species such as white clover thatquickly col<strong>on</strong>ise bare ground created by severetreading. Weeds are also very comm<strong>on</strong> <str<strong>on</strong>g>and</str<strong>on</strong>g>may include pennyroyal, buttercup, duckweed<str<strong>on</strong>g>and</str<strong>on</strong>g> dock. Pasture compositi<strong>on</strong> has littlerelati<strong>on</strong>ship <strong>to</strong> the original seed mixMODERATE CONDITION VS = 1Pasture species with a range of <strong>to</strong>lerances<strong>to</strong> waterlogging <str<strong>on</strong>g>and</str<strong>on</strong>g> s<strong>to</strong>ck treading arepresent, <str<strong>on</strong>g>and</str<strong>on</strong>g> pastures may c<strong>on</strong>tain anumber of weeds <str<strong>on</strong>g>and</str<strong>on</strong>g> forage herbsincluding dock, mayweed, pennyroyal <str<strong>on</strong>g>and</str<strong>on</strong>g>plantain. Pasture mix differs somewhatfrom that originally sownGOOD CONDITION VS = 2Pasture compositi<strong>on</strong> has a good mix ofhigh producing pasture species (e.g.,ryegrass, white clover <str<strong>on</strong>g>and</str<strong>on</strong>g> cocksfoot) <str<strong>on</strong>g>and</str<strong>on</strong>g>species in<strong>to</strong>lerant of poor aerati<strong>on</strong> <str<strong>on</strong>g>and</str<strong>on</strong>g>waterlogging; few weeds. Pasturecompositi<strong>on</strong> reflects the original mixVISUAL SOIL ASSESSMENT: Volume 171
PLANT INDICATORSPasture growth <str<strong>on</strong>g>and</str<strong>on</strong>g> regrowth rates Assess pasture growth <str<strong>on</strong>g>and</str<strong>on</strong>g> regrowth rates since the last <str<strong>on</strong>g>grazing</str<strong>on</strong>g> bypasture probe, rising plate or herbage cut measurements.If this informati<strong>on</strong> is not available, use visual approximati<strong>on</strong>s of drymatter producti<strong>on</strong> levels.For a reliable comparis<strong>on</strong>, make assessments at the same time ofyear, preferably in early spring.HIGH PASTURE GROWTH RATES depend <strong>on</strong> good soil structure <str<strong>on</strong>g>and</str<strong>on</strong>g>fertility, <str<strong>on</strong>g>and</str<strong>on</strong>g> <strong>on</strong> the seas<strong>on</strong> <str<strong>on</strong>g>and</str<strong>on</strong>g> seas<strong>on</strong>al weather c<strong>on</strong>diti<strong>on</strong>s, <strong>to</strong> allowthe movement of water <str<strong>on</strong>g>and</str<strong>on</strong>g> air in the soil. Treading damage <strong>on</strong>compacted moist soils can reduce pasture producti<strong>on</strong> by up <strong>to</strong> 27percent, but <strong>on</strong> pugged (deformed) wet soils, the reducti<strong>on</strong> can be asmuch as 45 percent. Pasture regrowth rates <strong>on</strong> wet soils can be reducedby 20–30 percent. Good dry matter producti<strong>on</strong> from quality pastures isneeded for good dairy producti<strong>on</strong>. For cows <strong>to</strong> be also in good c<strong>on</strong>diti<strong>on</strong>at calving, an adequate pasture cover of 2000 kg DM/ha is needed,<str<strong>on</strong>g>and</str<strong>on</strong>g> pastures need <strong>to</strong> be capable of rapid regrowth.72 VISUAL SOIL ASSESSMENT: Volume 1
FIGURE 8: Visual scoring (VS) of pasture growth <str<strong>on</strong>g>and</str<strong>on</strong>g> regrowth ratesVisual score Pasture growth <str<strong>on</strong>g>and</str<strong>on</strong>g> regrowth rates(VS)2 Good pasture growth <str<strong>on</strong>g>and</str<strong>on</strong>g> regrowth1 Moderate pasture growth <str<strong>on</strong>g>and</str<strong>on</strong>g> regrowth0 Poor pasture growth <str<strong>on</strong>g>and</str<strong>on</strong>g> regrowthVISUAL SOIL ASSESSMENT: Volume 173
PLANT INDICATORSPasture utilisati<strong>on</strong> Assess pasture utilisati<strong>on</strong> by the proporti<strong>on</strong> of pasture that has beengrazed, <str<strong>on</strong>g>and</str<strong>on</strong>g> by the proporti<strong>on</strong> not smeared by or trampled in<strong>to</strong> themud by <str<strong>on</strong>g>grazing</str<strong>on</strong>g> animals (see opposite).Assess pasture utilisati<strong>on</strong> during the wet winter m<strong>on</strong>ths after or nearthe end of a <str<strong>on</strong>g>grazing</str<strong>on</strong>g> cycle.DEGRADED SOILS have a low load-bearing capacity. As a result,pastures <strong>on</strong> these soils are easily trampled in<strong>to</strong> the mud when wet. Thismakes them both inaccessible <str<strong>on</strong>g>and</str<strong>on</strong>g> unpalatable <strong>to</strong> s<strong>to</strong>ck. Trampling canreduce pasture utilisati<strong>on</strong> by 20–40 percent.74 VISUAL SOIL ASSESSMENT: Volume 1
FIGURE 9: Visual scoring (VS) of pasture utilisati<strong>on</strong>Visual score(VS)Pasture utilisati<strong>on</strong>2 Good pasture utilisati<strong>on</strong> with <strong>on</strong>ly a little ofthe pasture being trampled in<strong>to</strong> the mud1 Moderate utilisati<strong>on</strong> with a significantamount of pasture being covered by, <str<strong>on</strong>g>and</str<strong>on</strong>g>trampled in<strong>to</strong> the mud0 Poor utilisati<strong>on</strong> with a large proporti<strong>on</strong> ofpasture being covered by, <str<strong>on</strong>g>and</str<strong>on</strong>g> trampledin<strong>to</strong> the mudVISUAL SOIL ASSESSMENT: Volume 175
PLANT INDICATORSArea of bare ground Assess the area of bare ground in winter or early spring.Compare the surface of the soil with the three pho<strong>to</strong>graphs opposite.If there is canopy closure, part the pasture with your h<str<strong>on</strong>g>and</str<strong>on</strong>g>s <str<strong>on</strong>g>and</str<strong>on</strong>g> scoreat ground level. An assessment of an area of bare ground after a l<strong>on</strong>gdry period will show how much pasture has died from lack of moisture.IN ADDITION TO STOCK CAMPING <str<strong>on</strong>g>and</str<strong>on</strong>g> drought effects, bare groundis formed by the physical churning up of the soil from treading <str<strong>on</strong>g>and</str<strong>on</strong>g>pugging. This causes leaf <str<strong>on</strong>g>and</str<strong>on</strong>g> stem crushing, uprooting or burial ofplants, <str<strong>on</strong>g>and</str<strong>on</strong>g> root damage, which reduces pasture density <str<strong>on</strong>g>and</str<strong>on</strong>g> vigour.Weeds <str<strong>on</strong>g>and</str<strong>on</strong>g> less desirable pasture species can invade the resulting gaps,further reducing pasture producti<strong>on</strong>. Like surface relief, the area of bareground can be a good indica<strong>to</strong>r of below-ground damage.76 VISUAL SOIL ASSESSMENT: Volume 1
FIGURE 10: Visual scoring (VS) of area of bare groundPOOR CONDITION VS = 0Large areas of bare ground occur becauseof treading damage <str<strong>on</strong>g>and</str<strong>on</strong>g> the subsequentreducti<strong>on</strong> in the density <str<strong>on</strong>g>and</str<strong>on</strong>g> vigour ofpasture plants. White clover <str<strong>on</strong>g>and</str<strong>on</strong>g> lessdesirable pasture species <str<strong>on</strong>g>and</str<strong>on</strong>g> weeds mayhave invaded degraded <str<strong>on</strong>g>and</str<strong>on</strong>g> bare areasMODERATE CONDITION VS = 1Pasture shows significant areas of bareground <str<strong>on</strong>g>and</str<strong>on</strong>g> sporadic growth with theingressi<strong>on</strong> of weeds <str<strong>on</strong>g>and</str<strong>on</strong>g> white clovercaused by treading damageGOOD CONDITION VS = 2Pasture growth is vigorous <str<strong>on</strong>g>and</str<strong>on</strong>g> coversalmost the whole surface areaVISUAL SOIL ASSESSMENT: Volume 177
PLANT INDICATORSDrought stress of pastures during dry periods Assess, from visual evidence <str<strong>on</strong>g>and</str<strong>on</strong>g> local knowledge, the degree <strong>to</strong>which pastures are drought stressed during dry periods by comparingthe greenness of the pasture with the three pho<strong>to</strong>graphs opposite. Assess the level of dry matter producti<strong>on</strong>, <str<strong>on</strong>g>and</str<strong>on</strong>g> whether drought<strong>to</strong>lerantspecies have become dominant in the pasture sward.THE DEGREE OF DROUGHT STRESS in dry periods depends <strong>on</strong> climaticc<strong>on</strong>diti<strong>on</strong>s, the drought <strong>to</strong>lerance of the pasture, <str<strong>on</strong>g>and</str<strong>on</strong>g> the water-holdingcapacity of the soil. The last is governed by soil depth <str<strong>on</strong>g>and</str<strong>on</strong>g> texture,organic matter c<strong>on</strong>tent, <str<strong>on</strong>g>and</str<strong>on</strong>g> the number <str<strong>on</strong>g>and</str<strong>on</strong>g> size of soil pores. Pas<strong>to</strong>ralsoils with a good soil structure have a large number of macropores <str<strong>on</strong>g>and</str<strong>on</strong>g>coarse <str<strong>on</strong>g>and</str<strong>on</strong>g> medium-sized micropores, <str<strong>on</strong>g>and</str<strong>on</strong>g>, subsequently, have a higherwater-holding capacity than degraded soils with few pores.78 VISUAL SOIL ASSESSMENT: Volume 1
FIGURE 11: Visual scoring (VS) of drought stress of pastures during dry periodsPOOR CONDITION VS = 0With the possible excepti<strong>on</strong> of drought<strong>to</strong>lerant species, pastures brown offcompletely <str<strong>on</strong>g>and</str<strong>on</strong>g> pasture growth s<strong>to</strong>ps duringdry periods. Pastures die off during times ofprol<strong>on</strong>ged drought. With the excepti<strong>on</strong> ofsubterranean clover <str<strong>on</strong>g>and</str<strong>on</strong>g> drought-<strong>to</strong>lerantspecies such as phalaris, pastures take a l<strong>on</strong>gtime <strong>to</strong> come away in autumn. Soil structurebecomes brittle <str<strong>on</strong>g>and</str<strong>on</strong>g> turns <strong>to</strong> dust undertreadingMODERATE CONDITION VS = 1N<strong>on</strong>-drought <strong>to</strong>lerant pastures ‘brown off’significantly during dry summer m<strong>on</strong>ths,although thin green patches are still presentclose <strong>to</strong> the ground. Dry matter producti<strong>on</strong> isvery low <str<strong>on</strong>g>and</str<strong>on</strong>g> pastures become dominatedduring drought by the more drought-resistantcocksfoot, tall fescue, phalaris, birdsfoot, Lotustrefoil, meadow rice-grass, rats tail <str<strong>on</strong>g>and</str<strong>on</strong>g> smallannual clovers. Deep rooted <strong>flat</strong> weeds suchas plantain <str<strong>on</strong>g>and</str<strong>on</strong>g> hawkbit may also be comm<strong>on</strong>GOOD CONDITION VS = 2Pastures remain relatively green, <str<strong>on</strong>g>and</str<strong>on</strong>g> drymatter producti<strong>on</strong> is able <strong>to</strong> hold <strong>on</strong>,albeit at low levels, further in<strong>to</strong> drysummers. Pasture compositi<strong>on</strong> isdominated by ryegrass <str<strong>on</strong>g>and</str<strong>on</strong>g> white cloverduring dry periodsVISUAL SOIL ASSESSMENT: Volume 179
PLANT INDICATORSSurface p<strong>on</strong>ding under pasture Assess the degree of surface p<strong>on</strong>ding.Base your assessment <strong>on</strong> p<strong>on</strong>ding present at the time, or your generalrecollecti<strong>on</strong> of the time p<strong>on</strong>ded water <strong>to</strong>ok <strong>to</strong> disappear after a wetperiod, or after heavy rainfall in the winter (see opposite). Yellow orpale patches of pasture, or pasture lying <strong>flat</strong> over the surface indicaterecent surface p<strong>on</strong>ding.THE LENGTH OF TIME WATER REMAINS PONDED <strong>on</strong> the surfaceindicates the rate of infiltrati<strong>on</strong> in<strong>to</strong> the soil, <str<strong>on</strong>g>and</str<strong>on</strong>g> the time the soil remainssaturated. Prol<strong>on</strong>ged waterlogging depletes oxygen <str<strong>on</strong>g>and</str<strong>on</strong>g> causes carb<strong>on</strong>dioxide <strong>to</strong> build up. Anaerobic c<strong>on</strong>diti<strong>on</strong>s develop, <str<strong>on</strong>g>and</str<strong>on</strong>g> chemical <str<strong>on</strong>g>and</str<strong>on</strong>g>biochemical reacti<strong>on</strong>s produce by-products <strong>to</strong>xic <strong>to</strong> plant roots. PlantavailableN is lost through denitrificati<strong>on</strong>, pastures become pale oryellow, <str<strong>on</strong>g>and</str<strong>on</strong>g> pho<strong>to</strong>synthesis declines. Root damage reduces nutrient <str<strong>on</strong>g>and</str<strong>on</strong>g>water uptake <str<strong>on</strong>g>and</str<strong>on</strong>g> plants can wilt <str<strong>on</strong>g>and</str<strong>on</strong>g> lie <strong>on</strong> the surface. Prol<strong>on</strong>gedsurface p<strong>on</strong>ding makes soil more susceptible <strong>to</strong> pugging, <str<strong>on</strong>g>and</str<strong>on</strong>g> pastureplants <strong>to</strong> treading damage. It decreases pasture growth <str<strong>on</strong>g>and</str<strong>on</strong>g> utilisati<strong>on</strong>,<str<strong>on</strong>g>and</str<strong>on</strong>g> can alter pasture species compositi<strong>on</strong>.80 VISUAL SOIL ASSESSMENT: Volume 1
FIGURE 12: Visual scoring (VS) of surface p<strong>on</strong>ding under pasturePOOR CONDITION VS = 0Significant surface p<strong>on</strong>ding occurs forl<strong>on</strong>ger than 3 days following heavy rainfall<strong>on</strong> soils that were at or close <strong>to</strong>saturati<strong>on</strong>. The pasture has yellowed orpaled in colour in patches <str<strong>on</strong>g>and</str<strong>on</strong>g> lies <strong>flat</strong> <strong>on</strong>the surfaceMODERATE CONDITION VS = 1Moderate surface p<strong>on</strong>ding can occur forup <strong>to</strong> 3 days following heavy rain <strong>on</strong> soilsthat were at or near saturati<strong>on</strong>GOOD CONDITION VS = 2No p<strong>on</strong>ding of water evident 24hours after heavy rain <strong>on</strong> soils thatwere at or near saturati<strong>on</strong>VISUAL SOIL ASSESSMENT: Volume 181
PLANT INDICATORSS<strong>to</strong>ck-carrying capacity <str<strong>on</strong>g>and</str<strong>on</strong>g> fertiliser use Assess s<strong>to</strong>ck-carrying capacity, based <strong>on</strong> your knowledge of thepaddock. Is additi<strong>on</strong>al fertiliser needed <strong>to</strong> maintain s<strong>to</strong>cking capacity?PASTURE PRODUCTION can recover almost completely withinapproximately 6 m<strong>on</strong>ths following moderate soil compacti<strong>on</strong>. Severecompacting <str<strong>on</strong>g>and</str<strong>on</strong>g> pugging, however, can reduce dry matter producti<strong>on</strong>by up <strong>to</strong> 40–45 percent. If feed utilisati<strong>on</strong> ratios are around 0.7, thisdecline in pasture producti<strong>on</strong> would reduce potential s<strong>to</strong>ck numbersby 10–20 percent. To offset this trend, additi<strong>on</strong>al fertiliser is oftenapplied <strong>to</strong> maintain dry matter producti<strong>on</strong> <str<strong>on</strong>g>and</str<strong>on</strong>g> s<strong>to</strong>ck numbers.82 VISUAL SOIL ASSESSMENT: Volume 1
FIGURE 13: Scoring of s<strong>to</strong>ck-carrying capacity <str<strong>on</strong>g>and</str<strong>on</strong>g> fertiliser useVisual score(VS)S<strong>to</strong>ck-carrying capacity <str<strong>on</strong>g>and</str<strong>on</strong>g>fertiliser use2 St<str<strong>on</strong>g>and</str<strong>on</strong>g>ard fertiliser applicati<strong>on</strong>s <strong>to</strong> maintains<strong>to</strong>ck-carrying capacity1 Some additi<strong>on</strong>al fertiliser is required <strong>to</strong>maintain s<strong>to</strong>cking rates0 Significant additi<strong>on</strong>al fertiliser is required<strong>to</strong> maintain s<strong>to</strong>cking rates, especiallyduring pinch periodsVISUAL SOIL ASSESSMENT: Volume 183
84 VISUAL SOIL ASSESSMENT: Volume 1