Investor Site Tour Presentation - Fortescue Metals Group Ltd
Investor Site Tour Presentation - Fortescue Metals Group Ltd
Investor Site Tour Presentation - Fortescue Metals Group Ltd

Create successful ePaper yourself
Turn your PDF publications into a flip-book with our unique Google optimized e-Paper software.
IntroductionNev Power
HighlightsSeptember 2013 Quarter• Average realised CFR sales price of US$121/dmt• C1 costs US$33.17/wmt• Quarterly shipments of 25.9mt, 4% increase from previous quarter• Cash on hand of US$2.8bn• Debt reduction programme commenced• Kings commissioning underway5
<strong>Fortescue</strong>’s Pilbara operations6
A differentiated modelDelivering resultsRelationshipsDirect relationships with sub contractors and local suppliersChinaLeveraging China’s growth and manufacturing capabilitySpeedSpeed of delivery – time is moneyPlanningPlanning for scale today and efficiency into the futureCulture<strong>Fortescue</strong>’s unique culture is the key7
FinancialsStephen Pearce
Financial Summary FY13September 2013 Quarter• Cash $2.8bn at 30 Sept with Formosa proceeds $623m in Oct• Past peak Net Debt - $9.3bn (excluding finance leases)• Debt repayment commenced• Strong operational cash flows, revenue stream and lower costs• Flexible debt structure9
US$m2,0406001281,0005,0009001,5001,000Simplified and flexible debt capital structureVoluntary repayment or refinancing options over US$7.6bn of facilities5,0004,5004,0003,5003,000Preference Shares tobe repaid on11 Nov 2013Term Loanrepayable at anytime2,5002,0001,5001,0002015 and 2016Notes are nowcallable50001H13 2H13 1H14 2H14 1H15 2H15 1H16 2H16 1H17 2H17 1H18 2H18 1H19 2H19 1H20 2H20 1H21 2H21 1H22 2H22CY2013 CY2014 CY2015 CY2016 CY2017 CY2018 CY2019 CY2020 CY2021 CY2022Senior Secured Credit Facility Senior Unsecured Notes Preference Shares10
Operating margins support<strong>Fortescue</strong>’s average realised selling price and C1 costsUS$/wmt18062% Platts US$/dmt180160$14616014014012010080$73$110 $115 $114$42$40$49$89$21$102$33$119$58$111$103$48 $60120100806040$23$21$23$19 $18 $18$18$19 $18604020$50 $46 $53$46 $49 $50$44$36 $33200Q1FY12 Q2FY12 Q3FY12 Q4FY12 Q1FY13 Q2FY13 Q3FY13 Q4FY13 Q1FY14C1 cost Other operating costs CFR Operating margin 62% Platts index (RHS)0C1 guidance of US$36/wmt in FY1411
Sustained operating cost reductionC1 trending lower as steady state operations commenceC1 Cash Cost (US$/wmt shipped)C1 estimate for the remainderof FY14Strip Ratio6.05.04.03.02.01.0Q1 FY13 Q2 FY13 Q3 FY13 Q4 FY13 Q1 FY14 Q2 FY14 Q3 FY14 Q4 FY14 FY12 FY13 FY140.0C1 Cash Cost (US$/wmt shipped)Strip RatioQ2 – Q3 increase in C1 through ramp up of Kings and wet season12
Operational savings > US$400 in FY13• Significant permanent costremoved from the business• Product strategy improvesoperational efficiencies• Improved procurement functiongenerates saving• Some deferral of non essentialexpenditureGrade control contractorsHaulageStrip ratiosContracts, deferralsDrill and blast contractorsFleet utilisation and maintenanceEmployee costs13
Breakeven cash priceReduced to low US$70’s / t (62% CFR basis)100806040200C1Admin andsustainable minimalcapexFixedelementsShipping Royalties Interest RealisedFMGUS$/wmtCFRGrade,discount andmoistureBreakevenprice - FY14Breakevenprice - 12months agoDelivered significant reductions in breakeven CFR price14
Financial analysisUS$ cents10080EPSCFPS604089.3 90.296.520018x16x14x12x10x8x6x4x2x0x41.650.156.132.918.92010 2011 2012 2013FY14 forecast PE ratio5.73x15Source: Bloomberg at 21 September 2013
DevelopmentPeter Meurs
Iron Bridge – Two stages of developmentStage 1 – production to to commence Q1 Q1 2015Q1 2015Stage 1: 1.5mtpamHematite2016Stage 2: 10mtpaMagnetite10mtpa ROM1-2mtpa 66% FeM&P - $338mPort - $17mInner HarbourTruck40mtpa ROM10mtpa 68% FeM&P - $1.44bnPort - $101mInner HarbourSlurry pipe17
12km long x 400m wide x 600m deepIron Bridge magnetite deposit400mMagnetic Hematite– “At surface”– DTR ~20%– Fe 66%30m300 mLife ofMinePit Shell550 m18
Port - flexible design for future growthFourth berth commissioned with fifth berth approvedAP3AP2AP1AP4AP519
Near mine exploration - SolomonRIO owned Mining Leaseswithin Solomon East~50 -100Mt DID & BIDExploration TargetFiretail North~25-50Mt BID & DIDExplorationTargetOther BID and DID podswithin Solomon East~25-50MtExploration TargetSheila Valley~200Mt BID & DIDInferred Resource &ExplorationTarget **Stingray~30-50 Mt BID MMIFExploration Target **Fredrick50Mt BIDInferred ResourceMt McLeod North130Mt BID MMIFInferred Resource25km radius fromFiretail OPFMt McLeod South70Mt BID MMIFInferred Resource** Possible Western Hub Staged 5-10Mt/pa Development21
Mineral Resources (Mt)Resource portfolio sets expansion platformLeverage existing assets for low cost growth18,00016,00014,00012,0005,205 5,20510,0002,4653,2362,463 2,4638,0006,0004,0002,000-2,013624 6241,032624 6241,2301,2303,247 3,5043,070 3,0701,715 2,2242,860695 695695 695695 695 6953,379 3,2222,266 2,227 2,143 2,550 2,5502008 2009 2010 2011 2012 2013 2014Chichester Hub Chichester Other Solomon Hub Western Hub Nyidinghu MagnetiteFiscal Year22
OperationsDavid Woodall
Annual Sales Mt wetReserve & LOM projected life (by Hub)1601401201008060402001 2 3 4 5 6 7 8 9 10 11 12 13 14 15 16 17 18 19 20 21 22 23 24 25 26 27 28 29 30 31 32YearsChichester Hub Reserve Chichester Hub LOM Resource Solomon Hub Reserve Solomon Hub LOM Resource• Based on FY13 Reserve schedule and LOM plan• Resource 5.2 Bt @ Fe 56.4 %• Reserve – 2.3 Bt @ Fe 57.7 %24
Product strategyRevised product strategy at 155mtpa - average grade 58%BonnieFines6mtpaSuper SpecialFines 30mtpaRocket10mtpa<strong>Fortescue</strong>Blend70mtpaKings CID40mtpa• Focused on maximising resource recovery• Optimising revenue by an integrated product25
Importance of upgradeOpportunity – innovation to further improve resource recovery and lower cash costsProductOPFUpgradesLowerStripRatioLowerC1 CostsWet plants and jigs upgrade to deliver:• Increased resource recovery• Lower cut-off grade• Lower strip ratios 4.5x to 3.5x• Lower C1 costs26
OPF Schematic FlowsheetROM FeedScrubbersWetFront70% dry ROM FeedCrushing /ScreeningEnd30% to UpgradeDesands PlantTailsProduct27• Cloudbreak - 40 Mt• Christmas Creek- OPF #1 – 23Mt- OPF # 2 – 27 Mt• Firetail – 20 Mt• Kings – 40 Mt
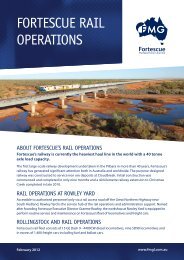
Rail Snapshot• Ore trains 32,800 Net Tonne; full Electric Controlled Pneumatics; targeting sub 24hour cycle.• 13 ore rakes (460,000 tpd).• Double header plus banker operation.• Slow speed loading at 1.5 kph rotary tip; indexing at 0.54 mps; 90 sec tip cycle.• Perth based Central Train Control ; voice/data comms; asset protection, moving toGE RailEdge using Incremental Train Control System;• World Class maintenance facility. Old facility - 20 wheel sets / shiftNew Facility - 45 wheel sets / shift28
Rail Operations – Infrastructure Complete• 40 tonne axle load,heaviest in the world• 155Mt ore and 950 Ml per year29
Port operations - flexible and efficientInload Capacity – 180 MtpaOut Load Capacity – 155 MtpaBest 7 day Performance• Inload – 125 Mt• Outload – 148 Mt• Three Inload and Out load Circuits30
Time (mins)Time (mins)Truck Utilisation : First and last Loads TrucksTime to First load (Diggers)20:00Time of Last load (Diggers) before end of shift22:0019:0020:0018:0017:0018:0016:0015:0016:0014:005/07/201216/08/20124/10/201222/11/201210/01/201328/02/2013Date18/04/20136/06/201325/07/201312/09/20135/07/201216/08/20124/10/201222/11/201210/01/201328/02/2013Date18/04/20136/06/201325/07/201312/09/2013• Diggers swinging within 17 mins of the shift change over• Efficient use of the truck fleet - same production from84 trucks compared with 120 in September 2012.31
OEE %OEE %Operating Equipment EfficiencyOEE RH340OEE 420090.0%80.0%70.0%60.0%50.0%40.0%30.0%Oct-Dec 12 Jan-Jun 13 Jul-Oct 13UCL=84.9%_X=68.5%LCL=52.2%110.0%100.0%90.0%80.0%70.0%60.0%50.0%40.0%30.0%Oct-Dec 12 Jan-Jun 13 Jul-Oct 13UCL=102.1%_X=68.3%LCL=34.5%20.0%11/10/201215/11/201220/12/201224/01/201328/02/201311/04/201316/05/2013Date20/06/201325/07/201329/08/20133/10/201320.0%11/10/201215/11/201220/12/201224/01/201328/02/201311/04/201316/05/2013Date20/06/201325/07/201329/08/20133/10/2013• The average weekly OEE for the RH 340 diggers and 4200 SurfaceMiners have been steadily climbing since June 2013 at Cloudbreak• An increase of 1% in OEE will yield approx. 200,000 tonnes per yearper unit• 40% of surface miner fleet parked32
Individual ValueDensityTrain Unloader 2 OptimisationHistogram TUL Dump TimesNormal0.070.060.050.04PhaseBaselinePilot ProjectControlMean StDev N225.0 17.06 22213.0 14.95 10206.5 5.666 150.030.020.010.00180195210225Time240255• Average unload time reducedfrom 225 minutes to206 minutes93929190Av Tip Time Per Car1 15 3311• Focused on improved reliability898887UCL=88.107_X=86.94186LCL=85.775851511151923 27Week313539434733
MarketNev Power
Long term confidence in ChinaLower growth rates but still strong in absolute volumes• Strong underlying economy~ 7.8 per cent GDP growth• New leaders committed to growth• Steel consumption greater than2.1mt per day• Urbanisation and infrastructuredriving steel demand• Iron ore inventories remain belowaverage holdings35
China GDP volumeLower growth rates but very strong in absolute volumesGDP Trillion RMB60GDP % Growth165014124010308206410202001 2002 2003 2004 2005 2006 2007 2008 2009 2010 2011 20120GDP% Growth36
Steel consumption per capitaChina has only just reached levels of consumption of developed countriesKg per capita90080070060050040030020010001900 1910 1920 1930 1940 1950 1960 1970 1980 1990 2000 2010China USA Japan Germany37Source: Macquarie
More Railway & Urban Subway Needed in Chinacm/per capita80706074• China has 126 cities>4 million peoplewith a dozenoperational subways5040514146• RMB2 trillioninvestment in 4,300kilometers of subway30201069• Subway steelconsumption is threetimes higher thanrailway0China (2010) China (2015) German Italy France USRailway per capita per Centimetre38Source: Ministry of Railway, National Bureau of Statistics
Jul-10Aug-10Sep-10Oct-10Nov-10Dec-10Jan-11Feb-11Mar-11Apr-11May-11Jun-11Jul-11Aug-11Sep-11Oct-11Nov-11Dec-11Jan-12Feb-12Mar-12Apr-12May-12Jun-12Jul-12Aug-12Sep-12Oct-12Nov-12Dec-12Jan-13Feb-13Mar-13Apr-13May-13Jun-13Jul-13Aug-13Sep-13Oct-13History shows price volatilityStrong rebounds follow price drops$200Iron Ore Price (62% Fe CFR - Platts IODEX China)$190$180$170$160$150$140$130$120$110$100$90$8039
Trends reinforce seaborne advantageNew super mills built to capitalise on seaborne trade• 460 mills – 51% privateowned• 35 iron ore coastal ports• Coastal mines highestcost• New ~10mtpa TonkinGulf Baosteel, Wisco andFormosa Ha Tinh (22mtpa)super mills• 88% steel produced inH1-CY13 from Easternseaboard and YangtzeRiverprovinces40
US$/dry tonne<strong>Fortescue</strong>Moving down the global cost curveTargeting bottom quartile200Domestic Chinese OreOctober 2013 CFR Cost of China's Iron Ore Supply – August 2013(including royalties & freight)AustraliaBrazil150IndiaSouth AfricaOther1005000 100 200 300 400 500 600 700 800 900 1,000 1,100Cumulative Mt (wet, as delivered)41
Making a difference<strong>Fortescue</strong> is changing lives through training and employment46612%472$1.3bnDirect AboriginalemployeesAboriginal people in<strong>Fortescue</strong> workforceAboriginal peopleemployed by contractorsContracts awarded toAboriginal companiesand joint ventures42
Delivering on targetsStrong financial resultsExpansion to 155mtpaImproved liquidity reduces net debtwith repayments in 2013Move to a dividend pay outratioFlexible incremental growthUnique culture drivesperformance43
Proudly supporting:Sign up to alerts online: www.fmgl.com.au
GlossaryDefinition of non-IFRS termsEBITDAProfit before income tax adjusted for depreciation and amortisation, impairment expense, other write offs, netfinance costs and gain on refinancing.Return on equityProfit for the year after income tax divided by total equity.Return on assets employedProfit for the year after income tax divided by average total assets excluding cash and cash equivalents.Earnings per share (EPS)Profit for the year after income tax divided by undiluted weighted average ordinary shares.Cash flow per share (CFPS)Net cash inflows from operating activities divided by undiluted weighted average ordinary shares.45