“rhodes” traffic-adaptive control systems - Traffic Signal Systems ...
“rhodes” traffic-adaptive control systems - Traffic Signal Systems ...
“rhodes” traffic-adaptive control systems - Traffic Signal Systems ...
Create successful ePaper yourself
Turn your PDF publications into a flip-book with our unique Google optimized e-Paper software.
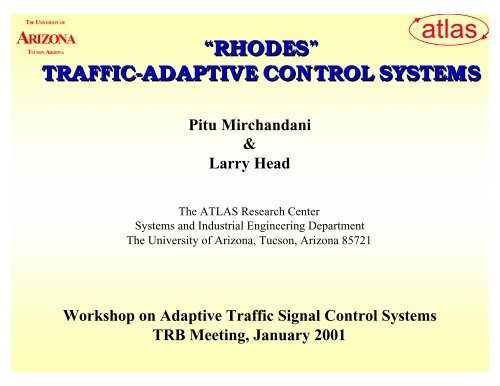
THE UNIVERSITY OFARIZONATUCSON, ARIZONAatlas“RHODES”TRAFFIC-ADAPTIVE CONTROL SYSTEMSPitu Mirchandani&Larry HeadThe ATLAS Research Center<strong>Systems</strong> and Industrial Engineering DepartmentThe University of Arizona, Tucson, Arizona 85721Workshop on Adaptive <strong>Traffic</strong> <strong>Signal</strong> Control <strong>Systems</strong>TRB Meeting, January 2001
THE UNIVERSITY OFARIZONATUCSON, ARIZONAWhat is an “Adaptive” Control System?atlasIt is necessarily a “Feedback Control System” that “Adapts”Adaptive Control SystemdataMeasurements:monitoring state of systemFeedback& decisionsActual SystemControls:Actuators
THE UNIVERSITY OFARIZONATUCSON, ARIZONAAn “Adaptive” <strong>Traffic</strong> Control System?atlasAdaptive <strong>Traffic</strong> <strong>Signal</strong> Control SystemrawdataFeedback& decisionsMeasurements: detectors &signalsActuators: signals
THE UNIVERSITY OFARIZONATUCSON, ARIZONAQuality Attributes of an“Adaptive” <strong>Traffic</strong> <strong>Signal</strong> Control System?atlas
THE UNIVERSITY OFARIZONATUCSON, ARIZONAQuality Attributes of an“Adaptive” <strong>Traffic</strong> <strong>Signal</strong> Control System?Responsiveness:How fast does it respond to changes in <strong>traffic</strong> conditions?(including incidents and special events)atlas
THE UNIVERSITY OFARIZONATUCSON, ARIZONAQuality Attributes of an“Adaptive” <strong>Traffic</strong> <strong>Signal</strong> Control System?Responsiveness:How fast does it respond to changes in <strong>traffic</strong> conditions?(including incidents and special events)Feedback Philosophy:Is it reactive? (the “vanilla” version)Is it proactive? (the “sundae” version)atlas
THE UNIVERSITY OFARIZONATUCSON, ARIZONAQuality Attributes of an“Adaptive” <strong>Traffic</strong> <strong>Signal</strong> Control System?Responsiveness:How fast does it respond to changes in <strong>traffic</strong> conditions?(including incidents and special events)Feedback Philosophy:Is it reactive? (the “vanilla” version)Is it proactive? (the “sundae” version)Installation and Maintenance Cost:Are the various “benefits” worth the costs?atlas
THE UNIVERSITY OFARIZONATUCSON, ARIZONAPosition“Open-loop”, “Reactive” and “Proactive”(Illustration in following a trajectory)atlasActual TrajectoryTime
THE UNIVERSITY OFARIZONATUCSON, ARIZONAPosition“Open-loop”, “Reactive” and “Proactive”(Illustration in following a trajectory)atlasActual TrajectoryOpen LoopTime
THE UNIVERSITY OFARIZONATUCSON, ARIZONA“Open-loop”, “Reactive” and “Proactive”(Illustration in following a trajectory)PositionReactiveatlasActual TrajectoryOpen LoopTime
THE UNIVERSITY OFARIZONATUCSON, ARIZONAPosition“Open-loop”, “Reactive” and “Proactive”(Illustration in following a trajectory)atlasActual TrajectoryReactiveOpen LoopProactiveTime
THE UNIVERSITY OFARIZONATUCSON, ARIZONARHODES (U. Arizona)THE GENERAL IDEAatlas
THE UNIVERSITY OFARIZONATUCSON, ARIZONARHODES (U. Arizona)THE GENERAL IDEAExogenous inputsatlasu(t)Real-Worldx(t)y(t)SensorsMeasurement noise
THE UNIVERSITY OFARIZONATUCSON, ARIZONARHODES (U. Arizona)THE GENERAL IDEAExogenous inputsatlasu(t)Real-Worldx(t)x(t)ModelEstimationy(t)SensorsMeasurement noise
THE UNIVERSITY OFARIZONATUCSON, ARIZONARHODES (U. Arizona)THE GENERAL IDEAExogenous inputsatlasModelOptimizationu(t)Real-Worldx(t)x(t)ModelEstimationy(t)SensorsMeasurement noise
THE UNIVERSITY OFARIZONATUCSON, ARIZONASENSORSatlasINDUCTIVELOOP DETECTORSOTHERS• VIDEO DETECTORS• SONAR DETECTORS• RADAR DETECTORS
THE UNIVERSITY OFARIZONATUCSON, ARIZONACONTROLSatlasTRAFFICSIGNALS
THE UNIVERSITY OFARIZONATUCSON, ARIZONAOTHER CONTROLSatlasRAMP METERS
THE UNIVERSITY OFARIZONATUCSON, ARIZONARHODES (U. Arizona)atlas• RHODES uses three-level hierarchy for characterizing andmanaging <strong>traffic</strong>.
THE UNIVERSITY OFARIZONATUCSON, ARIZONARHODES (U. Arizona)atlas• RHODES uses three-level hierarchy for characterizing andmanaging <strong>traffic</strong>.• RHODES explicitly predicts <strong>traffic</strong> at these levels utilizingdetector and other sensor information.
THE UNIVERSITY OFARIZONATUCSON, ARIZONARHODES (U. Arizona)atlas• RHODES uses three-level hierarchy for characterizing andmanaging <strong>traffic</strong>.• RHODES explicitly predicts <strong>traffic</strong> at these levels utilizingdetector and other sensor information.• RHODES requires(a) lane <strong>traffic</strong> data (e.g., through detectorization),(b) real-time communication to/from processors, and(c) PC-level computational capability.
THE UNIVERSITY OFARIZONATUCSON, ARIZONARHODES: Logical ArchitectureatlasScenarioOrigins/DestinationsHistorical/Infrastructure DataDestinations/OriginsNetwork LoadControlNetworkLoadsCurrent Capacities, Travel Times,Network Disruptions(minutes/hours/days)Network LoadEstimator/PredictorNetwork FlowControlPlatoon Flow Prediction(minutes)Network FlowEstimator/PredictorTargetTimingsActualTimingsIntersectionControlVehicle Flow Prediction(seconds)Intersection FlowEstimator/PredictorControl<strong>Signal</strong><strong>Traffic</strong> <strong>Signal</strong>ActivationATISActual TravelBehavior and <strong>Traffic</strong>Detectors andSurveillancey(t)MeasurementsReference: Head, Mirchandani, Sheppard, 1992
THE UNIVERSITY OFARIZONATUCSON, ARIZONASimplified Architecture for RHODESatlasPrediction of queues and arrivalsrawdataprocesseddataFeedback& decisionsDecisionSystemDetectors, <strong>traffic</strong> signals, and communicationPhaseDurationsCount detectorStop-bar detector
THE UNIVERSITY OFARIZONATUCSON, ARIZONAPREDICTION OFARRIVALS AND QUEUESatlasPREDICTarrivals&queuesCONTROLALGORITHMSTURN RATIOSTRAVEL TIMESDISCHARGERATESdetectors
THE UNIVERSITY OFARIZONATUCSON, ARIZONAINTERSECTION PREDICTIONatlascardetector
THE UNIVERSITY OFARIZONATUCSON, ARIZONAPREDICTION OFARRIVALS AND QUEUESatlasReference: Head, 1995.
THE UNIVERSITY OFARIZONATUCSON, ARIZONANOW THE CONTROL STRATEGYatlasPREDICTarrivals&queuesCONTROLALGORITHMSTURN RATIOSTRAVEL TIMESDISCHARGERATESdetectors
THE UNIVERSITY OFARIZONATUCSON, ARIZONAINTERSECTION CONTROL LOGICatlas• Efficient DP OptimizationEffectively, the algorithm determines:– for a given Phase Order A,B,C,D,A,B,C,D...– what time durations should be given to Phase A,Phase B, ..., etc.– considers a given decision time horizon T, with timeincrements of 1 sec.
THE UNIVERSITY OFARIZONATUCSON, ARIZONAThe DP Algorithmatlas• Decision variable: x j (phase duration of stage j)• Optimization state variable: s j (time horizon with stage j)• Incremental Value of Objective Function: f(s j , x j )• Cumulative Value of Objective Function: V j -1(s j-1 )V j (s j ) = min{f(s j , x j )+V j-1 (s j-1 ) | xj ∈ X j }
THE UNIVERSITY OFARIZONATUCSON, ARIZONAINTERSECTION CONTROL LOGICatlas• Efficient DP Optimization• Allows various objectives: stops, delays,queues• Implementable in real-time• Easily accommodates operational constraints:– minimum green times– fixed/variable phase sequence– coordination
THE UNIVERSITY OFARIZONATUCSON, ARIZONAatlasINTERSECTION CONTROL SUBSYTEMPREDICTarrivals&queuesCONTROLALGORITHMSTURN RATIOSTRAVEL TIMESDISCHARGERATESdetectors
THE UNIVERSITY OFARIZONATUCSON, ARIZONATURN RATIO ESTIMATIONatlas1. Based on Dynamic OD Estimation2. Short Time (5 minute)3. <strong>Traffic</strong> Counts by Phases4. Lanes and Geometry Dependent5. Uses a Generalized Least Square
THE UNIVERSITY OFARIZONATUCSON, ARIZONAExample Scenarioatlas• Exclusive Left Turn Lanes• Needs Entering/Exiting <strong>Traffic</strong> Counts
THE UNIVERSITY OFARIZONATUCSON, ARIZONASimulation with CORSIM usingRHODES TM for Example ScenarioatlasApproach-1-left turn movementturning proportion0.70.60.50.40.30.20.10algorithm's predictionactual three cycle'saverage241754118716642155260032693787443350305929time
THE UNIVERSITY OFARIZONATUCSON, ARIZONAThrough movement estimationatlasApproach-1-through movementturning proportion1.210.80.60.40.20algorithm's predictionthree cycle's average241754118716642155260032693787443350305929time
THE UNIVERSITY OFARIZONATUCSON, ARIZONAatlasINTERSECTION CONTROL SUBSYTEMPREDICTarrivals&queuesCONTROLALGORITHMSTURN RATIOSTRAVEL TIMESDISCHARGERATESdetectors
THE UNIVERSITY OFARIZONATUCSON, ARIZONATRAVEL TIME ESTIMATIONatlas1. Based on Platoon Identification2. By measuring Platoon Departure andArrival TimesdistanceTraveltimetime
THE UNIVERSITY OFARIZONATUCSON, ARIZONAatlasINTERSECTION CONTROL SUBSYTEMPREDICTarrivals&queuesCONTROLALGORITHMSTURN RATIOSTRAVEL TIMESDISCHARGERATESdetectors
THE UNIVERSITY OFARIZONATUCSON, ARIZONANOTE: TO ESTIMATE QUEUESQ(t+1) = Q(t) + a(t) -d(t)a(t) - count from passage detectord(t) - depends on signal & departure ratesatlasarrivalsa(t)queueQ(t)d(t)departuresPassageDetectorsPresenceDetectors
THE UNIVERSITY OFARIZONATUCSON, ARIZONAQUEUE DISCHARGE RATEESTIMATION• Driver’s queue discharge rate reflects thedriver behavior at that location• Accuracy of the queue estimates, such asthe queue discharge rate, impacts the<strong>adaptive</strong>ness of RHODES TM• We use exponential smoothing to have arunning estimate of queue discharge rateatlas
THE UNIVERSITY OFARIZONATUCSON, ARIZONASummarizingIntersection Control Decision-MakingatlasConstraints include:- minimum green times- phase sequence requirement- coordinationConstraintsDynamicOptimizationPredictorsInitial QueuesFuture Arrivals<strong>Traffic</strong> FlowModel<strong>Traffic</strong> Flow Parameters- start-up loss time- queue discharge rates- right-on-red rate- permitted left turn rate- turning proportions
THE UNIVERSITY OFARIZONATUCSON, ARIZONAatlasNETWORK FLOW CONTROL SUBSYSTEMAPRES-NETarrivals&queuesREALBANDINTERSECTION CONTROL SUBSYTEMPREDICTarrivals&queuesCONTROL ALGORITHMSDISCHARGERATESTRAVEL TIMESTURN RATIOSdetectors
THE UNIVERSITY OFARIZONATUCSON, ARIZONAREALBANDS (of platoons)atlasBasically:Propagate platoons by APRES-NETand optimize by REALBANDW2NEWSSDistanceS1W3Intersection 1E3E223W2W3NConflict 1W3SE3Intersection 2Conflict 2Intersection 3E2NTimeNE3Crossroad 2Crossroad 3
THE UNIVERSITY OFARIZONATUCSON, ARIZONAREALBAND and APRESNETREALBAND and APRESNET(Dell ‘Olmo and Mirchandani, 1995)atlas• APRES-NET: Model for predicting the flow ofvehicles/platoons and evaluating the performanceof each platoon conflict.• REALBAND: Builds a binary decision tree forplatoon conflicts.• REALBAND provides “band” constraints tointersection DP for coordination.
THE UNIVERSITY OFARIZONATUCSON, ARIZONAREALBAND and APRES-NETBinary Decision TreeatlasConflict 1.1Conflict 1.1.1Performance(e.g. Delay)180 sec.Conflict 1.1.2120 sec.Conflict 1Conflict 1.2.190 sec.*Conflict 1.2Conflict 1.2.2240 sec.
THE UNIVERSITY OFARIZONATUCSON, ARIZONAOTHER “ADAPTIVE” FEATURESatlasNETWORK FLOW CONTROL SUBSYSTEMAPRES-NETarrivals&queuesREALBANDINTERSECTION CONTROL SUBSYTEMPREDICTarrivals&queuesCONTROL ALGORITHMSDISCHARGERATESTRAVEL TIMESdetectorsTURN RATIOS
THE UNIVERSITY OFARIZONATUCSON, ARIZONAOTHER “ADAPTIVE” FEATURESatlasTransit/bus Priority(position and “weight”)NETWORK FLOW CONTROL SUBSYSTEMAPRES-NETarrivals&queuesREALBANDINTERSECTION CONTROL SUBSYTEMPREDICTarrivals&queuesCONTROL ALGORITHMSDISCHARGERATESTRAVEL TIMESdetectorsTURN RATIOS
THE UNIVERSITY OFARIZONATUCSON, ARIZONAOTHER “ADAPTIVE” FEATURESatlasTransit/bus Priority(position and “weight”)Emergency vehicles(route constraints)NETWORK FLOW CONTROL SUBSYSTEMAPRES-NETarrivals&queuesREALBANDINTERSECTION CONTROL SUBSYTEMPREDICTarrivals&queuesCONTROL ALGORITHMSDISCHARGERATESTRAVEL TIMESdetectorsTURN RATIOS
THE UNIVERSITY OFARIZONATUCSON, ARIZONAOTHER “ADAPTIVE” FEATURESatlasTransit/bus Priority(position and “weight”)Train movement(position and schedule)Emergency vehicles(route constraints)NETWORK FLOW CONTROL SUBSYSTEMAPRES-NETarrivals&queuesREALBANDINTERSECTION CONTROL SUBSYTEMPREDICTarrivals&queuesCONTROL ALGORITHMSDISCHARGERATESTRAVEL TIMESdetectorsTURN RATIOS
THE UNIVERSITY OFARIZONATUCSON, ARIZONAEXPECTED PERFORMANCEatlas
THE UNIVERSITY OFARIZONATUCSON, ARIZONASIMULATION EVALUATION OFRHODES REAL-TIME TRAFFIC CONTROLatlasRHODESModel/AlgorithmsignalsdetectorsCORSIMModel
THE UNIVERSITY OFARIZONATUCSON, ARIZONAatlasSIMULATION EVALUATION OFRHODES REAL-TIME INTERSECTION CONTROLRHODESModel/AlgorithmsignalsdetectorsCORSIMModelCORSIM Model• Assumes- <strong>Traffic</strong> behavior(lane following, discharge rates, etc)- No re-routing• Scenario input:Geometrics, <strong>traffic</strong> demand, turningratios, discharge rates• Simulates second-at-a-time(not nec. real-time)
THE UNIVERSITY OFARIZONATUCSON, ARIZONAatlasSIMULATION EVALUATION OFRHODES REAL-TIME INTERSECTION CONTROLRHODES-IntersectionModel/AlgorithmRHODES Model/AlgorithmIndependently estimates• <strong>traffic</strong> demand• turning ratios• discharge ratesanddecides signal settingsfor next few secondswithin a secondsignalsdetectorsCORSIMModelCORSIM Model• Assumes- <strong>Traffic</strong> behavior(lane following, discharge rates, etc)- No re-routing• Scenario input:Geometrics, <strong>traffic</strong> demand, turningratios, discharge rates• Simulates second-at-a-time(not nec. real-time)
THE UNIVERSITY OFARIZONATUCSON, ARIZONAPerformance - Simulation (Atlanta(Atlanta)atlas
THE UNIVERSITY OFARIZONATUCSON, ARIZONAPerformance - Simulation (Atlanta(Atlanta)atlas
THE UNIVERSITY OFARIZONATUCSON, ARIZONAEXPECTED BENEFITSatlas
THE UNIVERSITY OFARIZONAatlasTUCSON, ARIZONAEXPECTED BENEFITS– Improvement in <strong>traffic</strong> performance• responds to recurrent congestion• responds to incidents (through “learning”)
THE UNIVERSITY OFARIZONAatlasTUCSON, ARIZONAEXPECTED BENEFITS– Improvement in <strong>traffic</strong> performance• responds to recurrent congestion• responds to incidents (through “learning”)– Decrease in “<strong>traffic</strong> operations” effort• operators need not “time” signals periodically
THE UNIVERSITY OFARIZONAatlasTUCSON, ARIZONAEXPECTED BENEFITS– Improvement in <strong>traffic</strong> performance• responds to recurrent congestion• responds to incidents (through “learning”)– Decrease in “<strong>traffic</strong> operations” effort• operators need not “time” signals periodically– Clear interface with Transit/Emergency/Rail• allows for transit priority at intersections• allows for preemption for emergency vehiclesand railway.
THE UNIVERSITY OFARIZONATUCSON, ARIZONAatlas


