Using relative abundance indices from camera-trapping to test ...
Using relative abundance indices from camera-trapping to test ...
Using relative abundance indices from camera-trapping to test ...

You also want an ePaper? Increase the reach of your titles
YUMPU automatically turns print PDFs into web optimized ePapers that Google loves.
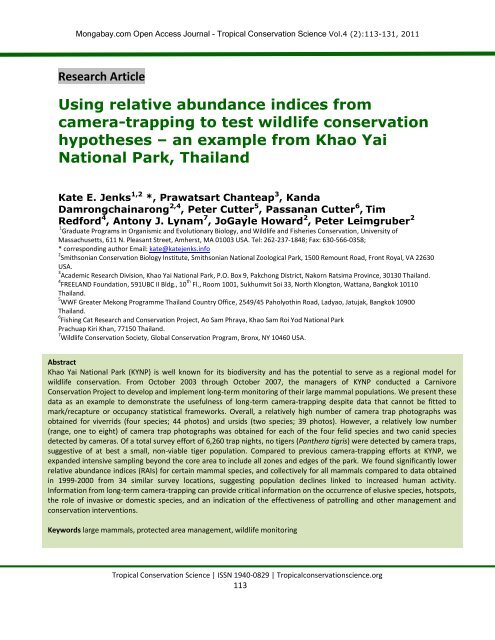
Mongabay.com Open Access Journal - Tropical Conservation Science Vol.4 (2):113-131, 2011Received: 10 January 2011; Accepted: 17 April 2011; Published: 27 June 2011.Copyright: © Kate E. Jenks, Prawatsart Chanteap, Kanda Damrongchainarong, Peter Cutter, Passanan Cutter, Tim Redford,An<strong>to</strong>ny J. Lynam, JoGayle Howard, Peter Leimgruber. This is an open access paper. We use the Creative CommonsAttribution 3.0 license http://creativecommons.org/licenses/by/3.0/ - The license permits any user <strong>to</strong> download, print out,extract, archive, and distribute the article, so long as appropriate credit is given <strong>to</strong> the authors and source of the work. Thelicense ensures that the published article will be as widely available as possible and that the article can be included in anyscientific archive. Open Access authors retain the copyrights of their papers. Open access is a property of individual works,not necessarily journals or publishers.Cite this paper as: Jenks, K. E., Chanteap, P., Damrongchainarong, K., Cutter, P., Cutter, P., Redford, T., Lynam, A. J.,Howard, J., and Leimgruber, P. 2011. <strong>Using</strong> <strong>relative</strong> <strong>abundance</strong> <strong>indices</strong> <strong>from</strong> <strong>camera</strong>-<strong>trapping</strong> <strong>to</strong> <strong>test</strong> wildlife conservationhypotheses – an example <strong>from</strong> Khao Yai National Park, Thailand. Tropical Conservation Science Vol. 4 (2):113-131. Availableonline: www.tropicalconservationscience.orgIntroductionCamera-<strong>trapping</strong> has long been used <strong>to</strong> survey for and moni<strong>to</strong>r the occurrence of wildlife species aroundthe world [e.g., 1-5]. Much attention has been focused on using <strong>camera</strong>-<strong>trapping</strong> <strong>to</strong> detect otherwiseelusive species, including charismatic examples such as tigers (Panthera tigris) [e.g. 1], snow leopards(Panthera uncia) [e.g., 2], and giant pandas (Ailuropoda melanoleuca) [3]. Initially, much of this <strong>camera</strong><strong>trapping</strong>was <strong>relative</strong>ly untargeted and data collection was not standardized. Over time, these effortshave been replaced by more systematic sampling approaches, often centered on identifying individualanimals in a mark-recapture framework [e.g., 1-2], or using patch-occupancy approaches <strong>to</strong> assessdetection probabilities for species presence/absence [e.g., 4]. However, pho<strong>to</strong>s collected by lessstatistically sound sampling designs may still provide large amounts of useful data. The sheer volumeand importance of this data is exemplified by a new internet site hosted by the Smithsonian Institution,where <strong>camera</strong>-trappers <strong>from</strong> around the world, including a wide range of contribu<strong>to</strong>rs <strong>from</strong> scientists <strong>to</strong>the general public, can post their pho<strong>to</strong>s and data (http://siwild.si.edu). <strong>Using</strong> the example of Khao YaiNational Park (KYNP) in Thailand, we illustrate the value and usefulness of <strong>camera</strong> trap pho<strong>to</strong>s <strong>from</strong>generic moni<strong>to</strong>ring surveys. Camera traps can indicate <strong>relative</strong> <strong>abundance</strong> of a species with theassumption that pho<strong>to</strong> detection rates are related <strong>to</strong> animal <strong>abundance</strong> [5]. We used moni<strong>to</strong>ring dataobtained by ranger-based surveys <strong>to</strong> 1) assess <strong>relative</strong> <strong>abundance</strong> <strong>indices</strong> (RAIs) for important wildlifespecies, 2) calculate what <strong>camera</strong>-<strong>trapping</strong> effort may be necessary <strong>to</strong> detect most large-mammalspecies <strong>to</strong> assess a sampling/moni<strong>to</strong>ring strategy, and 3) identify how these data can be used <strong>to</strong>delineate carnivore hotspots for special management and protection inside protected areas.KYNP is Thailand’s first national park, established in 1962, and covers 2,168 km 2 . It has been the focus ofa few long-term wildlife moni<strong>to</strong>ring programs [6-7], and has the potential <strong>to</strong> represent a regional modelfor wildlife management because of its status as one of the largest national parks in Thailand’s system ofprotected areas, its importance <strong>to</strong> the Thai people [8], and its status as part of the Dong Phayayen-KhaoYai Forest Complex (DPKYC), a UNESCO World Heritage site [9]. The DPKYC includes five protected areasTropical Conservation Science | ISSN 1940-0829 | Tropicalconservationscience.org114
Mongabay.com Open Access Journal - Tropical Conservation Science Vol.4 (2):113-131, 2011<strong>to</strong>taling 6,155 km 2 of natural habitat supporting significant biodiversity components for Thailand,potentially including 391 bird and 60 mammal species [10]. Of the mammal species found within thecomplex, 46 species have been documented within KYNP. There have been detailed studies in KYNPproviding valuable information on carnivore species, including tiger, leopard cat (Prionailurusbengalensis), and clouded leopard (Neofelis nebulosa) [11-15]. However, many of KYNP’s mammalianspecies are understudied and information about them was obtained secondhand, often as part of tigersurveys.We present KYNP as an example <strong>to</strong> demonstrate how basic and continued wildlife moni<strong>to</strong>ring usingstandard <strong>camera</strong>-<strong>trapping</strong> can be used as an integral <strong>to</strong>ol for park management and anti-poachingefforts in protected areas of the region. We use the data <strong>to</strong> assess the spatial distribution of wildlife andidentify potential conservation hotspots for carnivores. Such moni<strong>to</strong>ring will prove extremely useful forsite-level efforts <strong>to</strong> combat poaching and illegal wildlife trade. It can also provide baseline data forsubsequent targeted studies using more specialized sampling and study designs such as mark/recaptureand patch occupancy.MethodsStudy areaSurveys were conducted in KYNP (14°26’29’’N; 101°22’11’’E) at the western edge of the DPKYC,Thailand. Elevation at KYNP ranges <strong>from</strong> 100 m <strong>to</strong> 1,350 m. The climate is monsoonal, with distinctivewet (Jun.-Sep.), cool (Oct.-Jan.), and dry (Feb.-May) seasons. Annual rainfall is 2,270 mm; mean annualtemperature is 27°C. More than 80 percent of the park is forested. Vegetation types include tropicalrainforest, dry evergreen forest, hill evergreen forest, mixed deciduous forest, dry dipterocarp forest,and grassland [16]. Mixed deciduous forest is the dominant type with hill and dry evergreen fores<strong>to</strong>ccupying higher elevations.Zone-based moni<strong>to</strong>ring and seasonal data collectionA moni<strong>to</strong>ring team of KYNP park rangers conducted the field surveys. The rangers were selectedfollowing a 12-day training course for rangers <strong>from</strong> DPKYC. During the course, participants werechallenged with <strong>to</strong>pics covering the scope of the field research process, <strong>from</strong> planning field surveys, <strong>to</strong>systematic data collection and reporting of data, and adapting future survey plans based on findings.The course covered wildlife moni<strong>to</strong>ring techniques including line transect surveys and <strong>camera</strong> traps <strong>to</strong>increase the capacity of park rangers for biodiversity moni<strong>to</strong>ring.Camera trap surveys were conducted <strong>from</strong> Oc<strong>to</strong>ber 2003 through March 2007 with sampling conductedin each of KYNP’s 22 management zones (Fig. 1). Management zones are of unequal size andapproximately follow watershed boundaries. Teams surveyed two zones per month. We randomlyselected survey zones each month, but ensured that all zones were moni<strong>to</strong>red at least once during thestudy. We randomly chose four zones (KY04, KY15, KY18 and KY20) for repeated data collection acrosseach season. We could only repeat four zones in each season because of time and staff constraints. Therepeated data collection of four management zones did not involve replicated <strong>camera</strong> sample locations;rather, new randomly selected grid-squares were chosen.Tropical Conservation Science | ISSN 1940-0829 | Tropicalconservationscience.org115
Mongabay.com Open Access Journal - Tropical Conservation Science Vol.4 (2):113-131, 2011Fig 1. Khao Yai National Park (KYNP) is divided in<strong>to</strong> 22 management zones that were used formoni<strong>to</strong>ring. Locations of <strong>camera</strong> traps (n=217) are indicated by black dots. Inset: KYNP is at thewestern side of the Dong Phayayen-Khao Yai Forest Complex (DPKYC) in central Thailand.Camera-<strong>trapping</strong>To detect and record wildlife, we employed 15 <strong>camera</strong> traps (CamTrakker ® CamTrak South, Inc.,Watkinsville, GA 30677 USA) with an infrared sensor <strong>to</strong> detect animal movement. Camera traps did havevisible flash which may have been detected by wildlife or people. During each month, four <strong>to</strong> eight<strong>camera</strong> traps were placed in each of the two survey zones dependent on the number of working<strong>camera</strong>s. We divided survey zones in<strong>to</strong> 1-km 2 blocks and randomly chose blocks for <strong>camera</strong> locations.Within the block, teams set up <strong>camera</strong> traps along wildlife trails and stream beds. Thirty-four samplinglocations were chosen because they had been used by a previous moni<strong>to</strong>ring program [13] andtherefore we were interested in comparing our results with that study. We aimed <strong>to</strong> leave <strong>camera</strong> trapsin the forest for three weeks since previous experience with this model [13] indicated this was theexpected life of the batteries. Due <strong>to</strong> work schedule conflicts, <strong>camera</strong>s were often picked up earlier orlater, but were only retrieved after a minimum of 21 days. We conducted <strong>camera</strong> surveys at 217locations (Fig. 1), resulting in 6,260 trap nights. Camera traps at an additional 44 locations did not yielddata because they malfunctioned or were s<strong>to</strong>len, lost, or damaged by weather, elephants (Elephasmaximus), or poachers.Tropical Conservation Science | ISSN 1940-0829 | Tropicalconservationscience.org116
Mongabay.com Open Access Journal - Tropical Conservation Science Vol.4 (2):113-131, 2011All <strong>camera</strong> traps were operational 24 hours per day, recorded time and date for each exposure, and hada 20-second delay between pho<strong>to</strong>graphs. We placed <strong>camera</strong> traps on a tree ~50 cm <strong>from</strong> the groundand 1-2 m <strong>from</strong> the moni<strong>to</strong>ring area. We aimed the sensor parallel <strong>to</strong> the ground <strong>to</strong> moni<strong>to</strong>r a conicalarea approximately 1 m in diameter at 10 m distance. We report number of animal detections and anRAI for each species. To compute the RAI for each species, all detections for each species are summedfor all <strong>camera</strong> traps over all days, multiplied by 100, and divided by the <strong>to</strong>tal number of <strong>camera</strong> trapnights. We calculated RAI for each species as the number of pho<strong>to</strong> captures per 100 trap nights <strong>to</strong>facilitate comparisons with previous studies at the same site [13] and other parts of the region. Animaldetections were considered independent if the time between consecutive pho<strong>to</strong>graphs of the samespecies was more than 0.5 hours apart, a convention which follows O’Brien et. al. [17]. Rather thanidentifying individuals, our focus was on comparing pho<strong>to</strong> rates between areas and seasons, so thearbitrary time between independent pho<strong>to</strong>s should not introduce bias <strong>to</strong>ward either one of thesefac<strong>to</strong>rs. Furthermore, this time of independence was used for data collection during a previous survey[13]. Pho<strong>to</strong>s with more than one individual in the frame were counted as one detection for the species.To evaluate the effect of season on wildlife RAIs, we used a Kruskal-Wallis <strong>test</strong>. For analyzing differencesin mammal RAIs between the edge of the park (< 5 km <strong>from</strong> boundary) and the park’s interior (≥ 5 km<strong>from</strong> boundary), we performed a two-sample t-<strong>test</strong>. Five kilometers was chosen for a buffer because itfalls between the maximum distance <strong>from</strong> the edge and mean distance <strong>from</strong> the edge that domesticdogs were detected and serves as a proxy for the penetration of human-disturbance <strong>from</strong> the forestedge. To quantify the optimal number of <strong>camera</strong> trap locations (i.e., how many locations needed <strong>to</strong> besampled <strong>to</strong> capture most of the diversity of KYNP), we plotted mammal species detected against samplelocations and fitted a hyperbola curve. We repeated this analysis <strong>to</strong> obtain species accumulation curvesfor carnivores only and other mammal species, respectively. To understand the time required <strong>to</strong> detectmammals if they are present at a sampling location, we plotted the frequency distribution of nights <strong>to</strong>first detection for carnivore or non-carnivore species and used curve fitting <strong>to</strong> determine the peak. Allcurve fitting was done using SigmaPlot 10.0 (Systat Software, Point Richmond, CA).To offer a baseline <strong>to</strong> interpret our <strong>camera</strong>-<strong>trapping</strong> results, we compared our RAIs for all pho<strong>to</strong>graphedspecies <strong>to</strong> data <strong>from</strong> <strong>camera</strong>-<strong>trapping</strong> surveys done at KYNP during 1999-2000 [13]. It is difficult <strong>to</strong>compare RAIs between projects because of differences in detection probabilities at different locations;therefore, we only included sample locations that we could pair directly with locations <strong>from</strong> theprevious survey (located < 2.5 km apart; n = 34 pairs). We performed a Wilcoxon signed-rank <strong>test</strong> <strong>to</strong> <strong>test</strong>the null hypothesis that there is no difference in a species’ RAI between our current surveys and thesurveys conducted four <strong>to</strong> six years previously.Camera traps also recorded human traffic (rangers, visi<strong>to</strong>rs, poachers, villagers) and domestic dogs.Poachers were identified if they were carrying a gun, a carcass, or animal parts, a bag <strong>to</strong> transport plantmaterial/tree bark, or were accompanied by a dog.Spatial modelingTo assess the spatial distribution of all wildlife qualitatively, we selected a-priori environmental fac<strong>to</strong>rs<strong>to</strong> investigate their effect on wildlife spatial distribution. The environmental fac<strong>to</strong>rs included distance(m) <strong>to</strong> nearest human or domestic dog pho<strong>to</strong> detection (Intruder), distance (m) <strong>to</strong> nearest ranger (Staff),distance (m) <strong>to</strong> nearest poacher, villager, or domestic dog (NonStaff), distance (m) <strong>to</strong> park boundary(Edge), and elevation (m; Elev). We used ArcGIS 9.2 Spatial Analyst, a Geographic Information SystemTropical Conservation Science | ISSN 1940-0829 | Tropicalconservationscience.org117
Mongabay.com Open Access Journal - Tropical Conservation Science Vol.4 (2):113-131, 2011(GIS) software program developed by ESRI, <strong>to</strong> calculate all distances using the Euclidian distancefunction. Elevation was taken <strong>from</strong> a digital elevation map supplied by the park.We then used multiple logistic regression <strong>to</strong> explore the associations between the detection/nondetectiondata for wildlife as the dependent variable and the five environmental fac<strong>to</strong>rs as theindependent variables. We used an information-theoretic approach and Akaike’s Information Criterion(AIC) <strong>to</strong> choose the model with the highest likelihood value and <strong>to</strong> weight (through model averaging) the<strong>relative</strong> likelihoods (importance) of the different predic<strong>to</strong>r variables. We divided the data set in<strong>to</strong> a 75percent training subset and a 25 percent <strong>test</strong>ing subset, which resulted in 144 wildlife detections <strong>from</strong>215 survey locations (two survey locations were dropped due <strong>to</strong> incorrect GPS locations that were notlocated within the park).We created a predictive occurrence map in ArcGIS using map algebra in the Spatial Analyst rastercalcula<strong>to</strong>r. To delineate areas with better than by chance prediction of wildlife, we used a-prioriprevalence values (144 wildlife detection locations out of 215 <strong>to</strong>tal locations) as the “presence”threshold (0.67 detection). We calculated the classification accuracy of the model using the <strong>test</strong>ingsubset in a contingency table.ResultsSpecies accumulation, sampling effort, and trap nightsCamera traps recorded 650 pho<strong>to</strong>graphs, of which 19.8% (n = 129) were of carnivores, 42.8% (n = 278)were of non-carnivore mammals, 22.9% (n = 149) were of birds, 8.2% (n = 53) were of humans, and 2.6%(n = 17) were of domestic dogs. We could not determine species in 3.7% (n = 24) of the pho<strong>to</strong>graphs due<strong>to</strong> poor focus, lighting, or angle. Species captured on film included 26 mammals (14 carnivore species;12 non-carnivore mammal species; Appendix 1).RAIs did not differ among seasons (Kruskall-Wallis: 1.704, p = 0.427). Inspection of species accumulationcurves showed that the number of locations varied <strong>to</strong> capture 75 percent of non-carnivore mammals (23locations), all mammals (53 locations), and carnivore species (75 locations) at KYNP (Fig. 2a). Time(nights) <strong>to</strong> first detection showed a skewed distribution for detecting non-carnivores (max: 1.5 days) andcarnivore species (max: 2.7 days; Fig. 2b). After 14 days, 80 percent of all <strong>camera</strong> traps had captured atleast one mammal species (Fig. 2b). For individual species, days <strong>to</strong> first detection ranged <strong>from</strong> three(binturong [Arctictis binturong]) <strong>to</strong> 23 (palm civet [Paradoxurus hermaphroditus]; Fig. 3).CarnivoresBased on <strong>camera</strong>-<strong>trapping</strong>, we found 14 carnivore species in the park, including four viverrids, fourfelids, two canids, two ursids, one mustelid, and one herpestid (Appendix 1). Of these species, 10 weredocumented 10 times or less, and one species (dhole [Cuon alpinus]) is globally threatened(Endangered) [18; Appendix 1]. The number of pho<strong>to</strong>s per carnivore species ranged <strong>from</strong> one formarbled cat (Pardofelis marmorata; RAI = 0.02; Appendix 1) <strong>to</strong> 37 for large Indian civet (Viverra zibetha;RAI = 0.59; Appendix 1). Asiatic black bear (Ursus thibetanus; n = 21) was the second-most commoncarnivore species pho<strong>to</strong>graphed (Appendix 1). Camera traps did not detect tigers. The coat pattern ofthe clouded leopards that we observed in KYNP is similar <strong>to</strong> those of mainland Southeast Asian cloudedleopards and different <strong>from</strong> the clouded leopard (Neofelis diardi) on Borneo and Sumatra [19; Fig. 4].Tropical Conservation Science | ISSN 1940-0829 | Tropicalconservationscience.org118
Mongabay.com Open Access Journal - Tropical Conservation Science Vol.4 (2):113-131, 2011abFig. 2. Camera-<strong>trapping</strong> <strong>indices</strong> for species detection. Species accumulation curves <strong>to</strong> demonstrate the number ofsampling sites needed for 75 percent detection for all mammals, non-carnivore mammals, and carnivore species (a). Time<strong>to</strong> first detection for <strong>camera</strong> traps for detecting non-carnivore and carnivore species (b).Non-carnivorous mammalsBarking deer (Muntiacus muntjak; 60 pho<strong>to</strong>s) and Eurasian wild pig (Sus scrofa; 60 pho<strong>to</strong>s) were the twomost common herbivore species detected during <strong>camera</strong> trap surveys (Appendix 1).Fig. 3. Average day <strong>to</strong> firstpho<strong>to</strong>graphic detectionfor species in Thailand’sKhao Yai National Park.Tropical Conservation Science | ISSN 1940-0829 | Tropicalconservationscience.org119
Mongabay.com Open Access Journal - Tropical Conservation Science Vol.4 (2):113-131, 2011Table 2. Parameters of model chosen <strong>to</strong> predict wildlife presence at Khao YaiNational Park (n=150 training set observations).Coefficient Std. Error z value P valueIntercept0.09598650.30000460.3200.7690Elev0.00136120.00059082.3040.0212 *Significance code: 0.01 ‘*’ Elev = elevation (m)Our global model (before parameter selection) contained five co-variables. The best model fit includedElev (Table 1). Wildlife detections increased as elevation increased. We then produced a predictiveoccurrence map (Appendix 2f) <strong>from</strong> the logistic function of the chosen model (Table 2) and calculatedthe ability of the model <strong>to</strong> correctly predict wildlife presence for our sub-set of <strong>test</strong>ing data. Overall, themodel correctly predicted wildlife presence/absence at 60 percent of the 65 <strong>test</strong> locations used in theanalysis. The <strong>to</strong>tal area of predicted wildlife presence is 1,344 km 2 which amounts <strong>to</strong> 62 percent of the<strong>to</strong>tal park area.Comparison with previous KYNP dataSince differences in RAIs may be a result of a number of fac<strong>to</strong>rs including differences in detectionprobabilities between surveys, we report only the strongest differences in RAI as indication of truedifferences in species <strong>abundance</strong>. In comparison with past surveys by Lynam et al. [13] conducted in1999-2000, we detected a significant difference in clouded leopard (Z=-1.992, p=0.046), barking deer(Z=-2.939, p=0 .003), all combined mammals (Z=-2.671, p=0.008), and overall intruders (any humans anddomestic dogs; Z=-3.438, p=0.001; Appendix 3).DiscussionSpecies numbersOur project built on previous wildlife moni<strong>to</strong>ring in KYNP [13] by including formerly under-surveyedmanagement zones close <strong>to</strong> the boundary of the park. Camera-<strong>trapping</strong> is one moni<strong>to</strong>ring <strong>to</strong>ol available<strong>to</strong> park authorities for evaluating the occurrence of some medium-large mammals, and <strong>to</strong> estimate<strong>relative</strong> <strong>abundance</strong> patterns across management zones for species that are highly detectable by <strong>camera</strong>traps. Fourteen out of the 19 carnivore species previously confirmed for KYNP [10] were also detectedby our <strong>camera</strong> traps. We did not pho<strong>to</strong>graph small Indian civet (Viverricula malaccensis), masked palmcivet (Paguma larvata), yellow-throated marten (Martes flavigula), ferret-badger (Melogale sp.), ortiger. A previous moni<strong>to</strong>ring program [13] also did not detect these species (apart <strong>from</strong> tiger). Yellowthroatedmarten, masked palm civet, and ferret badgers are primarily arboreal, and so <strong>camera</strong> trapsmay not be effective in detecting these species. The small Indian civet was detected in one pho<strong>to</strong> in May2007 in the Headquarters Zone during a short <strong>camera</strong>-<strong>trapping</strong> survey outside of our main surveyefforts. While we did not obtain pho<strong>to</strong>graphic evidence of tigers, the last footprint evidence of tigeroccurrence in KYNP is a record documented with a plaster cast and pho<strong>to</strong>graph taken by our team in theHeadquarters Zone in Oc<strong>to</strong>ber 2005 (47P 0754639 1599044; Fig. 5). That tigers were not recorded by<strong>camera</strong>-<strong>trapping</strong> adds evidence <strong>to</strong> the notion that the species has disappeared <strong>from</strong> the park other thanTropical Conservation Science | ISSN 1940-0829 | Tropicalconservationscience.org121
Mongabay.com Open Access Journal - Tropical Conservation Science Vol.4 (2):113-131, 2011perhaps transient individuals. Additionally, we supplemented park records with detections of previouslyunrecorded rare and elusive species: the large-spotted civet (Viverra megaspila) and golden jackal.Wildlife distribution patternsDistribution patterns detected in our study indicate that wildlife <strong>relative</strong> <strong>abundance</strong> in KYNP issignificantly higher in central parts of the park than in marginal areas near park boundaries. This concurswith the findings of a previous study, which found that track encounter rates and <strong>camera</strong> trap rates formammals decline with increasing distance <strong>from</strong> the park headquarters <strong>to</strong>wards the park edge [13]. Asimilar pattern was documented for bears, elephants, and ungulate species in KYNP through universalkriging [20].Most carnivore species were not widely dispersed across sampling locations, but clustered in a fewlocations. Notably, we detected three felid species (leopard cat, golden cat, and marbled cat) with thesame <strong>camera</strong> in zone KY20, adjacent <strong>to</strong> the park Headquarters Zone. The survey location was along aridge-line which may have been a natural travel route for the felids. Additionally, the high elevation ofthe area may be less accessed by people, reducing human impacts. The three observations are inagreement with previous findings that small cat sympatry is the norm in Southeast Asian forests [e.g.,21-23]. These observations are of management interest because the presence of three wild felids mayindicate sufficient prey resources for all species, and/ or natural protection <strong>from</strong> humans that benefitsall species along the ridge of this management zone.Detecting poachers and domestic dogsCamera traps provided direct evidence of poaching including pho<strong>to</strong>s of individuals carrying turtles, birds,and other forest products, and/or carrying rifles at night using headlamps. Furthermore, nine <strong>camera</strong>traps were s<strong>to</strong>len or destroyed by poachers apparently concerned that they will be identified byauthorities. These events were concentrated along the eastern border of the park furthest <strong>from</strong> the parkheadquarters, indicating human pressures are grea<strong>test</strong> in management zones KY04, KY05, KY06, KY07,KY08 and KY09 (Appendix 2a). While a significant portion of the poaching in Khao Yai is still carried outby people who live in villages adjacent <strong>to</strong> the protected area, some of the poaching for aloewood(Aquilaria crassana) and wildlife is carried out by Cambodian nationals who leave trash with identifiableKhmer script. These workers illegally enter Thailand, move in<strong>to</strong> the park <strong>from</strong> the east, and extractwildlife products <strong>to</strong> sell in Cambodian and Thai markets [24].Camera traps recorded domestic dogs roaming as far as 7 km <strong>from</strong> the park boundary. These are mostlikely hunting dogs entering the park alongside their owners, since domestic/feral dogs <strong>from</strong>surrounding villages would only forage short distances in<strong>to</strong> the park on their own. However, whereverthey are, dogs undoubtedly increase hunting pressure on prey species and also must be consideredcompeti<strong>to</strong>rs of native scavengers [25]. In addition, they occasionally may kill other carnivore speciessuch as civets and dholes [26-27]. Finally, domestic dogs are well known carriers for diseases such asrabies, canine distemper virus (CDV), and canine parvovirus that have led <strong>to</strong> epidemics in a variety ofwild carnivore species, such as African wild dogs (Lycaon pictus), lions (Panthera leo), and Ethiopianwolves (Canis simensis) [28-31]. The potential consequences of disease spill-over that domestic dogsmight have on the wildlife of KYNP are far-reaching. For example, CDV is reported <strong>to</strong> not only affectcanids, felids, and hyaenids, but also mustelids (e.g., otters), procyonids (raccoons), ursids (bears), andviverrids [e.g., civets; 32]. Based on our documented dog-ranging behavior in<strong>to</strong> KYNP, and home rangeTropical Conservation Science | ISSN 1940-0829 | Tropicalconservationscience.org122
Mongabay.com Open Access Journal - Tropical Conservation Science Vol.4 (2):113-131, 2011sizes for feral dogs reported <strong>to</strong> be up <strong>to</strong> 10.5 km 2 [33], there is high potential for contact (direct orindirect) between domestic dogs and carnivores in KYNP that could lead <strong>to</strong> transmission of fatalinfectious diseases.Changes in <strong>relative</strong> <strong>abundance</strong>Overall mammal <strong>abundance</strong> is different in KYNP and perhaps has declined in the four <strong>to</strong> six years sincethe Khao Yai Conservation Project was initiated by the Wildlife Conservation Society. While cause andeffect have not been measured, our data showed significantly lower RAIs for clouded leopard, barkingdeer, humans, and mammals in KYNP. To evaluate our reported RAIs, it is helpful <strong>to</strong> consider that inThailand’s largest National Park, Kaeng Krachan National Park, where Asiatic leopards (Panthera pardusfusea) are the dominant large carnivore, leopards were detected 3.71 times per 100 <strong>camera</strong> trap nights[34], double the RAI of the most abundant carnivore at KYNP (large Indian civet, Appendix 3). Thissuggests that the <strong>relative</strong> <strong>abundance</strong>s of mammalian preda<strong>to</strong>rs and their prey in Khao Yai aresuppressed, and this may be related <strong>to</strong> increased human activity. Supporting the possibility of impact<strong>from</strong> human activity is the <strong>relative</strong> variable importance calculated <strong>from</strong> the averaged model parametersof all possible models. Elevation was the most important variable impacting wildlife presence andwildlife detections increased as elevation increased. This may be because higher elevations of the Parkare less accessible <strong>to</strong> poachers.In turn, the suppressed wildlife <strong>abundance</strong>s in KYNP may be related <strong>to</strong> decreased or less effective patrolactivity in the second phase of the Khao Yai Conservation Project compared <strong>to</strong> the first few years (2000– 2003). Both clouded leopards and barking deer are common targets for poachers and subsistencehunters at Khao Yai (K. Jenks, unpublished interview data). Furthermore, even though <strong>to</strong>tal human RAIvalues were significantly lower in comparison with past surveys, we may have underestimated theamount of human traffic as it is highly likely that people became increasingly aware of the <strong>camera</strong>s andactively avoided them.Estimating <strong>abundance</strong>RAIs are not synonymous with an actual index of <strong>relative</strong> <strong>abundance</strong> because they have not beencorrelated with data on population size of each species. However, it is still useful <strong>to</strong> explore patterns inour <strong>camera</strong> trap data since <strong>relative</strong>ly little <strong>camera</strong> trap data has been published <strong>from</strong> this region. Much<strong>camera</strong> trap data that has been collected across Asia has been the result of opportunistic sampling.While this data does not qualify for statistical trend analysis in the same way as occupancy modeling,the presentation of the data itself is useful as it can be used <strong>to</strong> inform decision makers. For example,recorded presence of a rare species is valuable by itself. The evidence <strong>from</strong> KYNP is compelling andindicates that wildlife populations continue <strong>to</strong> decline in this protected area.Mark/recapture and patch occupancy provide extremely useful <strong>to</strong>ols for the detection of trends inwildlife population <strong>abundance</strong> and species presence/absence. The main advantages they offer areexplicit treatment of detection probabilities, error assessments, and estimation of confidence intervals[35]. However, not all data can be collected in this way for a wide range of reasons, <strong>from</strong> lack oftechnical capacity <strong>to</strong> logistics, or simply that fact that we are dealing with legacy data that was collectedbefore the application of the technique had found its way in<strong>to</strong> general practice. Yet, data <strong>from</strong> thesestudies is still valuable and should be used <strong>to</strong> address research and conservation questions.Tropical Conservation Science | ISSN 1940-0829 | Tropicalconservationscience.org123
Mongabay.com Open Access Journal - Tropical Conservation Science Vol.4 (2):113-131, 2011Our data represents one of the legacy projects, where the principal investiga<strong>to</strong>rs at the time were notfamiliar with a patch occupancy framework for data collection and analysis. Post-hoc fitting of oursampling scheme in<strong>to</strong> an occupancy analysis was not possible because of the small number ofindependent sample locations (fewer than six) in each zone during a sampling period and because of theviolation of closure over such a long sampling period. However, we demonstrated how this presencedata can be used in spatial modeling and regression analysis <strong>to</strong> study the spatial distribution of wildlifeand human intruders. We also showed how it can be used <strong>to</strong> identify potential conservation hotspots forselected taxonomic groups, such as carnivores.Fig. 4. Zoomed <strong>camera</strong> trap pho<strong>to</strong>graph of a clouded leopard.Fig. 5. Footprint evidence of tiger inthe Headquarters Zone of Khao YaiNational Park, Oc<strong>to</strong>ber 2005. Pho<strong>to</strong>Credit: T. Redford/FREELANDImplications for conservationOther protected areas and carnivore communitiesOur monthly placement of <strong>camera</strong> traps provided a comparison across all seasons and also yieldeduseful information for future moni<strong>to</strong>ring programs. Because of the lack of significant difference in RAIsamong seasons, we recommend that future studies concentrate surveys during the dry season. Thiswould greatly reduce the weather-related <strong>camera</strong> malfunctions in the tropical environment, while notlosing data on species detections.We recommend that 75 randomly placed sample locations within a grid system throughout a large studyarea are enough <strong>to</strong> detect mammal species over an area of approximately 2,000 km 2 of similar foresttype. Our data demonstrate that most of the mammal species at KYNP could likely be documented bysampling fewer than 75 locations, and based on our species accumulation curve, adding additionalTropical Conservation Science | ISSN 1940-0829 | Tropicalconservationscience.org124
Mongabay.com Open Access Journal - Tropical Conservation Science Vol.4 (2):113-131, 2011sampling locations would not have substantially changed our inferences about diversity patterns atKYNP. We caution, however, that the spatial distribution of our samples may be a strong fac<strong>to</strong>r in thisconclusion.Our data regarding average time <strong>to</strong> first pho<strong>to</strong> capture for individual species (Fig. 3) may be helpful forresearchers planning future <strong>camera</strong> trap studies of specific species in a similar habitat.Management and research recommendationsCamera-<strong>trapping</strong> at KYNP should be carried out every year in the dry season in blocks of two-weeksurveys. Unlike many protected areas in Southeast Asia that have very restricted budgets and resourcesavailable for management, KYNP has hundreds of staff, and one of the largest annual budgets of all Thaiprotected areas available <strong>to</strong> commit <strong>to</strong> park management, especially with respect <strong>to</strong> <strong>to</strong>urism activities.However, despite the importance of wildlife for sustainable <strong>to</strong>urism, protecting and moni<strong>to</strong>ring wildlifehas his<strong>to</strong>rically been assigned a low priority at KYNP. We advocate the adoption of a system of regularmoni<strong>to</strong>ring using a range of methods by dedicated teams of rangers, separate <strong>from</strong> important antipoachingpatrol efforts. Our data indicate that on average, 80 percent of detections of mammals using<strong>camera</strong> traps were within 14 days. A two-week time period is therefore adequate for documenting thepresence of mammals. We also recommend that in order <strong>to</strong> fully document diversity of mammals atKYNP, <strong>camera</strong>-<strong>trapping</strong> will need <strong>to</strong> be augmented by other methods such as spotlight surveys <strong>to</strong> detectsmall carnivores such as primarily arboreal civets, and rare species such as ferret badgers [36]. Live<strong>trapping</strong> methods should be most useful for assessing the small mammal prey base of carnivores sincethis group is under-sampled with <strong>camera</strong> trap methodology [37].We suggest that zones KY09 and KY20 be recognized by managers as potential carnivore diversityhotspots warranting increased protection <strong>from</strong> illegal human activity. More intensive <strong>camera</strong>-<strong>trapping</strong>should be done in these areas <strong>to</strong> determine the reasons for the higher number of species detectedthere, and whether or not the pattern holds over the long term. Focusing additional anti-poachingresources in these zones would be a <strong>relative</strong>ly easy-<strong>to</strong>-implement management step that shouldpositively impact overall carnivore diversity at KYNP if done effectively. Our pho<strong>to</strong>s provide strongevidence that harmful or disruptive activities inside the park (such as active poaching, aloewoodcollection, and the simple presence of humans and dogs) are a continuing threat for KYNP and itswildlife. Increased patrolling along the park’s eastern border, a potential major entry point for poachers,is also likely <strong>to</strong> be a deterrent <strong>to</strong> poaching.Additionally, recovering tigers at KYNP will require a long-term commitment <strong>to</strong> protecting the vulnerablezones in the park. However, with the loss of tigers, the dhole has assumed the role as the functionally<strong>to</strong>p preda<strong>to</strong>r in KYNP. Dholes are an endangered species that has his<strong>to</strong>rically not received appropriateconservation attention by KYNP park managers but needs the same level of protection afforded byflagship species such as tigers, gibbons (Hylobates spp.), and hornbills (Buceros spp.).ConclusionDespite continued threats and a decrease or near extirpation of tigers, KYNP supports a diversity ofcarnivore species of conservation concern, including clouded leopards, dholes, and small felids.Dedicated efforts <strong>to</strong> moni<strong>to</strong>r wildlife using simple <strong>to</strong>ols such as <strong>camera</strong> traps will be essential <strong>to</strong> KYNP’sfuture mission as part of a World Heritage Area. An added benefit of these moni<strong>to</strong>ring activities is thefact that they increase the visitation of remote areas by park staff. Continued moni<strong>to</strong>ring will providecritical information on the occurrence of native species, threats hotspots, the role of invasive orTropical Conservation Science | ISSN 1940-0829 | Tropicalconservationscience.org125
Mongabay.com Open Access Journal - Tropical Conservation Science Vol.4 (2):113-131, 2011domestic species, and an indication of the effectiveness of patrolling and other management andconservation interventions.Since the completion of our project, newly developed techniques have been developed combining<strong>camera</strong>-<strong>trapping</strong> data with occupancy analysis [38] using a new biodiversity indica<strong>to</strong>r, the WildlifePicture Index (http://www.wildlifepictureindex.org/examples/demo_home.htm) [38]. These techniquesmay prove useful in the future for answering more detailed questions about wildlife distribution andconservation status, and might be suitable endeavors for researchers or graduate student projects.AcknowledgmentsMany individuals contributed <strong>to</strong> the success of this project and research. Park Superintendent P.Wohandee provided vision and foresight about the importance of moni<strong>to</strong>ring for biodiversityconservation. Park rangers and team leaders B. Boonpeng, W. Kongsiri, M. Penprathom, S. Narongsak, P.Saenkod, P. Sontienwat, and N. Sungsuwan, with additional rangers <strong>from</strong> the park’s substations, spentmany days and hours under difficult field conditions <strong>to</strong> collect the data. Their dedication was essential.S. Galster and B. Senior of FREELAND provided substantial material and intellectual support. Earlierversions of the manuscript were edited by T.K. Fuller, S. DeStefano, L. Godfrey, N. Songsasen, and B.Houseman. This project and research were supported by the Thailand Department of National Park,Wildlife, and Plant Conservation and funded by donations <strong>from</strong> North American zoos participating in theAmerican Zoo and Aquarium Association (AZA) Felid Taxon Advisory Group, and the AZA CloudedLeopard Species Survival Plan, along with Friends of the National Zoo. We also credit J. Aynes (OakhillCenter of Rare and Endangered Species) and B. Antle (T.I.G.E.R.S. and Rare Species Fund) for theirsubstantial support for the training course and field surveys. We thank three anonymous reviewers fortheir extensive comments and useful suggestions.References[1] Carbone, C., Christie, S., Conforti, K., Coulson, T., Franklin, N., Ginsberg, J.R., Griffiths, M., Holden, J.,Kawanishi, K., Kinnaird, M., Laidlaw, R., Lynam, A., Macdonald, D.W., Martyr, D., McDougal, C., Nath,L., O'Brien, T., Seidensticker, J., Smith, D.J.L., Sunquist, M., Tilson, R., and Wan Shahruddin, W.N.2001. The use of pho<strong>to</strong>graphic rates <strong>to</strong> estimate densities of tigers and other cryptic mammals.Animal Conservation 4:75–79.[2] Jackson, R.M., Roe, J.D., Wangchuk, R., and Hunter, D.O. 2006. Estimating snow leopard population<strong>abundance</strong> using pho<strong>to</strong>graphy and capture-recapture techniques. Wildlife Society Bulletin 34:772–781.[3] Li, S., Wang, D., Gu, X., and McShea, W.J. 2010. Beyond pandas, the need for a standardizedmoni<strong>to</strong>ring pro<strong>to</strong>col for large mammals in Chinese nature reserves. Biodiversity and Conservation19:3195–3206.[4] Linkie, M., Dinata, Y., Nugroho, A., and Haidir, I.A. 2007. Estimating occupancy of data deficientmammalian species living in tropical rainforests: Sun bears in the Kerinci Seblat region, Sumatra.Biological Conservation 137:20–27.[5] Morruzzi, T.L., Fuller, T.K., DeGraaf, R.M., Brooks, R.T., and Li, W. 2002. Assessing remotely triggered<strong>camera</strong>s <strong>from</strong> surveying carnivore distribution. Wildlife Society Bulletin 30:380–386.Tropical Conservation Science | ISSN 1940-0829 | Tropicalconservationscience.org126
Mongabay.com Open Access Journal - Tropical Conservation Science Vol.4 (2):113-131, 2011[6]Poonswad, P., Sukkasem, C., Phataramata, S., Hayeemuida, S., Plongmai, K., Chuailua, P.,Thiensongrusame, P., and Jirawatkavi, N. 2005. Comparison of cavity modification and communityinvolvement as strategies for hornbill conservation in Thailand. Biological Conservation 122:385–393.[7] Brockelman, W.Y., Reichard, U., Treesucon, U., and Raemaekers, J.J. 1998. Dispersal, pair formationand social structure in gibbons (Hylobates lar). Behavioral Ecology and Sociobiology 42:329–339.[8] Chape, S. 2005. World Heritage Nomination IUCN Technical Evaluation, Dong Phayayan Khao-YaiForest Complex (Thailand). IUCN.[9] United Nations Educational, Scientific, and Cultural Organization (UNESCO). 2008. World HeritageSite List. http://whc.unesco.org/en/list/590. Cited 10 Oc<strong>to</strong>ber 2008.[10] Lynam, A.J., Round, P.D., and Brockelman, W.Y. 2006. Status of birds and large mammals inThailand's Dong Phayayen - Khao Yai Forest Complex: Biodiversity Research and Training Programand Wildlife Conservation Society, Bangkok. 245pp.[11] Austin, S.C., and Tewes, M.E. 1999. Ecology of the clouded leopard in Khao Yai National Park,Thailand. CAT News 31:17–18.[12] Suzuki, S., Kitamura, S., Kon, M., Poonswad, P, Chuailua, P., Plongmai, K., Yumo<strong>to</strong>, T., Noma, N.,Maruhashi, T., and Wohandee, P. 2006. Foraging activity patterns of frugivorous or omnivorousanimals on the forest floor of a tropical seasonal forest in Thailand, with reference <strong>to</strong> seasonalchanges. Natural His<strong>to</strong>ry Bulletin of The Siam Society 54(2):177–194.[13] Lynam, A.J., Kanwatanakid, C.O., and Suckaseam, C. 2003. Ecological moni<strong>to</strong>ring of wildlife at KhaoYai National Park, Thailand. Wildlife Conservation Society p. 64.[14] Austin, S.C., Tewes, M.E., Grassman, L.I., Jr., and Silvy, N.J. 2007. Ecology and conservation of theleopard cat Prionailurus bengalensis and clouded leopard Neofelis nebulosa in Khao Yai NationalPark, Thailand. Acta Zoologica Sinica 53:1–14.[15] Austin, S.C., Tewes, M.E., Grassman, L.I., Jr., and Silvy, N.J. 2007. Road ecology of the leopard catPrionailurus bengalensis in Khao Yai National Park, Thailand. Acta Zoologica Sinica 53:373–377.[16] Srikosamatara, S., and Hansel, T. 2000. Mammals of Khao Yai National Park. (2 nd ed).[17] O'Brien, T.G., Kinnaird, M.F., and Wibisono, H.T. 2003. Crouching tigers, hidden prey: Sumatran tigerand prey populations in a tropical forest landscape. Animal Conservation 6:131–139.[18] IUCN. 2008. 2008 IUCN Red List of Threatened Species. http://www.iucnredlist.org/. Cited 10 April2009.[19] Kitchener, A.C., Beaumont, M.A., and Richardson, D. 2006. Geographical variation in the cloudedleopard, Neofelis nebulosa, reveals two species. Current Biology 16:2377–2383.[20] Trisurat, Y. 1997. Spatial-ecological impact assessment of the proposed dam construction in KhaoYai National Park, Thailand. Ph.D. dissertation, Asian Institute of Technology.[21] Rabinowitz, A.R., and Walker, S.R. 1991. The carnivore community in a dry tropical forest mosaic inHuai Kha Khaeng Wildlife Sanctuary, Thailand. Journal of Tropical Ecology 7:37–47.[22] Nowell, K., and Jackson, P. (Eds.) 1996. Wild cats: status survey and conservation action plan.IUCN/SSC Action Plans for the Conservation of Biological Diversity.[23] Grassman, L.I., Jr., Tewes, M.E., Silvy, N.J., and Kreetiyutanont, K. 2005. Ecology of three sympatricfelids in a mixed evergreen forest in North-Central Thailand. Journal of Mammalogy 86:29–38.[24] Wongkorawutl, K. 2006. Police getting <strong>to</strong>ugh in protection of Khao Yai. World Wide Fund for NatureNewsroom.http://www.panda.org/about_wwf_where_we_work/asia_pacific/where/thailand/publications/feature_s<strong>to</strong>ries/index.cfm?uNewsID=123181 Cited 28 August 2006.Tropical Conservation Science | ISSN 1940-0829 | Tropicalconservationscience.org127
Mongabay.com Open Access Journal - Tropical Conservation Science Vol.4 (2):113-131, 2011[25] Butler, J.R.A., and du Toit, J.T. 2002. Diet of free-ranging domestic dogs (Canis familiaris) in ruralZimbabwe: implications for wild scavengers on the periphery of wildlife reserves. AnimalConservation 5:29–37.[26] Williams, J. 1935. Wild dog (Cuon dukhunensis) killed by domestic dogs. Journal of The BombayNatural His<strong>to</strong>ry Society 37:949–950.[27] Dahmer, T.D. 2001 Feral dogs and civet mortality on Kau Sai Chau, Sai Kung. Porcupine! Newsletterof the Department of Ecology and Biodiversity, the University of Hong Kong. 24:16–18.http://www.hku.hk/ecology/porcupine/por24/24-vert-5-feral.htm[28] Alexander, K.A., and Appel, M.J.G. 1994. African wild dogs (Lycaon pictus) endangered by a caninedistemper epizootic among domestic dogs near the Masai Mara National Reserve, Kenya. Journal ofWildlife Diseases 30:481–485.[29] Roelke-Parker, M.E., Munson, L., Packer, C., Kock, R., Cleaveland, S., Carpenter, M., O’Brien, S.J.,Pospischil, A., Hofmann-Lehmann, R., Lutz, H., Mwamengele, G.L.M., Mgasa, M.N., Machange, G.A.,Summers, B.A., and Appel, M.J.G. 1996. A canine distemper virus epidemic in Serengeti lions(Panthera leo). Nature 379:441-445.[30] Sillero-Zubiri, C., King, A.A., and Macdonald, D.W. 1996. Rabies and mortality in Ethiopian wolves(Canis simensis). Journal of Wildlife Diseases 32:80–86.[31] Laurenson, K., Sillero-Zubiri, C., Thompson, H., Shiferaw, F., Thirgood, S., and Malcolm, J. 1998.Disease as a threat <strong>to</strong> endangered species: Ethiopian wolves, domestic dogs and canine pathogens.Animal Conservation 1:273–280.[32] Appel, M.J.G, and Summers, B.A. 1995. Pathogenicity of morbilliviruses for terrestrial carnivores.Veterinary Microbiology 44:187–191.[33] Scott, M.D., and Causey, K. 1973. Ecology of feral dogs in Alabama. The Journal of WildlifeManagement 37:253–265.[34] Ngoprasert, D., Lynam, A.J., and Gale, G.A. 2007. Human disturbance affects habitat use andbehaviour of Asiatic leopard Panthera pardus in Kaeng Krachan National Park, Thailand. Oryx 41:343–351.[35] MacKenzie, D.I., Nichols, J.D., Royle, J.A., Pollock, K.H., Bailey, L.L., and Hines, J.E. 2006. Occupancyestimation modeling: inferring patterns and dynamics of species occurrence. Elsevier Inc., Amsterdam313 pp.[36]Duckworth, J.W., Timmins, R.J., Khounboline, K., Salter, R.E., and Davidson, P.1999. Wildlife in Lao PDR: 1999 Status Report. Vientiane: IUCN-The World Conservation Union /Wildlife Conservation Society / Centre for Protected Areas and Watershed Management.[37] Srbek-Araujo, A.C., and Chiarello, A.G. 2005. Is <strong>camera</strong>-<strong>trapping</strong> an efficient method for surveyingmammals in Neotropical forests? A case study in south-eastern Brazil. Journal of Tropical Ecology21:121–125.[38] O’Brien, T.G., Baillie, J.E.M., Krueger, L., and Cuke, M.. 2010. The wildlife picture index: moni<strong>to</strong>ring<strong>to</strong>p trophic levels. Animal Conservation 13:335–343.Tropical Conservation Science | ISSN 1940-0829 | Tropicalconservationscience.org128
Mongabay.com Open Access Journal - Tropical Conservation Science Vol.4 (2):113-131, 2011Appendix 1. Frequency of pho<strong>to</strong> captures (Oc<strong>to</strong>ber 2003 through March 2007) for wildlife and humantraffic in Thailand’s Khao Yai National Park.Tropical Conservation Science | ISSN 1940-0829 | Tropicalconservationscience.org129
Mongabay.com Open Access Journal - Tropical Conservation Science Vol.4 (2):113-131, 2011Appendix 2. Distribution maps of (a) villages and poachers, (b) canids, (c) bears, (d) felids, (e) prey formid-<strong>to</strong> large carnivores, and (f) model surface predicting wildlife presence. We counted apho<strong>to</strong>graphed person as a poacher if they were carrying a gun, a carcass or animal parts, a bag <strong>to</strong>transport plant material/tree bark, or were accompanied by a dog.abcdefTropical Conservation Science | ISSN 1940-0829 | Tropicalconservationscience.org130
Mongabay.com Open Access Journal - Tropical Conservation Science Vol.4 (2):113-131, 2011Appendix 3. Comparison of average wildlife <strong>relative</strong> <strong>abundance</strong> <strong>indices</strong> (pho<strong>to</strong>s/100 trap nights) at 34<strong>camera</strong> trap survey locations between 1999-2003 and 2003-2007.IUCNStatus 1SpeciesPresentsurvey 2Lynam etal. 2003 3EN Tiger (Panthera tigris) 0.00 0.14V Clouded Leopard (Neofelis nebulosa) 0.06 0.48 *NT Asiatic Golden Cat (Pardofelis temminckii) 0.00 0.07LC Leopard Cat (Prionailurus bengalensis) 0.12 0.80EN Dhole (Cuon alpinus) 0.02 0.45LC Golden Jackal (Canis aureus) 0.12 0.00NT Large Indian Civet (Viverra zibetha) 1.40 1.23V Large-spotted Civet (Viverra megaspila) 0.10 0.00LC Common Palm Civet (Paradoxurus hermaphroditus) 0.08 0.20V Binturong (Arctictis binturong) 0.15 0.07LC Mongoose spp. (Herpestes spp.) 0.37 0.27LC Yellow-throated Marten (Martes flavigula) 0.00 0.54NT Hog Badger (Arc<strong>to</strong>nyx collaris) 0.10 0.71V Asiatic Black Bear (Ursus thibetanus) 0.14 0.00V Malayan Sun Bear (Helarc<strong>to</strong>s malayanus) 0.27 0.73LC Eurasian Wild Pig (Sus scrofa) 0.78 1.28EN Asian Elephant (Elephas maximus) 0.42 0.25V Gaur (Bos gaurus) 0.34 1.06V Sambar Deer (Rusa unicolor) 1.85 2.43LC Barking Deer (Muntiacus muntjak) 1.11 5.47 **DD Lesser Mouse-Deer (Tragulus javanicus) 0.08 0.56V Mainland Serow (Capricornis milneedwardsii) 0.06 0.00LC Malayan Porcupine (Hystrix brachyura) 0.75 1.69EN Sunda Pangolin (Manis javanica) 0.12 0.00V Pig-Tailed Macaque (Macaca nemestrina) 0.58 2.50LC Total Human Traffic (Homo sapiens, Canis familiaris) 1.59 5.66 *All Mammals 9.68 21.97 **(1) IUCN status: LC=least concern; V=vulnerable; NT=near threatened; EN=endangered; DD=datadeficient [18].(2) These data represent a sub-set of data collected during the present survey (sub-set taken <strong>from</strong>Oc<strong>to</strong>ber 2003-November 2006; n=1,017 trap nights). A <strong>to</strong>tal of 34 survey locations (within 2.5 km)was selected for comparison <strong>to</strong> data <strong>from</strong> Lynam et al. [13]. RAI’s in bold represent a significantdifference **p