Efficiency of dye sensitized solar cells with various compositions of ...
Efficiency of dye sensitized solar cells with various compositions of ...
Efficiency of dye sensitized solar cells with various compositions of ...

You also want an ePaper? Increase the reach of your titles
YUMPU automatically turns print PDFs into web optimized ePapers that Google loves.
<strong>Efficiency</strong> <strong>of</strong> <strong>dye</strong> <strong>sensitized</strong> <strong>solar</strong> <strong>cells</strong><strong>with</strong> <strong>various</strong> <strong>compositions</strong> <strong>of</strong> TiO 2based screen printed photoactive electrodesPavol Gemeiner, Milan MikulaSlovak University <strong>of</strong> Technology in Bratislava, Faculty <strong>of</strong> Chemical and Food Technology,Department <strong>of</strong> Graphic Art Technology and Applied Photochemistry,Radlinského 9, 821 37, Bratislava, Slovakiapavol.gemeiner@stuba.skAbstract: The TiO 2 electrode has a key role in <strong>dye</strong> <strong>sensitized</strong> <strong>solar</strong> cell (DSSC) technology in the chargegeneration and charge transportation. The properties <strong>of</strong> TiO 2 layer affect resulting efficiency <strong>of</strong> DSSC andcan be controlled by printing process and chemical composition <strong>of</strong> printing paste. TiO 2 pastes <strong>with</strong> different<strong>compositions</strong> <strong>of</strong> TiO 2 nanoparticles, ethanol, ethyl cellulose, water, acetic acid, α-terpineol were preparedand screen printed onto the glass substrate <strong>with</strong> fluorine doped tin oxide (FTO). The TiO 2 pastes for screenprinting were characterized by rheological measurements and screen printed TiO 2 electrodes by atomic forcemicroscopy and UV-Vis spectroscopy. The photocurrent – voltage characteristics and efficiencies <strong>of</strong> DSSCwere evaluated and compared. All prepared TiO 2 pastes were suitable for screen printing <strong>with</strong> ideal rheologicalcharacteristics. The highest efficiency 0.68 % and current density I SC = 1.21 mA/cm 2 reached by the DSSCbased on TiO 2 electrode <strong>with</strong> thickness 1.5 μm, <strong>with</strong> amount <strong>of</strong> absorbed <strong>dye</strong> 1.1 × 10 –8 mol/cm 2 and <strong>with</strong>outvisible cracks and particles aggregation. This TiO 2 electrode was prepared from the paste containing 5.4 wt. %<strong>of</strong> TiO 2 , 65.3 wt. % <strong>of</strong> ethanol, 1.8 wt. % <strong>of</strong> ethyl cellulose, 23 wt. % <strong>of</strong> H 2 O and 4.5 wt. % <strong>of</strong> CH 3 COOH.Keywords: TiO 2 nanoporous electrode, <strong>dye</strong> <strong>sensitized</strong> <strong>solar</strong> cell, screen printingIntroductionDye <strong>sensitized</strong> <strong>solar</strong> <strong>cells</strong> (DSSC) belong to thethird generation <strong>of</strong> <strong>solar</strong> <strong>cells</strong> and due their lowcost fabrication using printing technologies, lowcost materials and relative high efficiency are thepromising replacement for conventional siliconbased <strong>solar</strong> <strong>cells</strong> (O’Regan et al. 1991). The highestachieved photon to electron conversion efficiency<strong>of</strong> DSSC, 11.5 %, is comparable to the Si <strong>cells</strong> (Chenet al. 2009, Grätzel 2009). The DSSC standardstructure contains a glass substrate coated <strong>with</strong>transparent conductive oxides, the semiconductivenanoporous photoactive layer based on TiO 2 , a <strong>dye</strong>used as sensitizer, an electrolyte containing redoxmediator and Pt counter electrode (Grätzel 2003).In DSSC technology the charge generation occursat the semiconductor — <strong>dye</strong> interface and thecharge transport is done mainly by the semiconductor— electrolyte interface. It is the opposite toconventional organic photovoltaic devices whichuse acceptor and donor materials to form heterojunctionresulting in separation <strong>of</strong> the exciton intotwo carries (Nazeerudin et al. 2011). Therefore,the TiO 2 nanoporous semiconductor photoactivelayer has crucial role in both processes, charge generationand charge transportation in DSSC. Theproperties <strong>of</strong> TiO 2 electrode as roughness, surfacearea and film thickness determine electronic properties<strong>of</strong> the electrode including very importantfactor, the amount <strong>of</strong> absorbed <strong>dye</strong>, which leads tohigher light absorbing (Rothenberger et al. 1999).These structural parameters <strong>of</strong> TiO 2 electrodescan be affected by printing process and particularlyby properties <strong>of</strong> the printing dispersion. Thescreen printing, as the most widely used printingtechnique for TiO 2 photoactive electrode, providesmany advantages due to low cost, speed, simplicityand possibility to print large areas (Nazzerudin etal. 2011). The main parameter <strong>of</strong> screen printingis the quality <strong>of</strong> screen printing paste. The TiO 2paste <strong>of</strong>ten used by researchers for screen printingis standardly composed <strong>of</strong> TiO 2 nanoparticles (DegusaP25), α-terpineol as a solvent, 10 % solution<strong>of</strong> ethyl cellulose in ethanol as a rheological agent,water and acetic acid as a aggregation blockers andadhesion enhancers (Nazeerudin et al. 2001, Ito etal. 2011). The advantage <strong>of</strong> this paste is stabilityand reproducibility but difficult homogenizationprocess and the need <strong>of</strong> ethanol evaporation leadto simpler <strong>compositions</strong>. Therefore, the TiO 2pastes required simpler and faster homogenizationprocess based on alcohols as ethanol, n-butanol,2-ethyl-1-hexanol or water (Ke Fan et al. 2010,Tsoukleris et al. 2005).The aim <strong>of</strong> this work was to prepare TiO 2 pastes<strong>with</strong> different compounds <strong>of</strong> chemical substancesvia simple and fast homogenization process anduse them for screen printing <strong>of</strong> TiO 2 nanoporouselectrodes for DSSC. Properties as rheologicalActa Chimica Slovaca, Vol. 6, No. 1, 2013, pp. 29—34, DOI: 10.2478/acs-2013-000629
characteristics <strong>of</strong> prepared TiO 2 pastes, roughness,thickness and adhesion <strong>of</strong> screen printed TiO 2electrodes, efficiency and photocurrent — voltagecharacteristics <strong>of</strong> DSSC were evaluated in correlation<strong>with</strong> the composition <strong>of</strong> prepared TiO 2 pastes.Materials and MethodsPreparation <strong>of</strong> TiO 2 pastes and screen printingprocess <strong>of</strong> TiO 2 electrodesTiO 2 pastes for screen printing were prepared viahomogenization process as the mixture <strong>of</strong> TiO 2nanopowder (Evonik, Aeroxide P25, ∼22 nm), ethylcellulose (Aldrich, viscosity 22 cp in toluene:ethanol80:20), deionized water, acetic acid (>96.6 %) andα-terpineol (Aldrich, >96 %). The exact chemicalcomposition <strong>of</strong> the prepared samples is shown inTab 1. The homogenization procedure consisted<strong>of</strong> several steps. The TiO 2 nanopowder was addedto a mortar and stirred for 30 min <strong>with</strong> gradualaddition <strong>of</strong> acetic acid (only for sample A and B),deionized water (sample A and C), ethanol andα-terpineol (only for sample D). Then samples undergonehomogenizations in an ultrasonic horn in20 × 1 sec intervals. TiO 2 dispersion was transferredto a beaker <strong>with</strong> addition <strong>of</strong> ethyl cellulose andstirred <strong>with</strong> a magnetic stirrer for 24 hours followedby homogenization in ultrasonic bath for 20 min.Tab. 1. Chemical composition <strong>of</strong> prepared TiO 2pastes (wt. %).ChemicalSampleASampleBSampleCSampleDTiO 2 5 6.5 6.5 6Ethanol 65.7 91.6 69.2 82.8Ethyl cellulose 1.8 1.9 1.8 2.2H 2 O 23 – 23 –CH 3 COOH 4.5 – – 1α-terpineol – – – 7Before printing, the FTO glasses were cleaned <strong>with</strong>ethanol and exposed to UV radiation for 45 min.Samples <strong>of</strong> TiO 2 pastes were screen printed (manualscreen printer, polyester screen — 140 mesh, <strong>with</strong>thread diameter <strong>of</strong> 64 μm, the distance betweenscreen and substrate = 4 mm, polyurethane squeegeeand photosensitive emulsion Kasi Fotecoat 1970)on the fluorine doped tin oxide coated glass (FTOglass, Aldrich, ∼7 Ω/sq., dimension 2 × 3 cm 2 ). Afterscreen printing, the TiO 2 electrodes <strong>with</strong> the activearea 1.5 cm 2 were dried at ambient conditions andthen sintered at 450—460 °C for 30 min to removeorganic compounds and to improve interconnectionsbetween nanoparticles.Dye <strong>sensitized</strong> <strong>solar</strong> <strong>cells</strong> assemblyPrepared TiO 2 electrodes were <strong>sensitized</strong> in0.4 mM solution <strong>of</strong> N3 <strong>dye</strong> (Aldrich, cis-[(2,2´bipyridyl-4,4´-carboxyl)2 (NCS) 2 ] ruthenium(II))in ethanol for 24 hours. After emerging, the<strong>sensitized</strong> TiO 2 layers were cleaned <strong>with</strong> pureethanol to remove unbound <strong>dye</strong> molecules.Platinum paste (Solaronix, Platisol T/SP) used asa catalytic layer <strong>of</strong> counter electrode was screenprinted (305 mesh, thread diameter 34 μm, distancebetween screen and substrate was 2 mm)onto the cleaned FTO glass and then sintered at450 °C for 15 min. The size <strong>of</strong> screen printed Ptcatalytic layers was 1 × 1.5 cm 2 . 18 μl <strong>of</strong> iodineelectrolyte (Solaronix, Iodolyte AN50) was addeddirectly on the <strong>sensitized</strong> TiO 2 electrodes whichwere afterwards assembled <strong>with</strong> Pt counter electrodeinto a sandwich type cell and fixed <strong>with</strong> twobinder clips.TiO 2 pastes, electrodes and DSSC measurementsRheological properties and flow curves <strong>of</strong> preparedTiO 2 pastes were measured using HAAKErotational viscometer (HAAKE VT501, cone7.5 mm). Adhesion <strong>of</strong> screen printed TiO 2 electrodeswere evaluated <strong>with</strong> scotch tape measurements(∼2 N/cm). 3D topography, layer thicknessand roughness <strong>of</strong> samples were measured byatomic force microscope (AFM, Veeco microscopeDI CP-II, 5 and 100 μm scanner, non-contactmode, tip radius 10 nm, set point = –0.039 μm,scanning rate = 1 Hz, gain = 0.15) and obtaineddata were processed by the IP AutoProbeImage2.1.15 and SPMLab Analysis s<strong>of</strong>tware.The amount <strong>of</strong> absorbed N3 <strong>dye</strong> at different TiO 2electrodes was evaluated according Wang description(Wang et al. 2004). Samples <strong>of</strong> <strong>sensitized</strong>TiO 2 electrodes were immersed into a 0.1 MNaOH solution in solvent mixture water/ethanol1:1 for 10 min which resulted in desorption <strong>of</strong>N3 <strong>dye</strong> from electrodes. Absorption <strong>of</strong> obtainedsolutions were measured <strong>with</strong> UV-VIS spectrophotometer(Cecil CE 3055) and amounts <strong>of</strong> absorbed<strong>dye</strong> were determined (Lambert-Beer law)using the maximum absorbance value (A max at508 nm wavelength). The value <strong>of</strong> molar absorptioncoefficient E = 1.78 × 10 4 dm 3 mol –1 cm –1 <strong>of</strong>N3 <strong>dye</strong> at 508 nm wavelength was determinedfrom calibration measurements (0.4 mM solution<strong>of</strong> N3 <strong>dye</strong> in the solvent consist <strong>of</strong> 0.1 M NaOHsolution in solvent mixture water/ethanol 1:1)<strong>with</strong> the help <strong>of</strong> Lambert-Beer law.Photocurrent — voltage characteristics <strong>of</strong> DSSCwere measured using day-light source <strong>with</strong> thepower <strong>of</strong> 880 W/m 2 and by the loading circuitcontaining two multimeters (Keithley 2000). The30 Gemeiner P. et al., <strong>Efficiency</strong> <strong>of</strong> <strong>dye</strong> <strong>sensitized</strong> <strong>solar</strong> <strong>cells</strong> <strong>with</strong> <strong>various</strong> composition <strong>of</strong> TiO 2 …
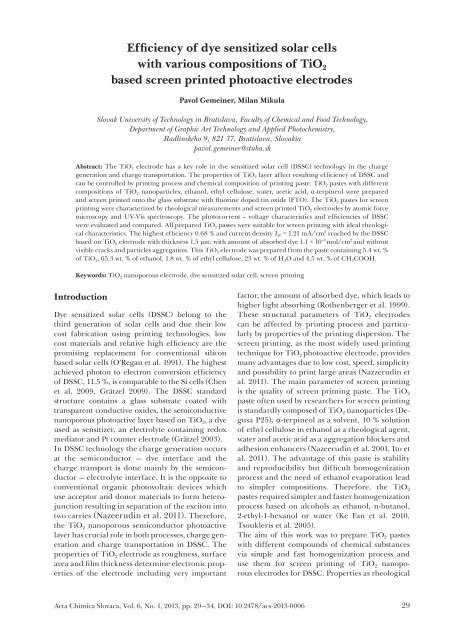
value <strong>of</strong> conversion efficiency <strong>of</strong> prepared <strong>dye</strong> <strong>sensitized</strong><strong>solar</strong> <strong>cells</strong> was measured from Eq. 1, wereη is overall conversion efficiency and V OC , I SC , FF,P in are the open-circuit voltage, short-circuit currentdensity, fill factor and the intensity <strong>of</strong> incidentlight, respectively.VOC$ ISC$ FFh =P[%](1)Results and DiscussionPrepared TiO 2 pastes were suitable for screen printing<strong>with</strong> resulting mechanical stabile TiO 2 layers<strong>with</strong>out significant cracks and inhomogenities.Neither sintering at higher temperatures <strong>with</strong>in450—460 °C did not cause mechanical peeling <strong>of</strong>layers from substrate. It proves the convenient composition<strong>of</strong> all pastes, sufficient homogenizationprocess and well set parameters <strong>of</strong> screen printing.The rheological characteristics <strong>of</strong> TiO 2 pasteshave optimal pseudoplastic behaviour. Viscositydecreases <strong>with</strong> increasing shear rate, typicalfor screen printing pastes, which corresponds<strong>with</strong> adequate amount <strong>of</strong> added ethyl cellulose(Fig. 1). The initial viscosities for samples A, B,C were <strong>with</strong>in η = 7.6—7.8 Pa s and for sample Dη = 3.6 Pa s. Different rheological characteristicand lower viscosities <strong>of</strong> samples B, C and D comparedto sample A could be caused by aggregation<strong>of</strong> TiO 2 nanoparticles in pastes <strong>with</strong>out addition <strong>of</strong>water and acetic acid. For sample D the creation <strong>of</strong>two phases <strong>of</strong> immiscible ethanol and α-terpineolwas apparent. This fact can lead to much lowerviscosity <strong>of</strong> sample D. α-terpineol should affectnanoparticles aggregation and viscosity <strong>of</strong> paste.inThe TiO 2 layers adhesion was evaluated via scotchtape measurements <strong>with</strong> the pealing force ∼2 N/cm.The highest adhesion has been clearly shown forsample A, in which the whole layer remained onsubstrate after peeling, followed by sample C <strong>with</strong>remaining ∼30 % <strong>of</strong> layer, sample B and D whichwere removed completely. These differences in layeradhesion can be caused by addition <strong>of</strong> water andacetic acid to samples A and C. As Ito and Grätzelreported (Ito et al. 2007), <strong>with</strong>out addition <strong>of</strong> thesecompounds, layers are unstable and after sinteringshould by mechanically peeled from substrates. Theeffect <strong>of</strong> water addition is in creation <strong>of</strong> hydroxylgroups on the TiO 2 particles and SnO 2 substrate.After dehydrogenation <strong>of</strong> these groups in sinteringprocess the particles and substrate are linked <strong>with</strong>strong chemical bounds. At the same time, the protonH + <strong>of</strong> acetic acid can be also adsorbed onto TiO 2nanoparticle surface, shifts the Zeta potential topositive, and keep it from aggregation (Hee-GonBang et al. 2012).Thickness, roughness, 3D topography and microscopicimages were taken by AFM. It is well known,that the amount <strong>of</strong> TiO 2 nanoparticles in the pasteaffect the thickness <strong>of</strong> TiO 2 layer and as well asthe efficiency <strong>of</strong> DSSC. The thickness <strong>of</strong> preparedsamples A, B, C and D <strong>with</strong> different content <strong>of</strong> TiO 2(Tab. 1) were 1.5, 2.5, 2.5 and 2 μm, respectively, thatcorresponds <strong>with</strong> the fact mentioned above. The opticalimages <strong>of</strong> printed TiO 2 layers were taken fromoptical microscope <strong>of</strong> AFM at 250× magnification.As shown in Fig. 2, sample A had very homogenoussurface <strong>with</strong> small aggregates. The occurrence <strong>of</strong> aggregatesis most significant on the surface <strong>of</strong> sampleB, which was prepared <strong>with</strong>out addition <strong>of</strong> water andacetic acid. Sample D had the most inhomogenousFig. 1. The rheological characteristics for samples <strong>of</strong> TiO 2 pastes for screen printing.Gemeiner P. et al., <strong>Efficiency</strong> <strong>of</strong> <strong>dye</strong> <strong>sensitized</strong> <strong>solar</strong> <strong>cells</strong> <strong>with</strong> <strong>various</strong> composition <strong>of</strong> TiO 2 …31
Fig. 2. Optical microscopy images (the left side, 400 × 300 μm 2 ) and AFM 3D images(the right side, scans <strong>of</strong> the smoother places) <strong>of</strong> screen printed TiO 2 layers.surface. The reason is the immiscibility <strong>of</strong> ethanoland α-terpineol. This fact has led after sintering tothe creation <strong>of</strong> large TiO 2 free areas at the placeswhere terpineol was before. Sample C <strong>with</strong>out addition<strong>of</strong> acetic acid had rougher surface <strong>with</strong> increasedoccurrence <strong>of</strong> aggregates. Measured roughnesses <strong>of</strong>screen printed TiO 2 layers correspond to aggregatesand inhomogeneities presence. For samples A, B, Cand D the measured values <strong>of</strong> roughness R q was 44,59, 62 and 64 nm, respectively.32Gemeiner P. et al., <strong>Efficiency</strong> <strong>of</strong> <strong>dye</strong> <strong>sensitized</strong> <strong>solar</strong> <strong>cells</strong> <strong>with</strong> <strong>various</strong> composition <strong>of</strong> TiO 2 …
Fig. 3. Photocurrent — voltage characteristics <strong>of</strong> <strong>dye</strong> <strong>sensitized</strong> <strong>solar</strong> <strong>cells</strong>based on different TiO 2 electrodes.Fig. 3 and Tab. 2 shows the I-V characteristicsand performances <strong>of</strong> prepared DSSC <strong>with</strong> screenprinted samples <strong>of</strong> TiO 2 electrodes. The value<strong>of</strong> short-circuit current density I SC (mA/cm 2 , atU = 0 V) depends directly on charge injection andcollection at TiO 2 electrode, on the amount <strong>of</strong> absorbed<strong>dye</strong> and layer thickness. For our samples <strong>of</strong>TiO 2 electrodes A, B, C and D the measured value<strong>of</strong> I SC was 1.21, 0.46, 0.7 and 0.1 mA/cm 2 . The highestvalue <strong>of</strong> I SC for the sample A and lowest for thesample D corresponds <strong>with</strong> differences <strong>of</strong> surfaceinhomogeneities, amounts <strong>of</strong> aggregates and thequantity <strong>of</strong> absorbed <strong>dye</strong>. Beneficial addition <strong>of</strong>acetic acid and water is also demonstrated here,confirmed by high I SC <strong>of</strong> samples A and C. Variancebetween open-circuit voltages U OC (V) for samplesA, B and C compared to sample D indicates thepoor interconnection among TiO 2 nanoparticles,the holes in the oxide layer and low charge injectionfrom iodine electrolyte in the D case.The fill factor (FF) defines ideality <strong>of</strong> <strong>solar</strong> cell, cantake values between 0 and 1 and reflects electricaland electrochemical losses. Measured values <strong>of</strong> FFfor our TiO 2 <strong>solar</strong> <strong>cells</strong> are shown in Tab. 2.The highest efficiency η = 0.68 % was measured forDSSC based on screen printed TiO 2 electrode layer<strong>of</strong> sample A followed by sample C, B and D <strong>with</strong>η = 0.38, 0.25 and 0.03 %.Higher amount <strong>of</strong> absorbed <strong>dye</strong> (adsorbed N3 <strong>dye</strong>in mol/cm 2 measured form UV-VIS absorbancespectra Fig. 4) is related to thickness, roughness andhomogeneity <strong>of</strong> the TiO 2 nanoporous electrode.However, for sample D <strong>with</strong> electrode thicknesscomparable to other electrodes was amount <strong>of</strong>adsorbed <strong>dye</strong> roughly half <strong>of</strong> those quantities.This can be explained by TiO 2 free areas on theelectrode D surface, which decreases the extent <strong>of</strong><strong>dye</strong> absorption during sensitization.In conclusion, <strong>various</strong> pastes based on TiO 2nanoparticles and different content <strong>of</strong> organicswere prepared via simple and fast homogenizationprocess. All these pastes were suitable forscreen printing and forming TiO 2 nanoporouselectrodes for DSSC. The highest efficiencyη = 0.68 %, I SC = 1.21 mA/cm 2 and U OC = 0.76 Vwas reached by DSSC based on 1.5 μm thickTiO 2 electrode <strong>with</strong> roughness R q = 44 nm, containing5.4 wt. % <strong>of</strong> TiO 2 , 65.3 wt. % <strong>of</strong> ethanol,Tab. 2. Photovoltaic performances <strong>of</strong> DSSC based on different TiO 2 electrodes.SampleI SC U OC FF η Thickness Adsorbed N3 <strong>dye</strong>[mA/cm 2 ] [V] [%] [∼μm] [× 10 –8 mol/cm 2 ]A 1.21 0.76 0.65 0.68 1.5 1.10B 0.46 0.78 0.62 0.25 2.5 1.39C 0.70 0.75 0.64 0.38 2.5 1.70D 0.10 0.60 0.46 0.03 2.0 0.76Gemeiner P. et al., <strong>Efficiency</strong> <strong>of</strong> <strong>dye</strong> <strong>sensitized</strong> <strong>solar</strong> <strong>cells</strong> <strong>with</strong> <strong>various</strong> composition <strong>of</strong> TiO 2 …33
Fig. 4. UV-VIS absorbance spectra <strong>of</strong> adsorbed N3 <strong>dye</strong> on the different samples<strong>of</strong> TiO 2 nanoporous layers.1.8 wt. % <strong>of</strong> ethyl cellulose, 23 wt. % <strong>of</strong> H 2 O and4.5 wt. % <strong>of</strong> CH 3 COOH. The amount <strong>of</strong> adsorbedN3 <strong>dye</strong> on this electrode was 1.1 × 10 –8 mol/cm 2 . Itwas proved here that properties <strong>of</strong> TiO 2 electrodeas thickness and amount <strong>of</strong> adsorbed <strong>dye</strong> are notthe only factors which have influence on overallconversion efficiency <strong>of</strong> <strong>dye</strong> <strong>sensitized</strong> <strong>solar</strong> cell.The composition <strong>of</strong> TiO 2 paste could affect thehomogeneity and aggregates concentration <strong>of</strong>the TiO 2 electrode as well. Contents <strong>of</strong> acetic acidand water in TiO 2 pastes significantly decreasedaggregation <strong>of</strong> nanoparticles, increased adhesion<strong>of</strong> layer to substrate and short-circuit currentdensity <strong>of</strong> DSSC.AcknowledgementThis work was supported by courtesy <strong>of</strong> the Slovak GrantAgency (VEGA 1/0818/13) and by the OP Research andDevelopment <strong>of</strong> the project National Centrum <strong>of</strong> Researchand Application <strong>of</strong> Renewable Sources <strong>of</strong> Energy, ITMS26240120016, co-financed by the Fund <strong>of</strong> EuropeanRegional Development.ReferencesGrätzel M (2007) Phil. Trans. R. Soc. 365: 993—1005.Grätzel M (2003) J. Photochemistry and Photobiology C.Photochemistry Reviews 4: 145—153.Hee-Gon Bang, Jun-Ki Chung, Rae-Young Jung, Sang-Yeup Park (2012) Ceramics International 38: 511—515.Chen C, Wang M, Li J, Pootrakulchote N, AlibabaeiL, Ngoc-le C, Decoppet JD, Tsai J, Grätzel C, WuC, Zakeeruddin SM, Grätzel M (2009) ACS Nano 3:3103—3109.Nazeerudin MK, Baran<strong>of</strong>f E, Grätzel M (2011) SolarEnergy 85: 1172—1178.Nazeeruddin MK, Péchy P, Renourd T, Zakeeruddin SM,Humphry-Baker R, Compte P (2001) J. Am. Chem.Soc. 123: 1613—1624.Ito S, Takahashi K, Yusa S, Imamura T, Tanimoto K(2011) International Journal <strong>of</strong> Photoenergy 2012: 7.Ito S, Chen P, Comte P, Nazeeruddin MK, Liska P, PéchyP, Grätzel M (2007) Progress in Photovoltaics: Researchand Applications 15: 603—612.Rothenberger G, Comte P, Grätzel M (1999) Solar EnergyMater. Solar Cells 58: 321.Wang ZS, Kawauchi H, Kashima T, Arakawa H (2004)Coord. Chem Rev 248: 1381—1389.34Gemeiner P. et al., <strong>Efficiency</strong> <strong>of</strong> <strong>dye</strong> <strong>sensitized</strong> <strong>solar</strong> <strong>cells</strong> <strong>with</strong> <strong>various</strong> composition <strong>of</strong> TiO 2 …