

An Improved Method of Pre-Filter Based Image ... - Arindam Bose
An Improved Method of Pre-Filter Based Image ... - Arindam Bose
An Improved Method of Pre-Filter Based Image ... - Arindam Bose

You also want an ePaper? Increase the reach of your titles
YUMPU automatically turns print PDFs into web optimized ePapers that Google loves.
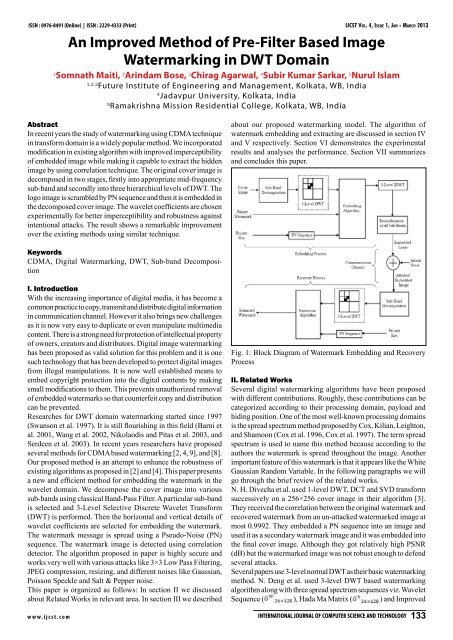
IJCST Vo l . 4, Is s u e 1, Ja n - Ma r c h 2013 ISSN : 0976-8491 (Online) | ISSN : 2229-4333 (Print)Gold Code Matrix ( ) [4]. M. S. Hsieh et al. also testedtheir method using 3-level DWT and Embedded Zerotree Wavelet(EZW) and received PSNR as about 44.2 dB [5].X. Kang et al. proposed a DWT-DFT based method which isrobust to Affine Transform and JPEG Compression but not tomedian filtering attack [7]. Y. Fang et al. suggested a CDMA basedwatermarking method which is robust to cropping attack, JPEGcompression and Gaussian Noise attacks but the performanceagainst geometrical attacks like rotation and scaling is not goodenough [8]. They used Bi-orthogonal Wavelets in the forsecond level decomposition. But the watermarked image suffersfrom lower imperceptible errors and higher Bit Error Rate (BER).Y. Wang et al. used 4-level DWT and decomposed the layerin last three decomposition scheme [9].In this paper we have proposed a simple solution to the shortcomings as discussed above. The proposed technique is justifiedby the results obtained from extensive experiments. Thealgorithm is tuned experimentally by making a trade-<strong>of</strong>f betweenimperceptibility, robustness and payload.III. Proposed Watermarking ModelThe proposed method employs a frequency band decomposition <strong>of</strong>the cover image as the first stage <strong>of</strong> embedding. This pre-filteringhelps in achieving a higher imperceptibility level because we areconcentrating our focus on the Mid-frequency Band, rather thanthe whole frequency band. After selecting a particular frequencyband <strong>of</strong> the cover image we perform Multi-level Selective DiscreteWavelet Transform (DWT). We perform a 3-level selective DWT asthis method shows the best performance among all its counterparts.1-level and 2-level DWTs are not enough imperceptible and attackresilient in nature. Hence, multi-level DWT are favored. Both theembedding process and recovery process are described belowalong with the proposed algorithm. Watermark embedding anddetection process is shown in fig. 1.B. Discrete Wavelet TransformFig. 2: (a) Lower Band (0-0.2), (b) Lower-Middle Band (0.2-0.5),(c) Upper-Middle Band (0.5-0.8) and (d) Upper Band (0.8-1.0)A. Sub-Band DecompositionIn the very beginning, instead <strong>of</strong> using the whole span, the coverimage is decomposed into some frequency bands to select aspecific band for embedding.Each image contains details <strong>of</strong> different frequencies:where,Low Pass <strong>Filter</strong>,Band-Pass <strong>Filter</strong>,High Pass <strong>Filter</strong>, as,Total number <strong>of</strong> sub-bands.The original imageusing (1).can be recombined from those sub-bands(1)is preserved throughwhere, total energy in the image signal(2).(2)In this paper, we have decomposed the cover images into thefollowing sub-bands namely, Lower Sub-Band (0-0.2), Lower-Middle Sub-Band (0.2-0.5), Upper-Middle Sub-Band (0.5-0.8)and Upper Sub-Band (0.8-1.0) and chosen the Lower-MiddleSub-Band for embedding since it yields better robustness resultas discussed in Section VI. Fig. 2 shows the various sub-bandcomponents <strong>of</strong> Cameraman <strong>Image</strong>.134 International Journal <strong>of</strong> Computer Science <strong>An</strong>d TechnologyFig. 3: 3-Level Selective DWT Decomposition Scheme: TheShaded Regions Represent the Embedding LocationsAs the image is two-dimensional signal, it needs a 2-dimensionalWavelet Transform in rows and columns, respectively. <strong>Image</strong>is broken down into four parts quarter size <strong>of</strong> the sub graph bydiscrete Wavelet transform, that are high - frequency detail in subgraph and low - pass approximation <strong>of</strong> sub graph horizontally,vertically and diagonally, each child diagram is received byinterval sampling filter. Similar to classical DWT, 2D DWT isa non-redundant transform, the wavelet image representation <strong>of</strong>at resolution :having the same size as the original two-dimensional signal, .We have employed 3-level Selective Haar DWT as it yields bestresults, which is detailed in experimental result section. Initiallywe have decomposed our cover images into four DWT coefficients,then we have further decomposed the approximation coefficientagain into four second level DWT coefficients and finallytaking the diagonal or details, we have decomposed itwww.ijcst.com
ISSN : 0976-8491 (Online) | ISSN : 2229-4333 (Print)into four third level DWT coefficients. Then we have embedded thewatermark information into the the horizontal detailsandthe vertical details coefficients <strong>of</strong> the currentlydecomposed image. Figure 3 describes the decomposition schemeused in our algorithm and Figure 4 shows the different coefficientimages <strong>of</strong> our sample cover image ‘Cameraman’.C. Generating PN Sequence and CDMA EncodingIJCST Vo l . 4, Is s u e 1, Ja n - Ma r c h 2013IV. Watermark Embedding AlgorithmStep 1: The cover image is decomposed into various frequencybands and then chooses a specific band for further operations.Step 2: The selected frequency sub-band is decomposed intothree level Selective DWT coefficients according to the proposedscheme. Out <strong>of</strong> the four sub-bands, only the high resolution bands( sub-band or coefficient and sub-band orcoefficient) are selected for embedding.Step 3: A highly uncorrelated, zero-mean, two-dimensionalPseudorandom Sequence (PN) <strong>of</strong> the size <strong>of</strong> sub-band matrix isgenerated using a particular key for each zero bit <strong>of</strong> the watermarkimage.Step 4: Embed the same PN sequence in the selected DWTcoefficients and with the embedding strength usingthe following formula:where,(3)Fig. 4: Different DWT Coefficients <strong>of</strong> Cover <strong>Image</strong> CameramanIn CDMA system, the application <strong>of</strong> PN sequence is purposed oncombining the signals <strong>of</strong> multi-users and keeping them independent.It has the obvious and natural advantage to apply its principles todigital watermarking. We considered this advantage by embeddinginitially a 16×16 pixels binary watermark image into differentcover images having resolution <strong>of</strong> 512×512 pixels.Let the watermark message be represented in binary form as, where and denotes thenumber <strong>of</strong> bits in the watermark information to be encoded. ThePN sequence generated using the unique private key chosen byboth embedding and decoding, and is directly correlated with thebinary message to be embedded into the DWT coefficients <strong>of</strong> thecover images. As we earlier stated that we are using the horizontaland vertical detail coefficients <strong>of</strong> 3-level Selective DWT <strong>of</strong> thecover images having resolution <strong>of</strong> pixels, we need togenerate a PN sequence having size. So inthis scenario, our algorithm also limits the size <strong>of</strong> the watermarkimage to be at the maximum <strong>of</strong> .For the encoding process we have employed an embedding strengthwhich determines the degree <strong>of</strong> correlation between the waveletcoefficient and the generated PN sequence. In our algorithm, whenthe encoder detects a ‘0’, it correlates the coefficient with thePN sequence multiplying it with . If it detects a ‘1’, nothing iscorrelated and thereby it reduces the encoder complexity.Our model follows exactly the reverse methodology to recoverthe embedded watermark in the cover images. While extractingthe watermark, we have initially taken a full white or unit matrixhaving size exactly same as the original watermark. Thus weonly need to decide the positions <strong>of</strong> black pixels for successfullyrecovery <strong>of</strong> the watermark.Step 5: Perform 3-level IDWT on the transformed image in thereverse way to get back the desired form.Step 6: Recombine all the frequency sub-bands, along withmultiplying the chosen frequency band with an intensity recoveringfactorFig. 4 shows the different coefficient images <strong>of</strong> our sample coverimage ‘Cameraman’.V. Watermark Extraction AlgorithmStep 1: The received watermarked image is again decomposedinto some frequency sub-bands and the same sub-band is chosenfor further operations. The received watermarked image can bepreceded by attack on the image like different kinds <strong>of</strong> noises,JPEG compression, low pass filter etc. in order to evaluate theperformance <strong>of</strong> the procedure better.Step 2: Apply three-level Selective DWT to the selected subbandand select the same sub-band into which the watermarkwas embedded.Step 3: Regenerate the PN sequence using the same key whichwas used in the embedding section.Step 4: Calculate the correlation coefficient between the aboveselected sub-bands and the regenerated PN sequence.Step 5: Calculate the mean <strong>of</strong> all the correlation values obtainedabove and compare it with each correlation value with the meancorrelation value. If the calculated correlation value is greater thanthe mean, the extracted watermark bit is taken as zero, otherwiseone. The recovery process is then iterated through the entire PNsequence.Step 6: The watermark is constructed using the extractedwatermark bits, and then in order to check the likeliness <strong>of</strong> theoriginal and extracted watermark we compute the Similarity Ratioor Correlation and Bit Error Rate between them.www.ijcst.com International Journal <strong>of</strong> Computer Science <strong>An</strong>d Technology 135
IJCST Vo l . 4, Is s u e 1, Ja n - Ma r c h 2013 ISSN : 0976-8491 (Online) | ISSN : 2229-4333 (Print)VI. Experimental ResultsA. Justification <strong>of</strong> Proposed Watermark AlgorithmTo verify the effectiveness and versatility <strong>of</strong> our proposed methodwe have applied our embedding algorithm to a large number <strong>of</strong>cover images. We are showing results for only five grey scaleimages:1. Cameraman,2. Lake,3. Lena,4. Mandrill and5. Peppers,each having size <strong>of</strong> 512×512 pixels. All the watermarked imageswhich are embedded with the given watermark through ourproposed watermarking method are shown in Table 1. It is clearthat visually the images are imperceptible. The watermark hasbeen embedded into all the five different cover images using therespective values <strong>of</strong> embedding strength , for whose minimumvalue, the Bit Error Rate (BER) is maximum i.e. ‘1’.We also compared various forms <strong>of</strong> three level DWT, viz. Normal3-level DWT, Normal 3-level DWT with sub-band decomposition,Selective 3-level DWT with sub-band decomposition for the coverimage Cameraman. A graphical comparison among the abovethree forms is showed in fig. 5. It is clearly observed from thefig. that the normal 3-level DWT gives good performance withrespect to Correlation but performs very poorly as far as PSNRis concerned, whereas, in Selective 3-level DWT it is seen thatfor a Correlation factor <strong>of</strong> 0.965 we get sufficiently high PSNRbut it then drastically falls as the former tends to 1. This defect iscorrected by using Sub-Band Decomposed Selective DWT, whichprovides the most stable curve amongst all.Table 1: Original Cover <strong>Image</strong>, Watermarked <strong>Image</strong> and ExtractedWatermark <strong>of</strong> Cover <strong>Image</strong>s: (a) Cameraman, (b) Lake, (c) Lena,(d) Mandrill and (e) Peppers.Fig. 5: Graph <strong>of</strong> Correlation Against PSNR (dB) for Normal3-Level DWT, Selective 3-Level DWT and Sub-Band DecomposedSelective 3-Level DWT <strong>of</strong> Cameraman. The Graph Indicates thatthe Selective 3-Level DWT Yields the Efficient ResultFig. 6: Different Possible Regions <strong>of</strong> 3-level DWT: (a) Region 1,(b) Region 2, (c) Region 3, (d) Region 4136 International Journal <strong>of</strong> Computer Science <strong>An</strong>d Technologywww.ijcst.com
ISSN : 0976-8491 (Online) | ISSN : 2229-4333 (Print)IJCST Vo l . 4, Is s u e 1, Ja n - Ma r c h 2013sustain strong attacks and still be able to recover the watermarkaccurately. The corrupted watermarked image and the extractedwatermark as observed for the cover image ‘Cameraman’ areshown in fig. 8.Fig. 7: Graph <strong>of</strong> Embedding Strength Against Correlation <strong>of</strong> 50%Scaling Attack for Various Regions <strong>of</strong> 3-level DWT <strong>of</strong> Cameraman.The Graph Indicates that Region 2 Yields Best ResultIn our proposed method we have justified the reason for choosingthe selective 3-level DWT [Cover <strong>Image</strong> ] region <strong>of</strong>decomposition <strong>of</strong> the cover image. We didn’t choose the Horizontalor Vertical sub-bands for decomposition because theyled to different types <strong>of</strong> artifact errors which easily visible inthe watermarked image and also were less robust. The only fourpossible decomposition regions are,Region 1: Cover <strong>Image</strong>Region 2: Cover <strong>Image</strong>Region 3: Cover <strong>Image</strong>Region 4: Cover <strong>Image</strong>as depicted in fig. 6. Region 1 is identified as Normal 3-level DWTand we use Region 2 in our Selective DWT algorithm.Figure 7 shows the graph <strong>of</strong> Embedding Strength againstCorrelation <strong>of</strong> 50% Scaling Attack for various regions <strong>of</strong> 3-levelDWT <strong>of</strong> Cameraman. Both region 1 and region 2 show similarcharacteristics considering their performance against such attacksfor , but for region 2 gives better performance.Comparing the PSNR values <strong>of</strong> region 1 and region 2 from Figure5 also reveals the superiority <strong>of</strong> region 2 over region 1. It is clearlyobserved in Figure 7 that both region 3 and region 4 show verypoor performance against attacks. Thus, region 2 gives the bestperformance in both the cases, hence our choice.B. Robustness <strong>An</strong>alysisRobustness holds a high degree <strong>of</strong> importance in any watermarkingalgorithm. In our experiments, the watermark and the PN sequenceare embedded into five different gray images. We tested variouskinds <strong>of</strong> attacks on our cover images, such as:• 3×3 Low Pass <strong>Filter</strong>,• Gaussian Noise <strong>of</strong> variance 0.01,• Salt & Pepper Noise <strong>of</strong> variance 0.1,• Speckle Noise <strong>of</strong> variance 0.1,• JPEG Compression for 50,• 50% Scaling attack,• Histogram Equalization <strong>of</strong> 32 step-size.Fig. 8: Attacked Watermarked <strong>Image</strong>s and Their RespectiveRecovered Watermarks: (a) 3×3 Low Pass <strong>Filter</strong>, (b) GaussianNoise <strong>of</strong> Variance 0.01, (c) Salt & Pepper Noise <strong>of</strong> Variance 0.1,(d) Speckle Noise <strong>of</strong> Variance 0.1, (e) JPEG Compression <strong>of</strong>15, (f) 50% Scaling Attack, (g) Histogram Equalization <strong>of</strong>32 Step-SizeIt is clear from fig. 8, that the subjective watermark is recoveredalmost accurately for all the attacks, and hence the proposed methodis robust against attacks. This is further verified by analyzing thenature <strong>of</strong> the Bit Error Rate curve against some <strong>of</strong> the attacks. Infig. 9 we analyzed the Salt & Pepper Noise Density vs. BERgraph in which we observe that even if we increase d to as high as0.1 we get a BER around 0.02-0.04 for all the five cover images,indicating the highly robust nature <strong>of</strong> the algorithm.By increasing the level <strong>of</strong> attacks introduced to an embeddedimage we see that the respective BER value obtained is very low,then we can conclude that the algorithm is highly robust. It canwww.ijcst.com International Journal <strong>of</strong> Computer Science <strong>An</strong>d Technology 137
IJCST Vo l . 4, Is s u e 1, Ja n - Ma r c h 2013 ISSN : 0976-8491 (Online) | ISSN : 2229-4333 (Print)the obvious nature, i.e. the higher is the value <strong>of</strong> , the higher isthe degree <strong>of</strong> information embedded in the cover image and henceis lower the PSNR value.Fig. 9: Curve <strong>of</strong> Bit Error Rate (BER) Against Varying Density <strong>of</strong>Salt & Pepper Noise (d) for Different Cover <strong>Image</strong>s. The CurveIndicates that with Rapid Increasing d, BER Increases with aVery Slow RateFig. 10: Curve <strong>of</strong> Bit Error Rate (BER) against varying QualityFactor <strong>of</strong> JPEG Compression (Q) for Different Cover <strong>Image</strong>s. TheCurve Indicates that from Q = 10 to Q = 15 BER Falls Drasticallyand After Q = 15, BER Decreases in a Very Slow Rate and OftenTends to ZeroIn fig. 10, we analyzed the BER curve for the Quality Factor<strong>of</strong> JPEG Compression varying from 10 to 50, indicating a10-50% compression <strong>of</strong> the image. Y. Fang et al. took a 1024bit watermark in their algorithm and achieved a fair amount <strong>of</strong>robustness for both Lena and Mandrill [8]. We compared ourresult in which we took a 2048 bit watermark at different Qualityfactor <strong>of</strong> JPEG Compression. It is observed that our proposedalgorithm shows better robustness against JPEG Compression. BitError Rate as observed is very low as compared to theirs. JPEGCompression is treated as one <strong>of</strong> the important noise parametersand by observing the results it can be inferred that it performswell against the same.C. Quality <strong>An</strong>alysis1. Peak Signal to Noise Ratio (PSNR)PSNR is considered an important tool in order to comment onthe quality <strong>of</strong> the embedded image. In fig. 11 the graph describesthe nature <strong>of</strong> PSNR values <strong>of</strong> the five different cover images withincreasing values <strong>of</strong> Embedding Strength . The graph follows138 International Journal <strong>of</strong> Computer Science <strong>An</strong>d TechnologyFig. 11: Curve <strong>of</strong> Peak Signal to Noise Ratio (PSNR) in dB AgainstVarying Embedding Strength (k) for Different Cover <strong>Image</strong>s. TheCurve Indicates that with Increasing k, PSNR Decreases2. Bit Error Rate (BER)BER is another important metric which gives valuable informationabout the recovered watermark. BER is a measure <strong>of</strong> the errorbetween the original and the recovered watermark. In fig. 12 thegraph describes the nature <strong>of</strong> BER values <strong>of</strong> the five differentcover images with increasing values <strong>of</strong> Embedding Gain Factor. A very important thing can be concluded on observing thegraph; we see that every cover image shows a somewhat differentnature towards the values <strong>of</strong> . On one hand, images like Peppersand Cameraman gives a BER as low as 0.01-0.02 whereas, forthe same value <strong>of</strong> , images like Mandrill gives a BER <strong>of</strong> 0.1for the same value <strong>of</strong> . So if we take an average value then itcan be said that for 3 we are able to recover the watermarkfrom all the images.Fig. 12: Curve <strong>of</strong> Bit Error Rate (BER) Against Varying Gain <strong>of</strong>Embedment (k) for Different Cover <strong>Image</strong>s. The Curve Indicatesthat with Increasing k, BER Decreases Rapidly3. Payloads (Bytes)<strong>An</strong> algorithm which supports higher payload is given morepreference, but it is also important to analyze the nature <strong>of</strong> PSNRand BER curves against increment <strong>of</strong> the payload. However, wesee that even if we increase the payload, we still obtain betterresults. We have taken other watermark images <strong>of</strong> varying pixelssize and payloads (in bytes).www.ijcst.com
ISSN : 0976-8491 (Online) | ISSN : 2229-4333 (Print)IJCST Vo l . 4, Is s u e 1, Ja n - Ma r c h 2013Fig. 13: Curve <strong>of</strong> Bit Error Rate (BER) Against EmbeddingStrength (k) for Different Watermark <strong>Image</strong>s Having DifferentSize and Payloads. The curve Indicates that from k = 1 to k = 3BER Falls Drastically and After k = 3, BER Decreases Almostin a Straight Line. The Curve Also Indicates that for Same , BERIncreases With Increasing PayloadsFig. 14: Curve <strong>of</strong> Peak Signal to Noise Ratio (PSNR) in dBAgainst Embedding Strength (k) for Different Watermark <strong>Image</strong>sHaving Different Size and Payloads. The Curve Indicates thatwith Increasing k, PSNR Decreases Almost in a Constant Slope.The Curve Also Indicates that for Same k, PSNR Decreases withIncreasing PayloadsWe observe that if we take a 32×32 watermark (original watermark was a 16×16 image) we still are able to recover the watermarkwith a BER <strong>of</strong> as low as around 0.03, i.e. we are able to recover 99.97% <strong>of</strong> the hidden watermark. Fig. 13 and fig. 14 show the nature<strong>of</strong> BER and PSNR with increasing value <strong>of</strong> for different payloads so as to comment on the proposed algorithm.If we take an average <strong>of</strong> both the graphs the we can conclude that for all the payloads we get very low values <strong>of</strong> BER which is alwaysless than 0.05, and the PSNR value is always higher than 40dB.4. Other Test MatricesDifferent performance metrics are calculated to estimate the quality and authenticity <strong>of</strong> an embedded image with respect to the coverimage. Test metrics including,• Normalized Cross Correlation• Correlation Quality ,• <strong>Image</strong> Fidelity ,• Pearson Correlation Coefficient ,• Average Absolute Difference ,• Normalized Mean Square Error ,• Structural Contentare calculated for each <strong>of</strong> the cover image for different values <strong>of</strong> Embedding Strength , and are given in Table 2.Table 2: Various Test Metrics for Watermarked <strong>Image</strong>www.ijcst.com International Journal <strong>of</strong> Computer Science <strong>An</strong>d Technology 139
IJCST Vo l . 4, Is s u e 1, Ja n - Ma r c h 2013 ISSN : 0976-8491 (Online) | ISSN : 2229-4333 (Print)VII. ConclusionIn this paper, we proposed a modification <strong>of</strong> blind DWT basedimage watermarking algorithm using CDMA technique. Weintroduced Selective Sub-Band decomposition along with 3-levelDWT in order to enhance the robustness and imperceptibility <strong>of</strong> theembedded image. Various experimental graphs and table validateour claim in favor <strong>of</strong> our proposed algorithm. In particular, theresults show that the watermarked image is robust to a number<strong>of</strong> attacks like Low Pass <strong>Filter</strong>ing, JPEG Compression, Scaling,Gaussian Noise, Salt & Pepper Noise, Speckle Noise, HistogramEqualization, Gamma Correction and Intensity Adjustment. DWTsuffers from shift sensitivity, hence its performance againstRotation and Cropping is comparatively not satisfactory. In futureworks, we will investigate on the improvement <strong>of</strong> Geometricalattacks like Rotation and Cropping and develop a new algorithmfor color images.[12] S. P. Maity, M. K. Kundu,“A Blind CDMA <strong>Image</strong>Watermarking Scheme in Wavelet Domain”, in Proc. Int.Conf. <strong>Image</strong> Process. Vol. 4, October 2004, pp. 2633-2636.[13] I. J. Cox, J. Killian, F. T. Leighton, T. Shamoon,“SecureSpread Spectrum Watermarking for Multimedia”, IEEETrans. <strong>Image</strong> Process., Vol. 6, No. 12, December 1997, pp.1673-1687.References[1] Y. Fang, J. Huang, Y. Q. Shi,“<strong>Image</strong> Watermarking AlgorithmApplying CDMA”, in Proc. Int. Symp. Circuits and Systems,May 25-28, 2003, Vol. 2, pp. II-948-II-951.[2] M. K. Samee, J. Götze,“CDMA <strong>Based</strong> Blind and ReversibleWatermarking Scheme for <strong>Image</strong>s in Wavelet Domain”, inProc. 19th Int. Conf. Systems, Signals and <strong>Image</strong> Processing,April 11-13, 2012, Vienna, Austria, pp. 154-159.[3] N. H. Divecha, N. N. Jani,“<strong>Image</strong> Watermarking Algorithmusing DCT, DWT and SVD”, presented at the Nat. Conf. onInnovation Paradigms in Engineering & Technology, Nagpur,India, International Journal <strong>of</strong> Computer Applications, No.10, March, 2012, pp. 13-16.[4] N. Deng, C. Jiang,"CDMA watermarking algorithm basedon wavelet basis”, in Proc. 9th Int. Conf. Fuzzy Systems andKnowledge Discovery, May 29-31, 2012, pp. 2148-2152.[5] M. S. Hsieh, D.C. Tseng and Y. H. Huang,“Hiding DigitalWatermarks Using Multiresolution Wavelet Transform”,IEEE Trans. Ind. Electron., Vol. 48, No. 5, October 2001,pp. 875-882.[6] R. Safabakhsh, S. Zaboli, A. Tabibiazar,"Digital Watermarkingon Still <strong>Image</strong>s Using Wavelet Transform”, in Proc. Int. Conf.Information Technology: Coding and Computing, April 5-7,2004, Vol. 1, pp. 671-675.[7] X. Kang, J. Huang, Y. Q. Sh, Y. Lin,“A DWT-DFT CompositeWatermarking Scheme Robust to Both Affine Transformand JPEG Compression”, IEEE Trans. Circuits Syst. VideoTechnol., Vol. 13, No. 8, August 2003, pp. 776-786.[8] Y. Fang, J. Huang, S. Wu,“CDMA-<strong>Based</strong> WatermarkingResisting to Cropping”, in Proc. Int. Symp. Circuits andSystems, May 23-26, 2004, vol. 2, pp. II-25-II-28.[9] Y. Wang, J. F. Doherty, R. E. V. Dyck,“A Wavelet-<strong>Based</strong>Watermarking Algorithm for Ownership Verification <strong>of</strong>Digital <strong>Image</strong>s,” IEEE Trans. <strong>Image</strong> Process., Vol. 11, No.2, February 2002, pp. 77-88.[10] B. L. Gunjal, R. R. Manthalkar,“Discrete Wavelet Transformbased Strongly Robust Watermarking Scheme for InformationHiding in Digital <strong>Image</strong>s”, in Proc. 3rd Int. Conf. on EmergingTrends in Engineering and Technology, November 2010, pp.124-129.[11] Y. Fang, N. Bi, D. Huang, J. Huang,“The M-Band Waveletsin <strong>Image</strong> Watermarking”, in Proc. Int. Conf. <strong>Image</strong> Process.,Vol. 1, September 2005, pp. I-245-8.140 International Journal <strong>of</strong> Computer Science <strong>An</strong>d Technologywww.ijcst.com