

QA_Vol 24_No 1_July 2007 - Australasian Quaternary Association
QA_Vol 24_No 1_July 2007 - Australasian Quaternary Association
QA_Vol 24_No 1_July 2007 - Australasian Quaternary Association

You also want an ePaper? Increase the reach of your titles
YUMPU automatically turns print PDFs into web optimized ePapers that Google loves.
<strong>Vol</strong>ume <strong>24</strong> | Number 2 | <strong>July</strong> <strong>2007</strong><strong>Quaternary</strong> AUSTRALASIA• MICROFOSSILS IN THE FLINDERS RANGES• NEW ZEALAND GLACIATION• AUSTRALIAN-CHINESE QUATERNARY CONNECTIONS• CARBON ISOTOPE VARIABILITY IN AUSTRALIAN GRASSES
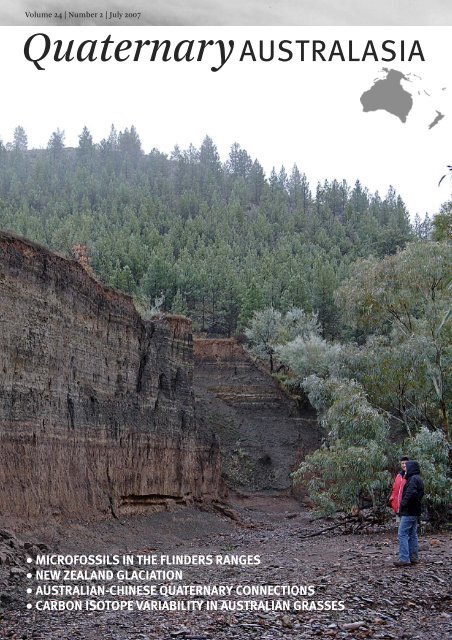
<strong>Vol</strong>ume <strong>24</strong> | Number 2 | <strong>July</strong> <strong>2007</strong> | ISSN 0811–0433<strong>Quaternary</strong> AUSTRALASIACOVER The cover photograph shows latePleistocene fine deposits unconformablyoverlying Proterozoic Rocks of the Brachinaformation in the Flinders Ranges. Thissection forms the basis for microfossil andstable isotope studies discussed in theresearch paper by Peter Glasby and others inthis issue. (Photo: David Haberlah)BELOW Oblique aerial view of the coarsegrainedsand beach ridges at Cowley Beach,100km south of Cairns. Numerical cyclonesurge and wave modelling by Jon <strong>No</strong>ttcombined with OSL dating by Ed Rhodessuggests that these ridges are cyclone-builtfeatures extending back to about 5.5ka.(Photo: David Hopley)1 Editorial, President’s PenFeature Article2 Professor Liu Tungsheng: Australian-Chinese <strong>Quaternary</strong> connectionsJIM BOWLER, WITH INTRODUCTION BY DONALD WALKERResearch Articles11 A reconnaissance study of glaciation on the Owen Massif, northwest Nelson,New Zealand OLIVIA HYATT, JAMES SHULMEISTER, CHRIS SMART19 Late Pleistocene environments in the Flinders Ranges, Australia:Preliminary evidence from microfossils and stable isotopesPETER GLASBY, MARTIN WILLIAMS, DAVID MCKIRDY, REX SYMONDS, ALLAN CHIVAS29 Carbon isotope discrimination by C3 pasture grasses along a rainfall gradientin South Australia: Implications for palaeoecological studiesDONALD PATE, EVELYN KRULLMeeting Reports34 Southern Connection Conference, Adelaide PETER KERSHAW37 ANZGG Rivers Workshop, Canberra and Kioloa KATHRYN AMOS, RACHEL NANSON40 International Young Scientists’ Global Change Conference and Earth SystemScience Partnership’s Open Science Conference, Beijing, China JOËLLE GERGIS43 Plant Macrofossil Workshop, Adelaide JOHN TIBBYBook Reviews44 John Merrick et al.: Evolution and biogeography of <strong>Australasian</strong> vertebrates44 Chris Johnson: Australia’s mammal extinctions REVIEWED BY RICHARD GILLESPIEThesis Abstracts46 Contributors: MANU BLACK, ELLYN COOK, ROSALIND JAMES, ROBYN JENKINS,NICHOLAS PORCH, GRESLEY WAKELIN-KING49 Recent publications
EditorialPresident’s PenDear Fellow Quaternarists,I would like to introduce myselfas the new Editor of <strong>Quaternary</strong>Australasia. AQUA recently handedthe baton to me from Kale Sniderman,and also charged Peter Almond with the position of VicePresident (taking over from Brent Alloway). It is a dauntingtask to live up to Kale’s standards, and even moredaunting still to be producing a special issue in time forthe INQUA conference in Cairns.In honour of the upcoming INQUA conference, we haveprepared a bumper issue, showcasing the varied andactive <strong>Quaternary</strong> research taking place across Australasia.The feature article in this issue is an interviewbetween Professor Jim Bowler of Australia and ProfessorLiu Tungsheng of China. In addition to providing afascinating insight into the development of <strong>Quaternary</strong>science in China throughout the country’s tumultuoushistory, Professor Tungsheng celebrates the strongscientific connections between China and Australia,which began with the visit of the Australian <strong>Quaternary</strong>delegation to China in 1975. From there began numerousexchanges and collaborations which further highlight the<strong>Australasian</strong> <strong>Quaternary</strong> community’s involvement ininternational scientific endeavours.This issue also includes several research papers, coveringtopics as diverse as Peter Glasby and colleagues’ studiesof microfossils in late Pleistocene wetlands of the currentlysemi-arid Flinders Ranges, and Donald Pate andEvelyn Krull’s work on carbon isotope discriminationby pasture grasses in southern Australia. New ZealandersOlivia Hyatt and colleagues reconnoitre previouslyglaciated karst on the South Island, investigating locallydistinctive glacial landforms and processes. Thanksmust go to the reviewers who managed to complete theirreviews in the limited time available.<strong>Australasian</strong> Quaternarists have also been busy debatingtheir respective sub-disciplines at meetings, andmaking use of the networks provided by such meetings.This issue contains reports on the Southern ConnectionConference (which brought together scientists fromacross the Southern Hemisphere), the Australian andNew Zealand Geomorphology Group Rivers Workshop,the International Young Scientists’ Global ChangeConference in Beijing (which a young Australian palaeoclimatologist,Joëlle Gergis, attended) and a Plant MacrofossilWorkshop held in Adelaide. Richard Gillespie alsoprovides an insightful review of Chris Johnson’s newbook on Australia’s mammal extinctions.Dear Friends of the <strong>Quaternary</strong>,Hopefully this will be a highlightyear for AQUA. The INQUA <strong>2007</strong>conference is upon us, at the excitinglocation of Cairns in Queensland.I remember how as a youngish Dutch student I attendedINQUA in Beijing in 1991. As a PhD student in <strong>Quaternary</strong>science, INQUA was a huge attraction to presentwhat I thought was pretty cutting edge science (which itprobably wasn’t). It turned out to be one of the bestmoves I made. The pre-conference fieldtrip was a tourfrom Kathmandu to Lhasa in Tibet. We had terribledelays in getting out of Tibet and Cheodu, but still madeit to the conference. The most important experiencefrom this trip and conference was to meet excellentscientists from different backgrounds. I met up withmy future Australian colleagues in the lobby of the hotelin Beijing, which turned into the local watering hole.Only later did I realise that I had spent more time withAustralian scientists than with my colleagues from theNetherlands. At subsequent INQUA conferences wewere always happy to meet up and chat about ourresearch. I have used this initial international networkingthroughout my career.As a Dutch student I also used the British <strong>Quaternary</strong><strong>Association</strong> to get in contact with scientists for samplesto be tested for my thesis. <strong>No</strong> wonder the first thing Idid when landing in Sydney on St Patrick’s Day in 1993was to join AQUA. It was a good move, as it brought meinto contact with other Quaternarists in this region.Hopefully the next generation of young Quaternarists inAustralasia will also see the INQUA conference in Cairnsas an opportunity for international networking. Thiswas the most important reason for AQUA to support fivePhD students to attend INQUA.This bumper issue of <strong>Quaternary</strong> Australasia shows that<strong>Quaternary</strong> science is alive and kicking down under.Congratulations to our new editor Kathryn Fitzsimmonsfor putting this excellent issue together. Last but notleast, the AQUA Executive is planning the Biannualconference for early 2008, where we can all chat aboutthe good times we had in Cairns.See you in Cairns!!!!!!Henk HeijnisPresident of AQUAI sincerely hope that you will enjoy this special issue of<strong>Quaternary</strong> Australasia. Please feel free to contact me ifyou wish to contribute to future issues.Kind regards,Kathryn Fitzsimmons1 | <strong>Quaternary</strong> AUSTRALASIA <strong>24</strong> (2)
Feature ArticleProfessor Liu Tungsheng:Australian-Chinese <strong>Quaternary</strong> connectionsAn edited interview by Jim BowlerSchool of Earth SciencesThe University of MelbournePreface Donald WalkerAfter excursions in both directions beginning in 1975,the Australian National University (ANU) and the ChineseAcademy of Science (CAS, Academia Sinica) formallyestablished the ANU – Academia Sinica <strong>Quaternary</strong>Studies Programme in 1980, primarily to explore thesimilarities and differences of the two land massesduring the <strong>Quaternary</strong> period. It provided for collaborativeresearch in both countries, particularly in salt lakestudies, palynology and palaeo-anthropology. Althoughit formally ended about 1988, the joint work which itinitiated, and which has diversified and spread farbeyond the parent institutions, continues to this day.The leader of the party that greeted the first Australiandelegation at Beijing airport in 1975 was Professor LiuTungsheng, and he remained the prime facilitator ofactivities in China throughout the joint programme.Without his scientific initiative, experience and ability toget things done – often on a grand scale – it would havebeen a far less successful undertaking. Distinguishedthough he is in several fields of Chinese geology, it is hispioneering and detailed work on loess which has gainedmost international acclaim. In 1987 he was awarded anhonorary Doctor of Science by ANU. He was President ofINQUA from the Beijing meeting of 1991 to the Berlinmeeting in 1995.Long association and common interests have led towarm and enduring friendships between the participantsand their families from the two countries. One suchfriendship is that between Liu Tungsheng and JimBowler, from which arose a series of interviews in 2004.<strong>No</strong>w in his ninetieth year, Tungsheng muses on the lifeand times of a geologist in China during several decadesof troubles and changes, and on the importance of geologyin the modern world. It is a remarkable account ofsteadfast intent for which we are all indebted to Tungshenghimself and also to Jim. What follows is anabbreviated version of the whole set of interviews whichcan be read in full at: http://www.aqua.org.auInterviewer’s <strong>No</strong>te Jim BowlerAn early approach to Professor Liu Tungsheng to recordhis reflections of life was greeted by characteristicallygenerous but modest response. The interview wasconducted in October, 2004 at the Institute of Geology &Geophysics, Chinese Academy of Science, Beijing. Thiscondensed record of the interview is published withProfessor Liu’s permission.The problem of reducing the full interview to half itsoriginal length for publication poses a number ofproblems. What to omit without loosing the connectingflow? Toward resolution of that problem the followingguiding principles have been adopted. Firstly, asProfessor Liu came prepared in the best Socratic orperhaps Confucius tradition with a large sectorpackaged into six stories; these stories, as central to thedialogue, have been retained almost intact. Secondly, forreader interest, the following thematic links have beenidentified:• Early years, youth and the rise of patriotism• Emerging science: Beijing Man discoveries atZhoukoudian• Openings with the West• Early loess developments• Cultural Revolution interruptions• The Australian connection• Vision for the futureWe are particularly indebted to Dr Han Jiamao, Instituteof Geology & Geophysics, CAS, Beijing for his meticulousassistance in editing the final text details of Chinesenames and spelling.Donald Walker is Former Chair of the Australian componentof the ANU – Academia Sinica <strong>Quaternary</strong> Studies Programme2 | <strong>Quaternary</strong> AUSTRALASIA <strong>24</strong> (2)
Interview withProfessor Liu Tungsheng,May <strong>24</strong>, <strong>2007</strong>Early years, youth and the rise of patriotismI will begin with personal experiences while in my hometown. I was born in the year 1917. The hometown of mygrandfather was in the north of China, Tianjin, but I wasborn in Shenyang in the northeast. My father hadbecome a station master of Shenyang. The station,Huanggutun, was where the Japanese bombed therailway and killed the warlord, Zhang Zuolin, who at thattime was the governor of northeast China. That was thestart of the Japanese military invasion from 1928.My father was a self-educated man, and paid muchattention to the education of his children. I learned frommy father the qualities of diligence, hard work, honestyand generosity. All these virtues or characters were alsotaught at primary school. My mother, a traditionalwoman, came from the countryside from a family offarmers.My lasting impression of my primary school educationand of that age, during the 1920s and 1930s, is a kind ofnational humiliation. At primary school we had ‘nationalhumiliation days’ because of the unequal treaty betweenChina and Japan, Britain and other countries likeFrance, Russia and Italy. So, for the primary school stageof my life there were two major impressions. There wasthe traditional education from school and also fromfamily about diligence, hard work, honesty and generosity.On the other side was patriotism through beingunder Japanese control.In 1930, the Japanese military first occupied the northeasternpart of China, so my family fled from Shenyangto live in Tianjin and Beijing. We moved to the interiorpart of China during the second World War.Twenty years later I went back to Shenyang, and Idiscovered that in the 20 years from 1930 to 1950 noengineers had been educated. China had universitiesand high schools; medical doctors were trained but nocivil engineers, no mechanical engineers, and of courseno geologists. So all the geology was being conducted byJapanese geologists. They had trained only some of theirsubordinates to look for the outcrops of some ores ormineral deposits. The information was collected so theJapanese geologists could decide whether the depositswere useful or not. So it seems there was a degree ofintellectual control of China through the JapaneseFigure 1: Memorial stamp and envelope struck by China’snational government to commemorate the award of China’sNational Science Prize, awarded and presented to Prof. LiuTungsheng in 2004.occupation. That’s why most people of my age groupdeveloped a strong sense of patriotism.The bombing of Shenyang in 1928 killed the leader ofChinese government in the northeastern part, the fatherof Zhang Zueliang. Zhang Zueliang then took control ofthe military in the northeast and retreated into northernChina. When the Long March passed through northernChina to the northwest he was in Shaanxi Province andJiang Jieshi [Chiang Kai-shek] was controlling thesouthern part of China, and the communist army passedthrough the eastern and northern part into Yan’an. Theson of the older marshal (Zhang Zueliang) talked withChiang Kai-shek during a visit to his headquarters, thenthey had negotiations between the communists and thegovernor. From that time in 1937 the Japanese resistancereally began, after they had occupied Beijing, Tianjinand Shanghai.We left Shenyang, my hometown, for Tianjin and mymiddle school. This school recently celebrated its onehundredthyear; Nankai Middle School. The school isvery proud of its alumni because two prime ministerswere graduates, one being Premier Zhou Enlai, the otherPremier Wen Jiabao.Many of my generation shared similar life experiences.I learned quite a lot about nature when I was very youngbecause we lived in the countryside where there was noentertainment such as movies or theatres. The onlything we did enjoy was nature, so at the small river wecould swim and catch insects or other animals.3 | <strong>Quaternary</strong> AUSTRALASIA <strong>24</strong> (2)
Feature: Interview with Professor Liu Tungsheng CONTINUEDIn 1937 I graduated from middle school, but there wasno chance to enter university due to the start of the war.Some graduates moved to the northwest to thecommunist-occupied area. The war started in 1937 andended together with the second World War in 1945. Afterfour years of university life, 1938 to 1942, I was sick forsome time (until 1944). In 1946, I started my career as ageologist.After the war (in 1946), I enrolled in the GeologicalSurvey in Chongqing in the southwest in SichuanProvince, which was the wartime capital along theYangtze River. The Geological Survey was in thecountryside. Then they moved back to the oldheadquarters in Nanjing, then the government capital.After liberation in 1949, the Geological Survey expandedas the Ministry of Geology. Some of the people from theGeological Survey established the Institute of Geology in1953. This Institute continued the geological researchwork of the former Geological Survey. Some of theresearch, exploration and geological survey mappingwork expanded greatly in the Ministry of Geology,although during the 1950s there was little opportunityfor research. At that time the Institute reported to theAcademy of Science and also to the Ministry of Geology.This was the continuation of the former GeologicalSurvey with people like Professor Hou Defeng andProfessor Ye Lianjun. We had six senior geologists whocame from the Geological Survey including myself.Altogether there were no more than 100 geologistsduring the establishment of the ‘new’ China.OPENINGS WITH THE WESTStory 1 The first story was the one my grandmothertold me during the 1920s. It is the story of the‘southerners’, of people who I think are actually‘foreigners’. She described these foreigners who in veryhot weather were wearing wool coats and high bootsspeaking some kind of language or dialect that localpeople did not understand. They came to a local hilltrying to find something from it. At last after three daysof looking one of them knocked at a rock, found agolden frog and took it away. I think the foreigner was ageologist, perhaps Ferdinand von Richthofen or BailyWilles.The actions my grandmother described were aboutfinding fossils in rock; of course not a golden frog butfossils of other animals, insects or such like. My interestwas sparked that we couldn’t find the golden frog andthat she’d said we have such precious things in ourcountry that were taken away by the southerners, by theforeigners. This attitude persists to this day amongChinese regarding exploration and use of our resourcesby foreigners.Figure 2 (right) : Occasion of first visit by Chinese scientists to theWalls of China, Lake Mungo, in the Willandra Lakes World Heritagearea, western New South Wales, in 1977. The Lake Mungo lunette, theonly distinctive feature in the region, derived its early “Walls of China”name from its proximity to the community of Chinese shepherdsworking on the original pastoral lease in 1869. From left, Prof. LiuTungsheng (Chinese Academy of Science), Mme Wang Zunji (ForeignAffairs, Beijing). Dr Bao Haosheng (Karst geomorpholgist fromNanjing, then studying at the ANU). (Photo: Jim Bowler)It is this kind of culture which has limited the growth ofChinese economics and the progress of Chinese cultureto the outside world. A similar kind of ‘restricted view’ or‘protective thinking’ occurred during the opium war.During the opium war the people of the Qing Dynastydidn’t want to open the door; they resisted everythingfrom the outside world.Of course some Chinese would have liked some westernculture, but many of the officials and others resisted theforeigners, just like my grandmother. She held thenotion that the foreigners took all the precious frogsaway. They saw that the foreigners were very capable andthought that the Chinese couldn’t do it. While theyadmired western technological and exploration powers,at the same time there was an awareness and regret thatso many precious things had been taken away. This wasthe sentiment during my young days. I find this storyparticularly interesting because she was describing ageologist; maybe that influenced me to become ageologist as well!Story 2 The second story is about a very famousproponent of Chinese geology, Professor Ding Wenjiang[Ting Wen-chiang]. He was educated in Britain andgraduated from Glasgow University. He finished hisstudies in both zoology and geology. He was a very goodgeologist, maybe a student of a very famous Englishgeologist who studied the parallel mountains (‘dryvalleys’) in Yunnan Province. There are many stories4 | <strong>Quaternary</strong> AUSTRALASIA <strong>24</strong> (2)
about Dr Ding [Ting]. He was the first director of theChinese Geological Survey; he established the firstChinese Geological College, and is considered one of thefounders of Chinese geology.Professor Ding Wenjiang returned to China soon after1910. In 1919, as Director of the Chinese GeologicalSurvey he published the first Chinese geologicalmagazine, the Bulletin of the Geological Survey. On thefirst page in the first issue of volume one of that journalhe printed a quote from Richthofen, who essentiallywrote that ‘Chinese intellectuals like to sit at their desk intheir very neat and clean rooms that are full of sunshineand write poems and make paintings’. They enjoy this kindof intellectual life; they don’t like to go out in the field. Somany years later other disciplines of science haddeveloped but not geology.Professor Ding Wenjiang printed Richthofen’s quotationat the front of the first Geological Bulletin to encourageyoung Chinese geologists to go into the field. This was avery good story, especially for people of my age. I alwaystell this story to young geologists, especially now becausesome of them don’t want to do field work. During the1930s and 40s geologists liked to go to places like theHimalayas; they were very ambitious. What DingWenjiang and Richthofen had said about the Chineseintellectuals back then is still relevant to some youngChinese geologists who don’t like fieldwork in thepresent time. However with this warning most youngChinese geologists now work hard in the field.Ding was proud of those he trained at Peking Universityduring the 1920s, who became the first generation ofChinese geologists. There were students like YangZhongjian [C.C. Young, Yang Chung-Chien in earlyspelling, frequently abbreviated to C.C.Young in Englishpublications. JMB] who graduated in 1923 and PeiWenzhong who graduated in 1927.EMERGING SCIENCE:BEIJING MAN DISCOVERYStory 3 This is the story of Pei Wenzhong and the discoveryof Peking Man. Pei graduated from the universityin 1927. At that time he couldn’t find a job in geology.Then came support from another founder of Chinesegeology, Professor Weng Wenhao [WH Wong], who wasthe first Chinese person with a doctorate degree from awestern country. Professor Weng supported Pei Wenzhongto work as a secretary for the excavation inZhoukoudian.Just before that, in the early 1920s, JG Andersson fromSweden had purchased some ‘dragon’s bones’ used inChinese traditional medicine. The ‘dragon’s bones’ wereactually fossil bones and teeth. Andersson sent themback to Sweden, where paleontologists found that someof the teeth may be from an arthropod, a primate, sometype of monkey. Andersson was sharp and a very goodobserver. That was the time of the Java Man discovery.Andersson thought that perhaps he could find fossil manin China. So he explored the surroundings of Beijing andfound in Zhoukoudian a place that local people called theChicken Bone Mountains, because fossils of birds werepresent in deposits.Andersson excavated in Zhoukoudian, and was followedby the Austrian palaeontologist, Otto Stansky and aSwedish palaeontologist, Birge Bohlin, in 19<strong>24</strong> and 1925.Weng hired Pei in 1927 to take charge of the excavationmanagement. At that time Pei knew nothing about thework in palaeontology but he was very diligent at takingcare of the excavation. He first learned from the archaeologistsnew methods for excavation where they createda grid system and excavated from level to level. This wasthe first grid system Pei applied, then he made a sort ofpulley from the lower part of the mountain to facilitatethe work. At the end of 1929 he discovered the first skullof Peking Man.Others involved in the excavation such as Davidson Black,Teilhard de Chardin and Bohlin had all thought theywould find human fossils quickly. They were ready to stopthe excavation in late December of 1929 because it wasvery cold but Pei insisted they try another day. On thatvery last day they found something different, maybe akind of skull. Pei examined it himself and at last theythought it was a skull of fossil man. They wrapped it andcarefully transported it to the Department of Anatomy atthe Peking Union Medical School.Pei’s discovery was an important turning point forChinese geology and palaeontology. Before that we hadimportant works by Grabau and Teilhard de Chardin, butnone were conducted by Chinese palaeontologists nordiscovered by the Chinese themselves. So this finding ofthe fossil skull by Pei is a kind of declaration of independencefor Chinese geology! For many years I wondered ifthat’s why there is a kind of phenomenon about Pei,because if people were talking about the discovery ofPeking Man, everyone said that Pei was the discoverer. Icalled this ‘the Pei phenomenon’. The Chinese realisedwe made a discovery of worldwide importance.Story 4 At university between 1938 and 1942 we had aGerman professor, Peter Misch, who was a student ofHans Stille. Peter Misch taught us structural geology andthe ideas of Hans Stille on regional metamorphism.These were very distinguished people.At that time, the Chinese translation of Sven Hedin’sbook on the exploration of the Taklimakan Desert wastranslated and published. It was a very popular book foryoung students. It contains a very famous story aboutHedin’s rescue of his guide by finding some fresh waterand taking it to him in his boots. For me Sven Hedin and5 | <strong>Quaternary</strong> AUSTRALASIA <strong>24</strong> (2)
Feature: Interview with Professor Liu Tungsheng CONTINUEDHans Stille were big figures for young students ofgeology. Sven Hedin explored nature, while Hans Stilleexplained nature including the structure of the earth.So, geology not only explores but also explains earth.For me, that is the importance of geology; it capturedmy interest and led me later to study palaeontology. Sothis is the story of my professor, Peter Misch, who atthat time taught geology in the Southwest AssociatedUniversity in Kunming, which was a collective universityincluding Tsinghua, Peking and Nankai Universities –three universities together.Story 5 The fifth story is about Teilhard de Chardinand comes from Yang Zhongjian [C.C.Young] who was avery good friend of Teilhard de Chardin. Yang Zhongjianlearned a lot from Teilhard de Chardin who wasabout 10 years older than him. Teilhard de Chardin is avery special man for the Chinese.Most Chinese geologists and others, especially in thosedays, knew him as a vertebrate palaeontologist. Heworked in palaeontology, structural geology, <strong>Quaternary</strong>geology, petrology and even botany and zoology. Howeverin France, the French knew Teilhard de Chardin asa philosopher. Many still think of him as a philosopherand don’t know about his palaeontological work. He isactually one of the founders of Chinese vertebratepalaeontology. He trained Yang Zhongjian and Pei andmany others. I didn’t have the chance to meet himpersonally.During the Japanese occupation of Beijing, Teilhard deChardin’s ideas about the noosphere and the ‘Phenomenonof Man’ were completed. Yang Zhongjian gave mea monograph where Teilhard de Chardin described hisidea of the noosphere. In that paper he described thelithosphere, then came the Stone Age, then the BronzeAge, followed by the industrial age and then came thenoosphere, ‘the age of consciousness’. These were veryinteresting ideas of Teilhard’s but were neglected byChinese palaeontologists.Story 6 Was Teilhard de Chardin’s philosophy or ideasinfluenced by the Oriental philosophers? In his work hehas very good summations of the Indian, Japanese andChinese philosophies; I think he was influenced by thephilosophy of the Chinese. The most famous Chineseeducator and philosopher, Confucius, had the idea theworld will become a common country and that mankindhas to have friendship and love for others. I foundthese ideas also in Teilhard de Chardin’s ‘ThePhenomenon of Man’ whose omega point in a futureworld will be the uniting of all people into a big familywhere the end goal in their evolution and developmentmust be love.This is of importance in understanding his ‘earth systemsconcept’ for he created another layer of the earth, thenoosphere. I’m really interested in that because in recentyears with environmental and global change issues,people have become more aware, especially during thelast 10 to 20 years. It seems the earth is becoming smaller;people have a view of the globe in its entirety.[On a 1964 visit to the Tibetan Plateau with Prof. Shi Yafeng,Prof. Liu discovered high altitude fossil Quercus leaves,clear evidence of uplift...JMB]So we have to consider all work not only of the loess orthe Tibetan plateau, not only of the northern plain, of thecoast or other areas. We have to consider the geology ofthe world, of the whole globe, especially if we are workingon environmental issues.Environmental issues involve humanity as a geologicalagent: the human influence on the environment is increasinglyimportant. That’s why I am interested in thenoosphere. In 2000 a short paper written by Crutzen et al.appeared in the bulletin of the IGBP (International Geosphereand Biosphere Program). Paul Crutzen is in thefield of atmospheric physics. He studied Antarctic ozonedepletion but as an atmospheric chemist he raised aproblem for discussion. After the Holocene, humans todaylive in a geological epoch he called the Anthropocene,beginning in 1846 when James Watt invented the steamengine.The idea of the Anthropocene is a very attractive one eventhough many <strong>Quaternary</strong> geologists consider the appearanceof humans as the beginning of the <strong>Quaternary</strong>. PaulCrutzen’s idea to start from the beginning of the industrialage is supported by ice cores in which carbon dioxideand methane increase due to human activity.From a geological point of view, human agency influencesgeological processes, for example, through explorationand soil disturbance by humans, the dunes return toactive desert. This is not only interesting scientifically, butmore importantly, politicians, policy makers and landmanagers must be aware of such geological impacts.Even though these changes are actually natural responsesto humanity’s geological agency, it is especially importantfor the Chinese because China is so populated. We arealways saying that if China had 20% or even 10% lesspeople, then the problems of cereals supply and watershortages would be solved more easily. We may have towait another 30 to 50 years for the birth rate to stabilise.Yet after 50 years or more the population will againincrease and the only way to solve the problem of populationgrowth and shortage of resources is for people tobe aware of human environmental impacts. This remainsa critical issue for future generations. That’s why I’m infavour of Paul Crutzen’s idea of the Anthropocene.So this is a summary of my contact with science as aChinese looking at science from the west.6 | <strong>Quaternary</strong> AUSTRALASIA <strong>24</strong> (2)
Figure 3: The first Australianvisitors arrive at Yenan in thecentre of the loess plateau in1975. From left, Mr ShouMingshen (translator), AlanThorne, Joe Jennings, Mrs Yu,Donald Walker, Mr Chien(Foreign Affairs), Dr Lu Yanchou,Jim Bowler. (Photo: IanMcDougall)EARLY LOESS DEVELOPMENTSMy first contact with the loess issue was when I was ayoung palaeontologist in Nanjing in 1946. Some of thepedologists at the survey sent me a segment of bonethey found from the loess in Nanjing. I also met thepedologist Professor Song Bartran who studied palaeosolsin the loess near Nanjing at the source of theYangtze River, the Xiashu loam or loess. That was thename used in the 1920’s and 30’s by the American soilscientist James Thorp who studied palaeosols in boththe United States and China.I became acquainted with the fossils from the loessand then in the museum I found the fossil describedby Teilhard de Chardin. He had found it beneath theMalan Loess. Beneath the loess of the last glaciationand above the Hipparion red clay is a group of geologicalformations which he designated as a reddishclay and not as loess. I wondered why Yang Zhongjianand Teilhard de Chardin, who worked together, hadnot recognised the nature of the loess? Maybe theydidn’t notice or pay much attention to the buried soil,the palaeosol, or they were influenced by the loessdeposits in Europe which are mostly younger, from thelast glaciation. Maybe that’s why they considered it anew geological formation, the reddish clay. Teilhardde Chardin divided the reddish clay into three subdivisions,A, B and C. Actually reddish clay ‘A’ is stratigraphicallyequivalent to the Wucheng Loess whileunits ‘B’ and ‘C’ correlate with the Lishi Loess.Among the fossils were various kinds of mammals,especially Myospalax rodents of the steppe region, amole rat which evolved from the lower to upper part ofthe sequence into several different species, identifyingthree subdivisions. When I was studying the fossils ofMyospalax I discovered Teilhard de Chardin and Yanghad studied the reddish clay, but at that time I didn’tknow it was loess.However, in 1954 I began to study the <strong>Quaternary</strong> in theSanmen Gorge region which is the biggest dam on theYellow River, and also a big failure [Constructed bySoviet engineers, the dam quickly filled with loessic siltfrom the Yellow River…JMB]. I was to study the loess overthe Sanmen Gorge region. One evening after a rainy daywith Professor Zhou Mingzhen [recently deceaseddistinguished archaeologist and vertebrate palaeontologist,well known and loved by many Australian andoverseas colleagues…JMB] we went for a walk. I discoveredin the nearby loess gully about two or threelevels of lights. I thought it couldn’t be a three or fourstorey building in that region because at that time itwas still a backward rural area. Were there people livingthere? It was very strange. I was in the southwest ofChina during the second World War and was familiarwith the night illusion of the ‘mountain cities’.The next morning we went to have a look for the sourceof the lights. Then we discovered they were cave dwellingsand the light was from the lanterns used by theresidents of the caves. We then discovered a number ofcaves located at the same level. Why were these cavesbuilt in levels? Each level had its ceiling just beneath alayer of calcareous concretions. We asked the pedologist,the soil scientist Professor Zhu Xianmo. He saidthat was the buried soil, the palaeosol, which is why wecouldn’t find any reddish clay only loess with intercalatedburied soils in the loess plateau. The so-calledreddish clay was recognized as a series of loess bedsinterbedded with buried soils.In 1954 some famous soil scientists from the USSRvisited China. One of them was the soil scientist7 | <strong>Quaternary</strong> AUSTRALASIA <strong>24</strong> (2)
Feature: Interview with Professor Liu Tungsheng CONTINUEDProfessor Kovda who at that time was the consultantgeneral or adviser to the president of the Chinese Academy.Another one was Professor Gerasimov, a famousgeographer and soil scientist. When they were in Beijingmany leading Chinese soil scientists took them on a tripin the vicinity of Beijing and then to the loess plateau. Iaccompanied them also with Professor Yang Zhongjian.In the train Kovda and Gerasimov wanted to talk withProfessor Yang Zhongjian and me about the issue of theloess in China.At that time I didn’t know that Professor Gerasimovconsidered the Chinese loess a kind of pluvial deposit[*pluvial: a Russian term for flood outwash deposits alongthe foothills in arid or sub-arid regions...JMB]. So I justreported to him my observations from Shanxi Provincewhere there is one layer of loess and another layer ofsoil, with several layers altogether. I had dis-coveredeight layers of interbedded loess and soils. We nowknow that each loess-palaeosol pair represents a100,000 year interval. That’s in the upper part of thewhole soil-loess section, although Professor Yanginsisted that was the ‘reddish clay’.Many Chinese studying loess wanted to follow the Soviethypothesis. I held to the idea that it was an geologicallyold deposit, otherwise you couldn’t explain the alternatingdevelopment of the loess and the soil. ProfessorYang disagreed although he had little knowledge aboutsoils. Gerasimov was really very bold; even though hewas younger than Professor Yang he said to me ‘you areright, but I need some specimens to prove it’. ProfessorYang sat over there and I was here and he was on theopposite side, and the interpreter said ‘no matterwhether it is a great authority you have to insist on yourown observation’.I mailed Gerasimov the samples I collected from theShanxi section. Then he wrote a paper about the genesisof the loess and the loess plateau in China. He used mysection and the evidence of the soils but his finalconclusion was that it was a pluvial deposit, an alluvialfan over the mountains in the northern part of China.However our conversation stimulated me very much;I became confident enough to insist that there was analternative view of soil development in loess.In 1961 the sixth INQUA Congress was held in Warsaw,Poland. Professor Gerasimov was a very generous man,so around two years before the congress he came toChina to urge Chinese scientists to join this internationalmeeting. At that time we were quite isolatedwith very few international contacts, except with theformer Soviet Union and other socialist countries. Hewanted to introduce us to the Polish <strong>Quaternary</strong>scientists. Professor Gerasimov also guaranteed therewould not be any trouble for us because at that timeChina held no regular position as a member of theUnited Nations.So I prepared my thesis for the meeting. It was the firstpaper I wrote about the geomorphology of the loessplateau, the so-called Yuan, Liang and Mao. People saidit would not be very interesting to international scientists.At that time I had a copy of the science journal publishedby the American Academy of Sciences. It contained apaper by Emiliani about an oxygen isotope study of theCaribbean Sea. I noticed that there was something similarbetween his curve and the Chinese loess-soil sequence.I prepared a draft of the loess reflecting climatic fluctuation.Unfortunately I had so many cycles of glaciation(more than the accepted four glaciations) that ProfessorLi Siguang [Lee Sze-kwang, JS Lee] along with many otherswas not in favour of this work. He had no previous knowledgeof such climatic variations and, moreover, I was notconfident about it either. I also thought it may not beappropriate to propose alternating changes of the climate.So I changed my idea and handed the new paper intoProfessor Li Siguang. He was one of the older generationsof scientists. He read it and then had a long talk with me.It was a very probing conversation. Professor Li askedme ‘where is the best profile?’. I was working in the Lishicounty of Shanxi Province, so he suggested I use the nameLishi Loess. He listened carefully to my description of theloess profile, then advised me to make a typical stratigraphicsection of the loess from the upper part of theLishi Loess because it was the best exposure in the ShanxiProvince, and also the Wucheng Loess in Wucheng,Shanxi Province (a town not very far from Lishi) wherehad fossils had been studied by Teilhard de Chardin andYang. That was the paper I delivered in Warsaw at the6th INQUA conference.Professor Hou Defeng, the director of the institute,thought it may also be beneficial to include the work ofProfessor Zhang Zonghu from the Ministry of Geology.So Professor Zhang Zonghu and I both prepared thepaper which I presented in Warsaw. Julian Fink was veryinterested in the paper, and also BTU Smith from theUnited States who had developed a fluvial origin for theMissisippi loess. I had a section with me and also somesamples from each layer that I had obtained through atechnique of ‘peeling’ from the loess. A Russian <strong>Quaternary</strong>scientist, Madam Kes [a strong proponent of the‘pluvial’ theory...JMB], also gave a talk on Chinese loess.Dylik from Poland was also interested. Dylik had the ideathat loess deposits were from periglacial deposits. Fink,a very kind person, had experience of the Paudof soil inEurope and thought that may provide an answer to theChinese loess. This gave us confidence to further studythe loess in China. We undertook a collective study andpublished the books The loess in the middle reaches of theYellow River, The loess of China and also The texture andcomposition of loess.8 | <strong>Quaternary</strong> AUSTRALASIA <strong>24</strong> (2)
Figure 4: Dinner in Luikiang,1975. From left, LiuTungsheng, Mr Shou,unknown, Donald Walker.(Photo: Ian McDougall)CULTURAL REVOLUTION INTERRUPTIONSBut then came the cultural revolution. Initially it wasn’tso bad for me because I had little trouble with the youngpeople working with me. However, at a later stage theywanted to be sure about the political history of eachpupil. So one day some of these young people, the RedGuards or suchlike, declared that I was some kind ofspecial agent. I was detained and placed in a cowshedwith others. That was a kind of protective measure bythe government, because many people committedsuicide in isolation.Many of my friends like the late Professor Li Pu, agraduate of Cambridge, committed suicide. He wasonce a party member but later separated from thecommunist party and people said he was a kind of rebelfrom the party. At that time his wife was not in Guiyangso he committed suicide. Another good friend ProfessorSu was a graduate from the Moscow Exploration andMining University. When he was younger, his family wasa landlord so he became a landlord. He committedsuicide also, because he was isolated like Professor Li.The government wanted to stop the cultural revolution.After two or three years they asked the workers to goback to their factories to produce, the students to goback to their schools, and the scientists to go back totheir laboratories. But they couldn’t stop the situationso in 1973 or 1974, there was a movement to try torestore the regular life of the society. That was aroundthe time Mao Zedong invited ping pong players toChina; he tried to contact the US, and President Nixonsent delegates to contact the Chinese. This was a kind ofturning point.VISION FOR THE FUTURE:THE AUSTRALIAN CONNECTION1975 was the turning point for renewing studies. TheAustralian delegation was coming to China, so we had todo some basic work to show others. We had a few loessstudies in Guiyang and Beijing but only work from beforethe cultural revolution. So in 1975 I came back to loessand we undertook palaeomagnetic and other studies.Our Australian friends were interested in the Chineseloess studies and other scientific studies. After 1975,the Chinese Academy included Madam Wang Zunji andmyself on its visit to Australia. After that visit DonaldWalker and the Chinese, including Huang Bingwei,discussed a program of collaboration. That was the startof training for young people like An Zhisheng, SunXiangjun, Huang Qi, Yuan Baoyin and many others. Theystudied in Australia for one or two years. This type ofcollaboration had never been practised before.So there was a very concentrated study of loess during thelate 1980s and the early 1990s. This intensivestrengthening of <strong>Quaternary</strong> studies in China laid thefoundation for the advance of <strong>Quaternary</strong> scientists inlater years, like An Zhisheng who went on to develop aseparate loess laboratory, Wen Qizhong who developedgeochemistry in Guiyang and Guangzhou, and SunXiangjun who specialized in palynology. This kind ofcollaboration really brought a magnificent result. Sothanks go to our Australian colleagues. It is acollaboration worth remembering and exploring further.[Palaeomagnetic studies generously supported by Ken Hsüand Freidrich Heller led to a new stage of loess work withadditional sections studied, as by Han Jiamao and DingZhongli on new profiles in Jixian and Bojee, ShaanxiProvince, and by Liu Xiuming at Xifeng, Gunsu Province aswell as the Luochuan section. Studies by Guo Zhengtanghave identified what appears to be loess of Mioceneage…JMB]9 | <strong>Quaternary</strong> AUSTRALASIA <strong>24</strong> (2)
Feature: Interview with Professor Liu Tungsheng CONTINUEDI became interested in the loess because I solved theproblem of the palaeosols which were erroneously calledreddish clay of fluvial origin. Other opportunities, such asKen Hsü inviting me to Switzerland, gave me the chanceto discover magnetic susceptibility records as proxies forclimatic cycles.[Liu addresses issue of specialization,a very interesting andimportant one that has to be addressed in China requiringmulti-disciplinary approaches in the context of the need torespond to issues of social importance...JMB]VISION FOR THE FUTUREFigure 5: Prof. Liu Tunsheng enjoys a point in discussions withDr Alan Thorne and Prof. Joe Jennings, near Yangsu, KwangsiProvince, 1975. Interpreter, Mr Shao Mingshen partly obscured.(Photo: Ian McDougall)In the late 1950s I was asked to be a director of thelaboratory of <strong>Quaternary</strong> Studies. That was the time ofestablishment of the new People’s Republic, a newlyestablished government with new priorities. Reconstructionof the government, restoration of industry,and the improvement of agriculture were priorities. Therecently established government was not interested inthe advancement of science or the arts. For my part, if Ichose to be an eminent palaeontologist and studyforeign languages I would have to do many things thatthe political environment would not allow. So I decidedI would not go that way. I chose to dedicate my experienceand time to the education of young people, tobuild up a group of people, a team who could work inthis field.I believe that was the right choice. <strong>No</strong>t only was Ielected vice-President and President of INQUA in 1991,I was elected President of the Chinese <strong>Quaternary</strong><strong>Association</strong> and appointed head of the Chinese groupin the Australia-China collaboration. I didn’t have timeor the opportunity to advance my studies during thatcollaboration but I helped others to improve theirability, like An Zhisheng and Sun Xiangjun, to collect agroup of people to work together. The prizes I wasawarded (including the Tyler Prize) are to me a rewardfor the collective or team work of the group. Withoutthat team, I would not have achieved these accomplishments.Even the National Supreme Award of Science andTechnology of China, the highest science and technologyprize, was bestowed on me because I had a group ofpeople working together. We had the beginnings of aninnovative program of cooperative work on the loess.Younger scientists have to influence politicians or policymakers and be aware of their responsibility to society.People still remain concerned with themselves or theirown family or their own small group rather than theoutside world. That’s why many geologists focus onmineral resources and want to specialise in this area;other issues of land and environmental resources areneglected.Last year at the presentation ceremony of the Li Siguangprize – JS Li was a very distinguished geologist in China –one of the governors said that ‘the Geological Society hasto change, a change in orientation and priorities’. That is,geological science should adopt an approach to earthsystems. The geological community must broaden itsview to include environmental issues.I’m really very pleased about these new developments.At the 32nd Geological Congress people were talkingabout the Planet Earth program. In that programattention is being paid to environmental studies; peoplewill pay more attention, not only to pollution and otherenvironmental aspects, acknowledging human impactor human activity as a kind of geological agent. I’mexpecting a renaissance of geology. Global change hasthe ability to be one of those issues that breaks down thebarriers. I think that is why the Tyler prize and theNational Prize considered our work, because we broughtthe issue together as a kind of collective work, a convergence.Just as Teilhard de Chardin mentioned in hiswork, no matter where you are, environmental issuesare the same.I believe these issues are timely for China, althoughI’m not sure if we have much influence. At a recentmeeting in Tianjin the main concerns were urbangeology, geological hazards, the geology of agricultureand land planning, and the geology of surficial deposits.So there is a move away from classical mineral depositsto more environmental issues.Thank you. This has given me a chance to explore manyareas I have not previously documented.10 | <strong>Quaternary</strong> AUSTRALASIA <strong>24</strong> (2)
Research ArticleA Reconnaissance Study of Glaciation on theOwen Massif, <strong>No</strong>rthwest Nelson, New ZealandOlivia M Hyatt, James Shulmeister, Chris C. SmartOlivia M Hyatt (corresponding author), Department of Geological Sciences, University of Canterbury, New ZealandFax: +64 3 364 2769 Email: omh13@student.canterbury.ac.nzJames Shulmeister, Department of Geological Sciences, University of Canterbury, New ZealandEmail: james.shulmeister@canterbury.ac.nzChris, C. Smart, Department of Geography, Social Science Centre, University of Western Ontario, CanadaEmail: csmart@uwo.caAbstractA preliminary investigation of past glacial activity onthe Owen Massif in northwest Nelson, New Zealandis presented. There is good evidence for extensive iceaccumulation on the massif. Glacial erosional featuressuch as U shaped valleys, ice smoothed bedrock knobsand glaciokarst pavements are widespread. Preservationof glacial depositional landforms is poor, because of theextensive karst processes operating on the massif andfluvial action in the valleys. Sediment accumulation wasconcentrated in large pre-existing karst depressionscentered on and around Sentinel Hill. The glacial landformsand processes appear different from surroundingnorthwest Nelson landscapes. <strong>No</strong> true terminal positionshave been identified, though it is clear that icedid flow off the massif and advanced at least a few kilometresdown the upper Granity and Owen valleys.Fluvial valley forms dominate the valleys radiatingfrom the massif where initial U shapes valleys quicklybecome fluvial incised. Further investigation is warrantedin the caves, where sediments and speleothemspotentially hold the best archives of glaciation.IntroductionMount Owen is the highest peak of a spectacular upthrustedmarble massif at the southern end of KahurangiNational Park, northwest Nelson, New Zealand(Figure 1). The Owen Massif has been stated to be thebest example of glacial karst in New Zealand (Williams,1992), but there has been no specific study on theglacial landforms or sediments on the massif. Thispaper presents the results of a reconnaissance glacialstudy of the Owen Massif.Glaciation was widespread in the mountains of SouthIsland during the <strong>Quaternary</strong> (e.g. Suggate, 1965) butthe main ice cover was confined to the Southern Alpsand splay ranges. To the east and south of Mt Owen, icesourced from the Nelson Lakes area (Figure 1) extendedinto the Buller River. These ice advances have receivedmuch attention from Suggate (1965, 1988 & 1993) whohas mapped out a series of moraine limits (near theNelson Lakes) and inferred correlations along the BullerRiver using terrace slopes and levels.Evidence for glaciation in northwest Nelson was firstmentioned by Dobson (1872), with more a substantialsurvey by Henderson (1923 & 1931). Most of this workconcentrated on the Arthur Range and Tasman mountains(Figure 1) to the north. More recently, Shulmeisteret al. (2001; 2005) published in depth studies of theglacial history and chronology of the Cobb Valley, inthe Tasman Mountains. Work by groups from Canterburyand Victoria Universities is ongoing in the Tasmanmountains and adjacent areas. Published work on theOwen Massif is sparse. Henderson (1931) inferredglaciers of about three kilometres in length drainingthe northern Owen massif into Nuggety and Blue creeksand ice draining from the southern half of the massifinto the gorges of the Fyfe and Owen rivers. <strong>No</strong> terminalpositions were identified.Coleman (1981) briefly mentioned moraines on MtOwen and terraces relating to the last glaciation inthe Wangapeka and Owen valleys. The aggradationalterraces were loosely related to two aggradationalFigure 1 (left). Location of northwest Nelson and Owen Massif,with major rivers, lakes and mountain ranges in the area.11 | <strong>Quaternary</strong> AUSTRALASIA <strong>24</strong> (2)
A Reconnaissance Study of Glaciation on the Owen Massif CONTINUEDFigure 2 (left).Geology of the Owen Massif(modified from Coleman, 1981)and location of the majorgorges adjacent to the massif.Figure 3 (right).Simplified geomorphologicalmap centered on Sanctuary Basin,with insert of the main OwenMassif landmarks.sequences of Speargrass and Tophouse formationsdefined by Suggate in the Nelson Lakes area. Correlationinto the upper Owen valley was tentative asColeman could not link the moraines on the massif tothe terraces in the Buller. Williams (1992) in an overviewof New Zealand karst, mentions some glacial and karstlandforms on the massif. A map of ice extent andlocation was included. He described small scaleglaciation on the massif and a central ice-field in theSentinel Hill area, which had small glaciers radiatingto the north, west and east of this central accumulationzone. He also states that ‘the topography of the regionappears essentially freshly glacial’. In summary, theexistence of glacial features on the massif is widelyaccepted but absence of any coherent marginal featureshas prevented any fuller description and interpretation.Physiography & GeologyThe Owen Massif is a raised block of marble, c. 35square km in area, roughly 4 km wide and 9 km longaligned about a northeast–southwest axis. Most of themassif is above 1300 m and it has a number of peaksabove 1700 m with three over 1800 m (Figure 3). Theedges of the massif are very steep, locally vertical, andthere is a 300–500 m drop to the valley floors that ringthe massif. NW Nelson contains many of the oldestrocks in New Zealand and is part of the Australianplate. As such it contains extensive areas of granites,metamorphosed limestones (marbles) and volcanicmeta-sediments of Palaeozoic and Mesozoic ages(Rattenbury et al., 1998). Major faults dissect thelandscape into a number of fault bounded structuralslices. The Mt Owen massif is up-thrusted between theOwen and Dart faults (Coleman, 1981), both runningnorth to northeast. The massif is composed of TakakaTerrane (Figure 2) rocks including the Owen, ArthurMarble and clastic Wangapeka Formations (Rattenburyet al., 1998).The Owen Formation, a largely siliceous unit andoutcrops on the south side of the massif (Figure 2),conformably underlies the Arthur Marble Formation(Coleman, 1981 & Rattenbury et al., 1998). The ArthurMarble Formation is primarily a light grey coarsegrainedmarble, with some dark siliceous sandy bedsand chert nodules. It is intensely deformed, and has athickness of about 1500 metres (Coleman, 1981). Itcomposes most of the Owen massif (Figure 2). TheWangapeka Formation conformably overlies ArthurMarble and outcrops locally over parts of the massif(Figure 2). On the massif it is composed of laminatedsiliceous dark grey pyritic siltstone and lighter sandstonebeds with black carbonaceous horizons and thinquartzite beds (Coleman, 1981). These clastic sedimentsare important as they preserve a record of glaciationmore strongly than the carbonates.The eastern side of the massif is bounded by the DartFault (Figure 2). To the east of the fault highly weatheredSeparation Point Granite outcrops as the roundedLookout Range. The contact roughly runs along the12 | <strong>Quaternary</strong> AUSTRALASIA <strong>24</strong> (2)
upper valley floors of the Owen and Granity valleys(Muir et al, 1995). In addition to the Separation PointGranite in the Lookout Range, two small inliers ofhornblende rich Andesite of slightly older age (RiwakaIgneous Complex) crop out on the western side of themassif itself (Figure 2).There is extensive glacial karst including some of thelongest, deepest and oldest caves in New Zealand. Thesurface is a classical “rundhocker” karst composed ofglacially sculpted roche mountonees variously solutionallyetched by a range of karren, particularly in bedsof purer marble. Between ridges is a wide spectrum ofdolines some over 500m in diameter. Some dolines aremerely sinks for local karren fields, others are abandonedkarst shafts truncated by glacial erosion, whileothers are choked by debris and many doline fields aredeveloping in recent alluvial deposits that floor largerdoline forms. Some dolines are aligned and may reflectgeological lineaments and contacts promoting caves.ClimateThere are few formal climate records for this area. Thetwo closest stations are at Wangapeka (elevation 259m,decommissioned), about 16km northeast of Mt Owenand Murchison township (elevation 158m), south westof the massif (Figure 1). From 1941 to 1970 the stationat Wangapeka recieved an average of 1771 mm per year,and Murchison had 1558 mm per year (NZMS, 1970).There is a strong orographic and west-east precipitationgradient in northwest Nelson. The Owen massif interruptsthis westerly flow and will have a much higherprecipitation total due to its higher elevation. For twosummers (1967/68 and 1968/69) minimum and maximumtemperatures were measured intermittently byBell (1970) at Granity Pass Hut. Daily temperaturesranged from about -1°C to 26°C. Even more limiteddaily readings in winter ranged from about -5 to 10°C.MethodsField work was undertaken over the summers of 2004and 2005, based largely from Granity Pass Hutt (Figure3). Areas of the north and southwest of the massif werecovered during a number of multi day trips. Glacial andkarst geomorphic features where mapped at a scale of1:30 000 on aerial photographs and the Wangapekatopographic map sheet (M28). Because of limited fieldtime and the nature of the area not all parts of themassif were fully field checked. The majority of theglacial deposits and other substantial glacial evidence isconcentrated in the northern part of the massif, whichis presented here as figure 3. A glacial geomorphologicalmap of the whole massif is presented as anappendix online (www.aqua.org.au).In the field, hand specimens of rocks from inferredmoraines were examined for glacial phenomena (striations,faceting etc), though outcrops were poor andsparse. Some samples from boulders on the northernflank of Sentinel Hill were recovered for cosmogenicexposure dating, though the results from this are notyet to hand.13 | <strong>Quaternary</strong> AUSTRALASIA <strong>24</strong> (2)
A Reconnaissance Study of Glaciation on the Owen Massif CONTINUEDResultsA simplified geomorphological map (Figure 3) of themain features of the central Owen Massif is presented(and see online appendix). The major glacial featuresidentified are U shaped valleys, rounded bedrock hills,lateral moraines, kames, hummocky ground morainesand fluvioglacial veneers. Accessory features includeerratics, and glacio-karst features dominantly suffusiondolines and glaciokarst pavements. Due to their sizeand quantity, dolines and glaciokarst pavements havenot been included in Figure 3. These features have beendivided into glacial erosional and glacial depositionalgroups.Glacial erosional landformsU-shaped valleys, virtually box canyons, are widespreadon the massif (Figure 3 and online appendix). Some ofthese valleys are consistent with regional N–S alignmentsuch as Blue Creek, but others cross cut the structure,such as Granity Pass. All the U shaped valleys transitioninto V-shaped valleys down stream, in some cases, thisis marked by gorges incised into the U shaped valleyfloor. The U shaped valley floor shoulders above thegorges sometimes have a cover of hummocky groundmoraine. The U-shaped valleys terminate abruptly at themassif edge but a north-south aligned U shaped valleyextends 1.5 km north and about 3 km south along thecontact with the Separation Point Granite (Figure 2, 3and online appendix).Glacially smoothed hills and knolls are widespread.These occur on all scales from a few metres to manyhundreds of metres in size. Bedding control is importantbut many of the smaller features align with thelocal U shaped valley systems. Knobs between ReverseBasin and Blue Creek (Figure 4 and 5,a) are the bestexamples of ice smoothed ridges. We do not specificallyidentify cirques, though several good candidates exist,because of the difficulty of separating karst basins fromtrue cirques.Glaciokarst pavements are dotted around the massif.They form parallel or sub-parallel to bedding and joints.Very locally glacial striations and chatter-marks arepreserved on the pavements (Figure 5,b). Most of thepavements, however, have had some dissolution sinceformation and some display frost shattering. Excellentexamples occur north of Replica Hill (E <strong>24</strong>71130, N5963330) and on the east side of Blue Creek (E <strong>24</strong>73630,N 5967120), near the lateral moraine of figure 5,c.Glacial depositional featuresLateral moraines and kame complexes are present ininternal valleys on the massif between Sanctuary Basinand Reverse Basin and north of Billies Knob (Figure 3 &4). The composition of the kame terraces and terminalmoraines is unknown, due to a lack of exposure. Theycomprise ridges that flank the valleys and have ahummocky surface. The amplitude of the hummocks isin the order of a few metres.Hummocky ground moraine (represented by diamictonin Figure 3) is present on some of the floors of theinternal valleys on the massif and on some of the valleyfloors leading to the edge of the massif. The best knownglacial feature on the massif, the so-called railway ridgenear Granity Pass Hut (Figure 3, 4 and 5), is in factremnant ground moraine dissected by drainage tocreate a ridge like feature. This ridge is composed of atleast 15 m of diamicton with frequent striated andfaceted clasts and contains Wangapeka lithologies aswell as rare hornblende rich Andesites. West of the headof this feature is a series of fluvioglacial kame terraces(Figure 3 and 4) which host a set of minor ponds a fewtens of m above the valley floor. The low lying positionsuggests that these were associated with the very last iceoccupying the valley floor.Moderately sorted large pebble to cobble size clastics,with well-rounded, Wangapeka insoluble gravels mantlemany surfaces and benches perched above valley floors(alluvium on Figure 3) indicating fluvial overflowadjacent to former glaciers (Figure 3 and 5,d). There arealso some coarse cobble and gravel remnants on somesharp ridge crests (e.g. between Blue and Granity creek).Valley floor fills are more complex (Figure 6), rangingfrom morainic ridges dissected by streams, clastic andorganic pond and channel deposits. Valley sidematerials and talus are also encroaching onto valleyfloors. Many of these deposits are now becoming pockmarkedby suffusion dolines, except in areas of thickaccumulation like in Poverty Basin (Figure 5,d).Striated and faceted clasts have been collected from amatrix supported, pebble to boulder diamictonoutcropping in poorly exposed, suffusion modifiedmoraine west of Sentenal Hill. The striae in the clastsare aligned at orthogonals along the A–B plane. A singlestriking example of a Wangapeka erratic lodged directlyonto karstified Arthur Marble has been observed at gridreference E <strong>24</strong>71633, N 5964225 (Figure 3).A notable absence is that of marble clasts. <strong>No</strong>ne havebeen recorded in any of the outcrops. An importantquestion is why? Where has all the eroded marble gone?Other LandformsLike many alpine karst areas, the glacial molding of MtOwen is gradually being modified by processes ofsolution and suffusion that lead to re-establishment ofkarst. Frost shattering and mass movements arecompeting with these karst processes (Smart, 2004a).14 | <strong>Quaternary</strong> AUSTRALASIA <strong>24</strong> (2)
Figure 4. (above) Photo ofSanctuary Basin in foreground,with annotated landmarks ofRailway Ridge, ice roundedbedrock hills, kame terraces and alateral moraine.Figure 5. (left) Four photos ofcommon landforms on the massif.(a) Ice smoothed hills (1), with thelargest over 120 metres high and alateral moraine (2). (b) Glaciokarstpavement, north of ReplicaHill, with Mt Patriarch in thebackground. <strong>No</strong>te the smallindentations in to foregroundmarked with arrows and thetruncated karren. (c) Lateralmoraine (approx. 6 metres high)north of Billies Knob, withCulliford Hill in the clouds, leftbackground. The arrow points to ahalf of a person for scale.(d) Poverty Basin, approximately500 metres across, with a thickclastic fill.15 | <strong>Quaternary</strong> AUSTRALASIA <strong>24</strong> (2)
A Reconnaissance Study of Glaciation on the Owen Massif CONTINUEDFigure 6. Two photos of common landforms on the massif. (a) A valley south of Mount Bell (left of photo) showing suffusion dolinesalong the valley floor in the lower and left middle ground. The ice rounded knob in the middle background is approximately 40 metreshigh. (b) Castle Basin a large closed depression viewed from its northern end. The valley walls range up to 160 metres high, withhummocky sediment along its base and sides, in places pocked with suffusion dolines.DiscussionThe physiognomy of the area studied is heavily influencedby local geology and its structural characteristics.Many curious landforms like linear ridges and shearcliffs are related to structural elements (Figure 2 & 3),while the manifestation of glacial landforms dependson whether marble or clastic siltstone is the bedrock.The composition and structure of the marble alsovaries. The more massive and pure, the more karsticprocesses dominate, whereas in areas with more defectsand insoluble inclusions, processes like frost shatterdominate. This composite landscape is typical ofglaciated karst (Smart, 2004b).The marked glacial sculpturing, landforms andsediments indicate that the whole of the massif washeavily glaciated during late <strong>Quaternary</strong> glaciations.Well developed cirques are present in the northwestNelson region at elevations between 1250 and 1400metres above sea level. These head well defined andsubstantial U-shaped valley forms, like those of theheadwaters of the Karamea River. Given that the wholeof the massif lies at 1300 m + (Figure 3 and onlineappendix) the massif must have been a major source ofice during pleniglacial periods.As with any glacierised karst, there is competitionbetween underground and surface drainage mediatedlargely by sediments that may choke caves. Low flowsmay be accommodated underground, but higher flowslead to ponding and overflow, leading to a peculiarlyacute erosional flow regime. The marble, like manymassive carbonates does not appear to generate largeamounts of debris under glaciers, and the Wangapeka isinferred to be the primary source of the majority ofclastics. The presence of fluvio-glacial deposits onelevated benches and cols indicates that substantial icemarginal streams were operating at grade elevationswell above the valley floors. These overflow streamswould have been extremely erosive given their clasticload and steep gradients, and were presumablyresponsible for the radial gorges in the outlet valleys.Despite these general inferences, there is little apparentconcordance between these sedimentary remnants, sodetailed glacial reconstruction is not possible.The elevated position of the plateau makes it likely toexperience significant snow accumulations duringwetter and cooler conditions. However, classical alpinecirque morphology has not developed here as it has onadjacent ranges. This implies that ice accumulation wasnot governed by simple altitude-governed lapse rates.The geomorphic evidence suggests that ice accumulatedin the centre of the plateau and other largedepressions, radiating out through resistant bedrockhills. Diminishing ice was preserved in the lowerground in the central plateau which indicates icerecession was not a retreat to higher attitude.The existing morphology of the plateau core is dominatedby the insoluble Wangapeka inlier constitutingSentinel Hill (Figure 2). Streams gathering on this areawould have flowed off the hill sinking into thesurrounding marble. The large (approx. 300 by 400metres) closed depression of Reverse basin (Figure 3)was presumably the dominant sink point. This basinwas apparently the focus of glaciation even though itlies hundreds of metres lower than the surroundingpeaks, e.g. over 400 metres lower than Culliford Hill tothe northeast (Figure 3). Where the host basin is as largeand deep as that inferred on Mt Owen, a considerable16 | <strong>Quaternary</strong> AUSTRALASIA <strong>24</strong> (2)
volume of ice would have accumulated before outflowto lower altitudes would have occurred. Outflow towarmer, lower altitudes is the primary mechanism bywhich glaciers achieve neutral mass balance. Thus MtOwen may have accumulated an unusual thickness ofice occupying the central plateau.Williams (1992) has inferred the presence of a numberof radiating glaciers from the Sentinel Hill core. Initiallythese may have been numerous, lapping over every lowpoint in the encircling divide. A number of outlet colsconveyed ice from Reverse Basin into Blue Creek (figure3). Competition between outlets will be regulated bytheir ice discharge, velocity and erosion rate. The deep,steep flanked cut through Granity Pass to the GranityCreek appears to have eroded down. The Granity Passroute was finally captured by Blue Creek. This issomewhat surprising as the overall terrain gradient isnot steep. This indicates significant ice accumulationsin the Sanctuary Basin. Culliford Hill ice would haveoverflowed into an occupied Blue creek, forcing SentinelHill ice out into Grantity creek. Under late glacial conditions,ice no longer flowed directly into Blue Creekfrom Culliford Hill and the Granity lobe reverted downBlue Creek. Sanctuary Basin was the last point of conspicuousice on the northern part of the plateau as isindicated by the low lying ice contact deposits.There are significant morphological incompatibilitiesbetween the land surface and presumed ice flow: deeplyincised valleys such as Blue Creek and closed depressionssuch as Poverty Basin and Castle Basin (Figure 3,6 and online appendix). Ice flow is primarily controlledby surface gradient, so basal slope means that icecannot readily flow through closed depressions.However, sediment fills adjacent to these depressionsindicate that there were occupied by sedimentsubsequently swallowed by the underlying karst.This sediment fill concept is readily transferred toradial valleys where incision slots can be occupied bysediment during ice advances, and re-excavated onretreat. The Railway ridge is inferred to be a filloccupying the head of Blue Creek when ice flow wasfocused though Granity Pass. Off the plateau, postglacialerosion of steep slopes and dense forest covermake detailed mapping of outlet valleys difficult. Theradial valleys were occupied by glaciers with very largegross mass balances (massive accumulation of1–5m.m 2 . a -1 and mean annual temperature of +5°-+10°C). Such ice is unlikely to have well defined stabletermini and would be dominated by sandurs (in valleys)and alluvial fans (at outlets). Most of the glacialevidence in the engorged valleys was probably destroyedby fluvial processes (floods) during the deglaciation.The style of glaciation inferred here diverges from that inother parts of north-west Nelson. In Cobb Valley, a fullsuite of valley glacier phenomena are recorded includinga large sequence of terminal moraines and numerouslateral moraines and roche mountonee fields (Shulmeisteret al., 2001). On the Owen Massif the evidence ismuch more fragmentary, largely because karst processeshave modified or destroyed much of the evidence.Provenance analysis is quite revealing. The Wangapekaclasts found in the Railway ridge crop out near SentinelHill while the clasts of andesite should come from theonly known outcrop which is 3–4 kilometres west ofGranity Pass. The Wangapeka clasts imply that ice flowinto Granity Pass was sourced from the major peaks tothe south of the Pass and, rather more surprisingly, theandesite requires eastward flowing ice derived from thevery western most limits of the massif. This not feasibleif ice flows were minor and implies either a) that otherunmapped outcrops of the Andesite occur on the massifor b) that reversals of ice flow occurred at times ofsubstantial ice cover. We cannot discriminate betweenthese hypotheses based on our data. We conclude thatice flows involved at least two stages. During the earlystages of advances ice flowed into the basins on themassif. As ice built up in the basins, divides were overtopped,flows locally reversed and a small ice cap developedover the massif, directing flow off the massif in aroughly radial pattern.The four main rivers (Granity, Nuggety, Fyfe and Owen)that drain the massif flow through at least one deepgorge within a few kilometres after leaving the massif(Figure 2 & 3). There are inset V-shape profiles in U-shape valleys. These are represented by terraces aboveor on top of gorges. This V in U topography has beennoted elsewhere in northwest Nelson (Henderson, 1931and Shulmeister et al., 2005) and was inferred byHenderson to indicate an earlier, much larger glacialphase. In order for a V-shaped profile to develop withinthe U there are two possibilities. The first, as perHenderson, is that the U-shaped valleys have not beenextensively occupied by ice during recent glaciationswhich suggests that the scale of glaciation is diminishingin NW Nelson. Since this area was more tectonicallyactive during the early <strong>Quaternary</strong>, such an inferenceis reasonable. However, an alternative hypothesisthat the V’s are either filled with ice, or more likelyaggradation gravels during glacial advances, and thatactive ice may over-run an occupied V-shaped valleywithout eroding the V out. This model has beenproposed on the European Alps (De Graaf, 1996).ConclusionsThe weight of evidence suggests that the whole of theOwen Massif was an ice accumulation zone at timesduring previous glaciations. We infer that accumulationwas focused on pre-existing karst closed drainages andaccumulated as a central ice body until ice overflowed17 | <strong>Quaternary</strong> AUSTRALASIA <strong>24</strong> (2)
into adjacent valleys. There is little direct evidence ofglacial maxima as U shaped valleys quickly becomeincised and there are no marginal or terminal depositsidentified in the valleys off the massif. It is inferred thatthe outlet glaciers headed extremely active riversystems. During advances the valleys became filled withoutwash gravels now preserved as terrace remnants fardownstream, while on retreat the valleys were rapidlyincised removing the valley fill. Further work is neededto define the ice limits, although the prospects forlocating key features are not promising.The glacial-karst morphology and process suite werequite distinct from those on surrounding non-karstlandscapes. The closed depressions appear to havepromoted ice accumulation and outlets have competedfor dominance. The role of ice versus fluvial-glacialerosion remains equivocal, as there is very poor surfacepreservation and outcrops of glacial deposits. It isexpected that the best long-term archive will bepreserved in caves under the massif. A combinedsurface and sub-surface investigation is the only likelyway of determining the glacial history more detailedthan presented here.AcknowledgementsWe thank the Department of Conservation for permits to work onthe massif. Funding for the fieldwork was provided by a MasonTrust grant to OMH. The study was a pilot for a proposed MSc forOMH. The challenging conditions encountered resulted in theproject being redirected! Special thanks to all the field assistantswho were willing to do the long walk in.• Rattenbury, M.S., Cooper, R.A., Johnston, M.R. (compilers),1998. Geology of the Nelson area. Institute of Geological &Nuclear Sciences 1:250 000 geological map 9. 1 sheet, 67pp.Lower Hutt, New Zealand.• Shulmeister, J., McKay, R., Singer, C., & McLea, W., 2001.Glacial geology of the Cobb valley, northwest Nelson. NewZealand Journal of Geology & Geophysics, 44, 47–54.• Shulmeister, J., Fink, D., Augustinus, P.C., 2005. A cosmogenicnuclide chronology of the last glacial transition in <strong>No</strong>rth-WestNelson, New Zealand – New insights in Southern Hemisphereclimate forcing during the last deglaciation, Earth andPlanetary Science Letters, 233, (3–4), 455–466.• Smart, C.C., 2004a. Alpine karst, In Gunn, J. (editor).Encyclopaedia of Caves and Karst. Fitzroy Dearborn New York.31–33.• Smart, C.C., 2004b. Glacierised and glaciated karst. In Gunn J.(editor). Encyclopaedia of Caves and Karst. Fitzroy DearbornNew York. 388–390.• Suggate, R.P., 1965. Late Pleistocene geology of the northernpart of the South Island, New Zealand, New Zealand GeologicalSurvey Bulletin, 77.• Suggate, R.P., 1988. Late Otira glaciation in the Upper Bullervalley, Nelson, New Zeland, New Zealand Geological SurveyRecord, 25, 13–25.• Suggate, R.P., 1993. Late Pliocene and <strong>Quaternary</strong> glaciation ofNew Zealand. <strong>Quaternary</strong> Science Reviews, 9, 175–197.• Williams, P.M., 1992. Karst of New Zealand. In Soons, J.M, &Selby (editors). M.J., Landforms of New Zealand, (2nd edition),Commonwealth Printing Press Ltd, Hong Kong. 119–122.References• Bell, C.J.E., 1970. A study of soils and vegetation on marble andon schist in the Owen Range, Nelson. MSc, Victoria University,Wellington.• Coleman, A.C., 1981. Part sheets S18, S19, S25, & S26Wangapeka. Geological Map of New Zealand 1:63,360. Map (1sheet) and notes (48p.). Wellington. New Zealand Departmentof Scientific and Industrial Research.• De Graaf, L.W.S., 1996. The fluvial factor in the evolution ofalpine valleys and of ice-marginal topography in Vorarlberg (W-Austria) during the Upper Pleistocene and Holocene. Zeitschriftfür Geomorphologie, Supplement-Bd, 104, 128–159.• Dobson, A.D., 1872. On traces of ancient glaciers in NelsonProvince. Transactions of the New Zealand Institute, 4, 336–341.• Ford, D.C. and Williams, P.W., 1989. Karst Geomorphology andHydrology. Allen & Unwin Ltd, Wellington, New Zealand.• Henderson, J., 1923. Departmental report. <strong>No</strong>tes to accompanya geological sketch-map of the Mount Arthur District. NewZealand Journal of Science and Technology, 5, 174–190.• Henderson, J., 1931. The ancient glaciers of Nelson. NewZealand Journal of Science and Technology, 13, 154–160.• Muir, R.J., Weaver, S.D., Bradshaw, J.D., Eby, G.N. and Evans,J.A., 1995. The Cretaceous separation point batholith, NewZealand: granitoid magmas formed by melting of maficlithosphere. Journal of the Geological Society, London, 152,689–701.• NZMS 1973. Rainfall normals for New Zealand 1941–70. NewZealand Meteorological Service Miscellaneous Publication 145.Wellington, New Zealand, Government Printer.18 | <strong>Quaternary</strong> AUSTRALASIA <strong>24</strong> (2)
Research ArticleLate Pleistocene environments in theFlinders Ranges, Australia: Preliminary evidencefrom microfossils and stable isotopesPeter Glasby, Martin A.J. Williams, David M. McKirdy, Rex Symonds, Allan R. ChivasPeter Glasby, David M. McKirdy: Geology & Geophysics, School of Earth & Environmental Sciences, University of Adelaide, Adelaide, SA 5005Martin A.J. Williams: Geographical & Environmental Studies, School of Social Sciences, University of Adelaide, Adelaide, SA 5005.Rex Symonds: Darwin High School, Darwin, NT 8000Allan R. Chivas School of Earth Sciences, University of Wollongong, Wollongong, NSW 2500Corresponding author: pglasby@picknowl.com.auSummaryA spectacular eight-metre vertical outcrop of flat-lyingLate Pleistocene non-marine silts and clays forms thenorthern bank of Brachina Creek at the easternentrance to Brachina Gorge in the now semi-aridFlinders Ranges of South Australia. Deposited between∼35 and ∼18 ka, these wetland sediments thereforeencompass the Last Glacial Maximum (LGM, 21 ± 3 ka)which was a time of colder, drier climate throughoutAustralia. Quantitative analysis of the microfauna infifteen bulk sediment samples indicates a fluctuatingfreshwater environment and reveals a hiatus betweenthe lower and upper parts of the section. The lowermassive clay unit was laid down during a period ofclimatic stability and has a diverse assemblage ofostracods and molluscs, comprising both free-swimmingand benthic forms. Faunal diversity decreases inthe laminated silty sediments above the hiatus; fossilnumbers fluctuate more markedly and shell fragmentsare more abundant, suggesting a somewhat moreenergetic and less stable environment. Carbon andoxygen isotope analyses show comparable values for codepositedmolluscs and ostracods, both indicating afresh water regime.The locality provided a moist refuge during a time ofextreme regional aridity. The environmentalperturbations recorded in its sediments are relevant tothe wider investigation of global climate change duringthe LGM and immediately prior to the Holocene.IntroductionAquatic microfossils have been used extensively asindicators of past fluviatile or lacustrine environments(Holmes, 2001; Miller and Tevesz, 2001). Two differentapproaches are commonly employed. First, the fossilassemblage and the size distribution of individualswithin a given species can help distinguish high and lowenergy settings (Holmes, 2001). Second, the stableisotopic composition and trace element geochemistryof calcareous shells provide a quantitative record of thetemperature and salinity of the aquatic environments inwhich the parent fauna lived (Ito, 2001).Figure 1. Map showing location of Section 1in the central Flinders Ranges, South Australia.The Flinders Ranges extend approximately 400 kmnorth-south between 30°S and 33°S, along a meanmeridian of 138.5°E (Figure 1). They rise abruptly 600 mabove the level of the adjacent plains to the west, theeast, and the north. These plains are arid lowlandscovered by gibber (stony desert), fields of longitudinalsand dunes and salinas intersected by mainlyephemeral drainage channels that ultimately dischargeinto Lake Torrens, Lake Eyre and Lake Frome (Twidale,1996; Williams et al., 2006). The Ranges are best knownfor their thick succession of weakly metamorphosed,19 | <strong>Quaternary</strong> AUSTRALASIA <strong>24</strong> (2)
Late Pleistocene environments in the Flinders Ranges CONTINUEDFigure 2. Photograph of the Slippery Dip locality showing the lower massive unit,the palaeosol, and the upper laminated unit.uplifted and folded Neoproterozoic to Cambrian rocks(Lemon, 1996). However, overlying these older rocks inplaces is a thin cover of <strong>Quaternary</strong> sediments whichhave drawn the interest of various researchers (Singh,1981; Williams, 1973) because they contain evidence ofpast climate change and its role in landscape evolution.The succession of sediments that is the focus of thispaper (Section 1, Figure 2) is located within a topographiclow of the central Flinders Ranges near theeastern entrance to Brachina Gorge (Figure 1). Knownlocally as the ‘Slippery Dip’ site, it comprises a 8 m-highvertical outcrop of flat-lying Late Pleistocene sediments.At this location, these grey, very thinly bedded, slightlycalcareous sediments unconformably overlie theProterozoic Brachina Formation. Dalgarno and Johnson(1965) proposed a lacustrine origin for these youngersediments. This interpretation was followed bySymonds (1987), who made the first palaeolimnologicalinvestigation of the site focusing on its ostracod andmollusc faunas, but did so without a chronology for thesection.By the late 1990s the deposits were still regarded aslacustrine deposits, of interest because of theirpotential for integrating information about Pleistoceneenvironments (Cock et al., 1999).Cock et al. (1999) were the first to obtain radiocarbon( 14 C) ages (gastropod and charcoal) for the sedimentsand called them Late Pleistocene valley-fill. They datedthe Slippery Dip section and a second section ∼300 m tothe south and ∼500 m above the confluence of BrachinaCreek and Etina Creek. Williams et al. (2001) obtainedadditional 14 C ages from both sections and a suite of sixOSL ages from the SD site. The OSL ages wereconsistent with the 14 C dates.Table 1: Revised 14 C Ages for Section 1Williams et al. (2001) further investigated and surveyedthe Brachina valley fill sediments, concluding that thedeposits are those of a fluvial wetland system, not alake. The valley-fill therefore covers the time interval of21±3 ka defined by Bard (1999) as the age range of theLast Glacial Maximum (LGM), as well as the climaticevents leading up to the LGM and the events of theensuing deglacial. The palaeosol (P) marks a possiblybrief and still poorly dated depositional hiatus andsignifies a change in depositional regime at the SD site.AimThe aim of this paper is to test the hypothesis that themassive lower unit was laid down under relativelyhumid conditions and the upper finely bedded unitunder drier conditions punctuated by events such asoverbank floods that caused the repeated deposition ofthin beds.20 | <strong>Quaternary</strong> AUSTRALASIA <strong>24</strong> (2)
Table 1: Revised 14 C Ages for Section 1.The revised ages were calibrated using the package from Fairbanks et al. (2005).The locations of the dating samples on the section are shown in Figure 3.Materials and MethodsBulk sediment samples were collected from Section 1.Several attempts to recover spores and pollen fromthese sediments proved unsuccessful. Thus, the datareported herein pertain only to the Ostracoda andMollusca, and the carbon and oxygen isotopic compositionof their respective carbonate valves and shells.At 360 cm above the base of the exposed section(Figures 2 and 3), a dark grey-brown palaeosol separatesthe vertical section into two units, namely, a laminatedclayey silt upper unit and a lower more massive andhomogenous silty clay unit. For the purposes of thepresent study, ten roughly even spaced (7–18 cm)samples were taken from the lower unit and fivesamples from the upper unit.Subsamples of 40 g were soaked in 3% hydrogenperoxide solution for up to 3 days to remove the labileorganic matter. When effervescence ceased, the residueswere washed over a 90μm sieve. The retainedsediments were oven dried at 60°C and set aside formicroscopic examination. Using standard micropalaeontologicalprocedures, fossil ostracods (single valves),rare charophyte oogonia and gastropods were extracted,identified and counted.Stable isotope analysis of selected, weighed andcleaned ostracod and mollusc tests was carried out inthe School of Earth Sciences, Wollongong University,under the direction of Professor Allan Chivas. Theresults are reported relative to the V-PDB standard andhave a precision of better than ±0.02‰ for both δ 13 Cand δ 18 O. (Chivas et al. 2002).Figure 3. Section 1 of late Pleistocene sediments at theSlippery Dip locality (composite section after Williams etal., 2001). Dates shown are calibrated 14 C AMS ages.21 | <strong>Quaternary</strong> AUSTRALASIA <strong>24</strong> (2)
Late Pleistocene environments in the Flinders Ranges CONTINUEDTable 2. Changes in the diversity and frequency of ostracods andmollusca with depth in Section 1 at the Slippery Dip locality inBrachina Gorge, central Flinders Ranges. The numbers represent thecounted frequency of shells, mollusca and charophyte oogonia.22 | <strong>Quaternary</strong> AUSTRALASIA <strong>24</strong> (2)
ResultsMicrofossilsThe quantitative yields of ostracods and molluscs(fragments and intact shells) recovered from outcropsamples of the Slippery Dip section are presented inTable 2 and Figure 4 (overleaf). (Photomicrographs ofrepresentative fauna are shown in Plates 1 (ostracods)and 2 (molluscs), available online at: www.aqua.org.auThroughout the lower 202 cm of the section there isan abundance and diversity of microfossils, bothostracods and molluscs, although there does seem tobe a slight increase in diversity of mollusca between202 and 338 cm above its base (Austropyrgus sp. adultsbecome more numerous). This diversification coincideswith a marked drop-off in ostracod species diversity.Nine species of ostracods are identified here, includingone that is apparently new.The mollusca in the lower unit belong mainly to thegastropod family Hydrobiidae. In addition, there arerare specimens of the land snail family Charopidae.The zone of least diversity is just below the palaeosol.Above this level, there is a gradual increase in microfossilabundance. Fossils in the thinly bedded upperunit above the palaeosol are less well preserved andmore fragmented than those below.Ostracods(Plate 1: see www.aqua.org.au)Candonids (possibly Candonopsis sp. or Candonopsistenuis). Candonopsis tenuis: is only known as a freshwaterform (De Deckker, 1982a).Candonocypris novaezelandiae: a freshwater, benthicspecies common in farm dams and eutrophic waterbodies; often found grazing on decaying vegetabledebris and black organic-rich mud; adults have notbeen observed to swim, in contrast to juveniles, whichare good swimmers (De Deckker, 1981a, 1982c).Cypretta sp.: good swimmer in freshwater, includingslowly flowing river; uncommon in temporary pools (DeDeckker, 1982a).Darwinula sp.: found mostly in freshwater, but are alsofairly tolerant of a wide range of conditions; their eggscannot tolerate desiccation such that their presenceindicates a permanent water body (De Deckker, 1982a;Yilmaz and Külköylüo lu., 2006). The Darwinula of thislocality are similar to the type described by De Deckker(1982a) from Tasmania.Gomphocythere sp.: potentially a new ostracod genus orspecies (P. De Deckker, pers. com.). Park and Martens(2001) have described a similar extant form from LakeTanganyika. The new endemic species there has beennamed Gomphocythere woutersi and was collectedfrom a water depth of 18 m on a sandy substrate. It ischaracterised by the pitted tubercle ornamentation onits valves. As no species like it, either extant or extinct,has been described in Australia, its value as a paleoenvironmentalindicator is uncertain. It is interestingto note, however, that its occurrence along the sectionparallels that of Gomphocythere sp.Gomphodella maia: presence generally indicatespermanent water conditions, although it is possiblethat they burrow in sediment during times of desiccation;they require permanent water to reproduce.De Deckker (1980, 1981c, 1982a,b).Ilyodromus viridulus: considered a freshwater speciesand has never been found in brackish waters (DeDeckker, 1982c). Most Ilyodromus species in Australiaare freshwater forms that favour organic-rich sedimentsas substrates (De Deckker, 1982b).Lymnocythere mowbrayensis: a benthic species stillextant in South Australia (De Deckker, 1981b). It cannotswim and is usually found crawling among filamentousalgae in permanent fresh water, but can tolerate watersof up to 6% salinity in ephemeral locations (De Deckker,1981b, 1982b).Mesocypris sp.: taxonomy of this form is uncertain butthis genus is found in slow flowing fresh waters andswampy areas (De Deckker, 1982a).Mollusca(Plate 2: see www.aqua.org.au)The main molluscs identified in this section belongto two families of gastropods, the Hydrobiidae and theCharopidae.Austropyrgus sp. seems to be the most prominentspecies of Hydrobiidae, with both adult and juvenileforms present. Extant examples live mainly in streamsand springs, including those of the Flinders Ranges.It needs permanent water.A second new genus or species of gastropod also seemsto be present in the section. It looks like a living phreaticspecies from the Flinders Ranges, presently beingdescribed by Dr Winston Ponder at the AustralianMuseum, Sydney. What it indicates about the environmentis still unknown.A few unassigned examples of the Charopidae wereidentified. These are native land snails associated withdamp vegetation (W.F. Ponder, pers. comm.).23 | <strong>Quaternary</strong> AUSTRALASIA <strong>24</strong> (2)
Late Pleistocene environments in the Flinders Ranges CONTINUEDTable 3. Stable isotopic composition of ostracod valves andmollusc shells in Section 1 at the Slippery Dip locality inBrachina Gorge, central Flinders Ranges.<strong>24</strong> | <strong>Quaternary</strong> AUSTRALASIA <strong>24</strong> (2)
Figure 4. Ostracod, mollusc and stable isotope profiles of Section 1at the Slippery Dip locality, Brachina Gorge, central Flinders Ranges.Dotted line marks position of palaeosol.Carbon and oxygen isotopic signaturesThe results of the stable isotopic analysis of ostracodvalves and mollusc shells recovered from Section 1 atthe Slippery Dip locality are presented in Table 3and plotted in Figures 4 and 5.The two microfossil populations have broadly similarcarbon and oxygen isotopic signatures (Figure 5), whichin turn are typical of freshwater limestones (Hudson,1977). In samples from which multiple specimens ofostracods and/or molluscs were analysed, each phylumfor the most part is both isotopically uniform andindistinguishable from the other. This phenomenon ofisotopic congruence is best illustrated by the elevensub-samples from 207–197 cm height in the section(Table 3). The mean values for their two populations areas follows: ostracod δ 13 C = –8.5 ± 1.2‰, δ 18 O = –2.6 ±0.6‰ (n = 5); and mollusc δ 13 C = –8.1 ± 0.6‰, δ 18 O =–2.8 ± 0.8‰ (n = 6). There is one notable instance wherethis isotopic uniformity does not prevail. The ostracodsub-sample from 417–409 cm comprises solely juvenileCandonocypris novaezelandiae, which are markedlyheavier (δ 13 C = –4.8‰, δ 18 O = –1.6‰) than the shellfragments in the mollusc sub-samples (n = 3) from thesame interval (δ 13 C = –8.4 ± 1.1‰, δ 18 O = –3.3 ± 0.8‰).Accordingly, data on the aforementioned ostracodsample were omitted when calculating the averageisotopic values of this sample interval.25 | <strong>Quaternary</strong> AUSTRALASIA <strong>24</strong> (2)(a)(b)Figure 5. Plot of δ 18 O against δ 13 C for calcareous microfossils(a: ostracods; b: molluscs) from Section 1 at the SlipperyDip locality, Brachina Gorge, central Flinders Ranges. Field foraverage freshwater limestones is taken from Hudson (1975).
Late Pleistocene environments in the Flinders Ranges CONTINUEDThe carbon and oxygen isotopic profiles of Section 1(Figures 4 and 5) are based on the average values of eachsample interval. These profiles show that overall δ 13 Cdecreases upwards through the section from –7.5‰ atthe base to –9‰ at the top, although there is aprominent but short-lived (∼1 ka) positive excursionwithin the upper half of the lower unit. In contrast, δ 18 Ooscillates between –4 and –2‰ through the lower unitbefore climbing from –3 to –2‰ through the upper unit.The apparent regular oscillation of the oxygen isotopedata may well be an artefact of the sample interval andshould be treated with caution until more highresolution sampling can be done. The profiles highlighta weak inverse relationship between the two parameters.The difference in overall slope of the profiles,and their contrasting fine structure, suggest subtlechanges in the freshwater setting in which thesesediments accumulated. Secular changes in the ratio ofprecipitation to evaporation (P/E) will be reflected inδ 18 O, whereas the δ 13 C values are more likely to havebeen influenced by variations in productivity, as demonstratedby, for example, the record of Late <strong>Quaternary</strong>environmental change in Lake Pamvotis, Greece(Frogley et al., 2001). The significance of the trends andpatterns evident in Figure 4, particularly when coupledwith the microfaunal data, are discussed below.Palaeoenvironmental ImplicationsThe lower unit, from about 60 cm to 230 cm above thebase, contains diverse and abundant microfauna. Theostracods include free swimmers such as Cypretta sp.and benthic species that normally do not swim butcrawl on the substrate or on vegetation growing beneaththe water (Candonocypris novaezelandiae, Gomphodellamaia, Lymnocythere mowbrayensis). All these taxa live infreshwater environments, although some can tolerateslight levels of salinity (L. mowbrayensis). Some of themrequire permanent water for breeding (Darwinula sp., L.mowbrayensis). Gomphadella maia is thought to inhabitpermanent pools but De Deckker (1982b) suggests thatit may burrow into sediment when the ponds dry out.Also present in the deposits are freshwater phreaticgastropods from the Family Hydrobiidae that are foundin streams and springs, as well as land gastropods, fromthe Family Charopidae, which frequent dampvegetation. This indicates a stable, humid regime with adiversity of wetland habitats including streams, pondsand swamps. The stable isotope data (Figures 4 and 5)suggest a somewhat different setting at Brachina Gorgeprior to the LGM. Rather than the climate beinguniformly humid, the oxygen isotope profile indicates aregular oscillation between wetter and drier conditions.The amplitude of this apparent fluctuation in P/Eratio is relatively constant throughout the interval inquestion, although its periodicity shortens up thesection (see calibrated ages in Figure 3). The carbonisotope profile shows that this change of climate wasaccompanied by a steady decline in productivity of thewetland. This preliminary interpretation awaitsconfirmation by higher resolution sampling andanalysis.The upper part of the lower unit, from about 230 cmto 360 cm above the base, shows a general decline inmicrofossil diversity and abundance. Darwinula sp., afairly cosmopolitan species but requiring permanentwater, disappears while small numbers of Lymnocytheremowbrayensis persist along with Candonocypris novaezelandiae.Both these species are benthic and indicatethat the wetland was possibly contracting into smallephemeral pools that partially dry out and are fed byseepages from ground water. The free-swimmingconditions favoured by Cypretta sp. seems to no longerhave been available. A drying trend is certainly evidentin the oxygen isotope profile between 230 cm and 275cm, although a return to wetter conditions is indicatedthrough the remainder of the upper unit (Figure 4).These changes overlap the short-lived positive excursionin δ 13 C that, in lacustrine settings, would normally beattributed to enhanced primary productivity of aquaticalgae.In this same interval there is an increase in the numbersof Austropyrgus that is not as well represented inthe lower part of the section, while other Hydrobiidgastropods (including juveniles), which are not yetspecifically identified, are more abundant. More willneed to be found out about this gastropod group tounderstand the meaning of this difference. The regionaltaxonomy and ecology of this group is currently beingstudied (Clark et al., 2003).A sharp change in the physical character of the depositsoccurs at the palaeosol horizon (Williams et al., 2001)(Figures 2 and 3). The microfossil population changesacross this boundary in three ways. First, the totalnumber of ostracod and mollusc fragments increasesdramatically (Figure 4). Second, the diversity of theostracods drops to about three varieties (juvenileCandanopsid varieties, which are difficult to identify,and Darwinula sp.). Interestingly, the juvenile forms ofC. novaezelandiae, unlike the adult forms, are goodswimmers. This is an indication that more permanentwater was available again. Lymnocythere numbers dropat this stage and those of Darwinula sp. increase.Between 450 cm and 520 cm above base of the sectionthere is a drop in Darwinula sp. numbers and anincrease in the numbers of both Gomphadella maia andLymnocythere mowbrayensis (Figure 4). Both these latterspecies have been reported in slightly saline conditions,as discussed above, and this may indicate that therewas an increase in salinity in the waters at this time.Third, the large increase in total ostracod remains ismade up of non-identifiable fragments, suggesting that26 | <strong>Quaternary</strong> AUSTRALASIA <strong>24</strong> (2)
high-energy events such as floods prevailed duringwhich fragile shells were broken up.Following this increase in ostracod abundance, thereis a gradual decline to almost zero at 520 cm above thebase of the section (Figure 4), indicating a period ofapparent desiccation. Both the ostracod and molluscfaunas then recover towards the top of the section.Although constrained by data from just three stratigraphiclevels, the microfossil profile of the upper unitsuggests a slight increase in the wetland’s salinityfollowing the LGM, and a continuation of the slowdecline in its organic productivity. Interpretation of theresults (both isotopic and micropalaeontological) is inpart limited by the use of bulk samples. There are about30 discrete laminae between the palaeosol horizon at360–370 cm, and the top of the section at ∼580 cmabove the base of the exposed section. Only six sampleswere taken over this interval, which is hardly adequateto document the apparently increasing frequency ofturnover between wetter and drier periods. Againhigher-resolution sampling of the section is requiredto confirm this turnover.ConclusionsThis study has shown that there were two main phasesof late Pleistocene wetland sedimentation at theSlippery Dip locality in the Brachina valley of the centralFlinders Ranges. The first, from about 34,000 yr BP tothe LGM, occurred during a time of generally highprecipitation such that freshwater microfossils, includingboth free-swimming and benthic ostracods,were preserved in relatively large numbers. The carbonand oxygen isotopic signatures of the ostracods andcoeval molluscs provide an additional perspective,indicating that the prevailing moist conditions werepunctuated by drier periods. The palaeosol, about 370cm above the base of the section, marks the end of theinitial stage of deposition. This horizon is relatively freeof microfossils and coincides with a drying phase.Following the hiatus, around the time of the LGM,the second phase of sedimentation probably records aprolonged series of high-energy events (possibly floods),given the fragmented nature of the shells. A decline inmicrofossil diversity suggests a slight increase insalinity. The limited isotopic data on this interval areconsistent with the overall drying out and decline inproductivity of the wetland.This preliminary investigation highlights the need forhigher-resolution sampling of the sediments above thepalaeosol, with a view to better documenting changes intheir microfossil diversity and stable isotopic composition.Additional ages will also be necessary to establishthe nature and frequency of the events leading to theprominent lamination of this part of the Slippery Dipsection. Such information will comprise a local signatureof global events that occurred between the LGMand the dawn of the Holocene.AcknowledgementsWe thank the National Parks and Wildlife Service of SouthAustralia for their support in carrying out this research. Wethank Patrick De Deckker for his generous help in ostracodidentifi-cation, hospitality and helpful advice. Dr WinstonPonder is thanked for his help in mollusc identification.Rosemarie Glasby did invaluable hours of work on themicroscope.References• Bard, E., 1999. Ice age temperatures and geochemistry. Science,284, 1133–1134.• Chivas, A. R., De Deckker, P., Wang, S. X., Cali, J. A., 2002.Oxygen-isotope Systematics of the Nektic OstracodAustralocypris robusta. In Holmes, J. A., Chivas, A. R. (Eds.), TheOstracoda: Applications in <strong>Quaternary</strong> Research; GeophysicalMonograph published by the American Geophysical Union,Washington, DC., 301–313.• Cock, B.J., Williams, M.A.J. and Adamson, D.A.,1999.Pleistocene Lake Brachina: a preliminary stratigraphy andchronology of lacustrine sediments from the central FlindersRanges, South Australia. Australian Journal of Earth Sciences,46, 61–69.• Clark, S.A, Miller A.C. and Ponder W.F., 2003. Revision of thesnail genus Austropyrgus (Gastropoda: Hydrobiidae). Amorphostatic radiation of freshwater gastropods insoutheastern Australia. Records of the Australian MuseumSupplement, 28, 1–109.• Dalgarno, C.R., Johnson, J.E., 1965. Oraparrina 1:63,000 mapsheet. Department of Mines, South Australia.• De Deckker, P., Geddes, M.C., 1980. Seasonal fauna ofephemeral saline lakes near Coorong Lagoon, South Australia.Transactions of the Royal Society of South Australia, 103,155–168.• De Deckker, P., 1981a. Taxonomic notes on some Australianostracods with description of new species. Zoologica Scripta,10, 37–55.• De Deckker, P., 1981b. Ostracods from Australian inland waters– notes on ecology and taxonomy. Proceedings of the RoyalSociety of Victoria, 93, 43–85.• De Deckker, P., 1981c. Taxonomy and ecological notes for someostracods from Australian inland waters. Transactions of theRoyal Society of South Australia, 105, 91–138.• De Deckker, P., 1982a. Holocene Ostracods, OtherInvertebrates and Fish Remains from Cores of Four Maar LakesIn Southeastern Australia. Proceedings of the Royal Society ofVictoria, 94, 183–220.• De Deckker, P., 1982b. <strong>No</strong>n-marine ostracods from two<strong>Quaternary</strong> profiles at Pulbeena and Mowbray Swamps,Tasmania. Alcheringa, 6, <strong>24</strong>9–274.• De Deckker, P., 1982c. Late <strong>Quaternary</strong> ostracods from LakeGeorge, New South Wales. Alcheringa, 6, 305–318.• De Deckker, P., 1983. <strong>No</strong>tes on the ecology and distribution ofnon-marine ostracods in Australia. Hydrobiologia, 106,223–234.• Fairbanks, R.G., Mortlock, R. A., Chiu T.-C., Cao, L., Kaplan, A.Guilderson, T.P., Fairbanks, T.W., Bloom, A.L., Grootes, P.M.,Nadeau, M.-J., 2005. Marine Radiocarbon Calibration CurveSpanning 0 to 50,000 Years B.P. Based on Paired 230Th/234U/238U and 14C Dates on Pristine Corals. <strong>Quaternary</strong>Science Reviews, <strong>24</strong>, 1781–1796.27 | <strong>Quaternary</strong> AUSTRALASIA <strong>24</strong> (2)
Late Pleistocene environments in the Flinders Ranges CONTINUED• Frogley, M.R., Griffiths, H. I., Heaton, T.H.E., 2001. Historicalbiogeography and Late <strong>Quaternary</strong> environmental change of LakePamvotis, Ioannina (north-western Greece): evidence fromostracods. Journal of Biogeography, 28, 745–756.• Holmes, J.A., 2001 Ostracoda. In: Smol, J.P., Birks, H.J.B., Last,W.M. (Eds.), Tracking Environmental Change Using Lake Sediments<strong>Vol</strong>.4: Zoological Indicators. Kluwer Academic Publishers,Dordrecht, 125–152.• Hudson, J.D., 1977. Stable isotopes and limestone lithification.Journal of the Geological Society London, 133, 637–660.• Ito, E., 2001. Application of stable isotope techniques to inorganicand biogenic carbonates. In: Last, W.M. and Smol, J.P. (Eds.),Tracking Environmental Change Using Lake Sediments <strong>Vol</strong>.2:Physical and Geochemical Methods. Kluwer Academic Publishers,Dordrecht, 351–372.• Lemon, N.M., 1996. Geology. In: Davies, M., Twidale, C.R., Tyler,M.J. (Eds.), Natural History of the Flinders Ranges. Royal Society ofSouth Australia, Adelaide, pp.14–29.• Miller, B.B., Tevesz, M.J.S., 2001. Freshwater molluscs. In: Smol,J.P., Birks, H.J.B. and Last, W.M. (Eds.), Tracking EnvironmentalChange Using Lake Sediments <strong>Vol</strong>.4: Zoological Indicators. KluwerAcademic Publishers, Dordrecht, 153–172.• Symonds, R., 1987. Palaeolimnological Investigations into a<strong>Quaternary</strong> Lacustrine Profile: The Slippery Dip, Flinders Ranges.Unpublished final year project for Bachelor of Education, Universityof South Australia.• Singh, G., 1981. Late <strong>Quaternary</strong> pollen records and seasonalpalaeoclimates of Lake Frome, South Australia. Hydrobiologia, 82,419–430.• Twidale, C.R., 1996. Geomorphology of the Flinders Ranges. In:Davies, M., Twidale, C.R. and Tyler, M.J. (Eds.), Natural History ofthe Flinders Ranges, Royal Society of South Australia OccasionalPublication, 46–62.• Park, L.E., Martens, K., 2001. Four new species of Gomphocythere(Crustacea, Ostracoda) from Lake Tanganyika, East Africa.Hydrobiologia, 450, 129–147.• Williams, G.E., 1973. Late <strong>Quaternary</strong> piedmont sedimentation,soil formation and palaeoclimates in arid South Australia.Zeitschrift für Geomorphologie N.F. 17(1), 102–125.• Williams, M.A.J., Prescott, J.R., Chappell, J., Adamson, D., Cock,B., Walker, K., Gell, P.A., 2001. The enigma of a late Pleistocenewetland in the Flinders Ranges, South Australia. <strong>Quaternary</strong>International, 83–85, 129–144.• Williams, M.A.J., Nitschke, N., Chow, C., 2006. Complexgeomorphic response to late Pleistocene climatic changes in thearid Flinders Ranges of South Australia. Geomorphologie: relief,processus, environnement, 4, p.<strong>24</strong>9–258.• Yilmaz, F., Külköylüo lu, O., 2006. Tolerance, optimum ranges,and ecological requirements of freshwater Ostracoda (Crustacea)in Lake Alada (Bolu, Turkey). Ecological Research, 21,165–173.28 | <strong>Quaternary</strong> AUSTRALASIA <strong>24</strong> (2)
Research ArticleCarbon isotope discrimination by C 3 pasturegrasses along a rainfall gradient in South Australia:Implications for palaeoecological studiesF. Donald Pate, Evelyn KrullF. Donald Pate (corresponding author) Email: donald.pate@flinders.edu.auDepartment of Archaeology, Flinders University, Adelaide, SA 5001, AustraliaEvelyn Krull, CSIRO Land and Water, Private Bag <strong>No</strong>. 2, Glen Osmond, SA 5064, AustraliaAbstractSamples of C 3 pasture grasses (Barley grass, Hordeumleporinum) were collected at five field sites in southeasternSouth Australia with varying mean annualrainfall in order to address variability in grass tissuestable carbon isotope composition in open, arid-landhabitats. Mean annual rainfall at the collection sitesranges from 1045 mm at Bridgewater in the southernAdelaide Hills to 238 mm at Morgan in the arid north.Stable carbon isotope values of C 3 grasses become lessnegative with decreasing mean annual rainfall. Meanδ 13 C values vary from -31.5‰ at Bridgewater to -27.7‰at Morgan, a 3.8‰ difference correlated with a changeof mean annual rainfall of 807 mm. The greatestmagnitude of grass tissue δ 13 C change (2.5‰) occursbetween the semi-arid (345 mm rainfall) and arid (238mm rainfall) zones. Although the least negative C 3 grassδ 13 C values occur in the arid zone, effects on the stablecarbon isotope composition of bone collagen in grazerswill be minimal because C 4 grasses dominate the aridlandscape. In a majority of the temperate and semi-aridhabitats occupied by grazers, mean δ 13 C values in C 3grasses differ by only 0.3 to 1.0‰. The quantification ofvariability in δ 13 C values within C 3 and C 4 plants associatedwith environmental variables such as soil moisturestress, aridity, and high light levels is essential toa range of ecological and palaeoecological studiesemploying stable isotope analyses of tissues fromplants, herbivores and human consumers.IntroductionStable isotopic analyses are employed regularly inecological studies to address environmental and dietaryvariability in a range of modern and past ecosystems.Isotopic analyses of soils and tissues from humans,animals, and plants have been employed to addressdietary composition, trophic level, photosyntheticpathway, habitat use, water stress, nutritional stress,humidity, and climate in marine and terrestrial ecosystems(Peterson and Fry, 1987; Rundel et al., 1989;MacFadden and Bryant, 1994; Pate, 1994, 1997;Bocherens et al., 1999; Witt, 2002).Past research addressing dietary variability in terrestrialmammals via stable carbon isotope analysis focusedon isotopic signatures in plant foods associated withvarious habitats and environmental conditions. Theseisotopic differences in plants are passed on to thetissues of herbivore consumers (Schwarcz and Schoeninger,1991; Pate, 1994). Due to slow biochemicalturnover rates, bone stable isotope values are relatedto long-term patterns of food consumption and habitatuse. In most vertebrates, stable carbon isotopes provideinformation about lifetime dietary averages (Libby etal., 1964; Stenhouse and Baxter, 1979).Initial studies focused on the bimodal distribution ofδ 13 C values in plants as determined by various photosyntheticmechanisms (Park and Epstein, 1961; Smithand Epstein, 1971; Downton, 1975; Raghavendra andDas, 1978; O’Leary, 1988). Stable carbon isotope analysisof animal bones permitted the identification ofbrowsing and grazing fauna in many regions of theworld in both modern and fossil systems (Ambrose &DeNiro 1986, van der Merwe 1986, 1989, Cormie andSchwarcz, 1994; Quade and Cerling, 1995; Grocke, 1997;Cerling et al., 1999; Pate and Schoeninger, in review).Because the carbon isotopic composition of soils andplants shows spatial variations within regional foodwebs, herbivore bone has the potential to provide anaverage isotopic signal for particular environments(Tieszen et al., 1979; Teeri et al., 1980; Cavagnaro, 1988;Korner et al., 1988; van der Merwe et al., 1988; Cormieand Schwarcz, 1994). Hattersley (1983) reports the geographicdistribution of C 3 and C 4 grasses in Australiain relation to climatic zones. The southern temperateregions of South Australia are dominated by C 3 grasses;C 4 grasses become dominant in the arid northern areas.Thus, there is a distinct geographic distribution of C 3and C4 grasses in Australia that may be employed toaddress variations in climate and associated herbivoredietary variability.29 | <strong>Quaternary</strong> AUSTRALASIA <strong>24</strong> (2)
Carbon isotype discrimination CONTINUEDBone collagen stable carbon isotope values in marsupialand eutherian herbivores collected at five field sitesalong a 1275 km south-north transect from temperatecoastal to arid interior South Australia become lessnegative toward the arid north in relation to increasingquantities of C 4 grasses (Pate and <strong>No</strong>ble, 2000). There isa strong linear relationship between percentage of C 4grasses at the collection sites and kangaroo bone collagenδ 13 C values (r 2 = 0.98). Mean annual rainfall alongthe transect ranges from 775 mm at coastal MountGambier (23% C 4 grasses) to 168 mm at Cordillo Downs(78% C 4 grasses) in the northeast corner of the state.Because stable carbon isotope ratios in herbivore bonecollagen reflect the δ 13 C composition of ingestedgrasses, stable isotope analysis provides a method toaddress dietary selection and dietary variability inAustralian herbivores and carnivores.More recent studies have focused on observations thatplants employing C 3 photosynthesis show a large rangeof mean δ 13 C C tissue values (grand mean = -27.12.0‰; range of -35‰ to -20‰; see Deines, 1980;O’Leary, 1988). Plants growing in tropical closed-canopyforests have δ 13 C values at the more negative end of therange, while plants of the same species growing inopen, arid-land habitats have less negative δ 13 C values.The more negative values result from δ 13 C enrichmentof local atmospheric CO2 from biomass degradation(van der Merwe and Medina, 1989; Broadmeadow et al.,1992) and depressed rates of photosynthesis under lowlight conditions (Yakir and Israeli, 1995).Plants growing in savannas and other open arid-landecosystems show less negative δ 13 C tissue valuesbecause photosynthesis occurs during periods ofstomatal closure and photosynthesis is stimulated byhigh light levels (Hubick et al., 1986; Ehleringer andCooper, 1988; Ehleringer, 1989; Farquhar et al., 1987,1989; Pate and Arthur, 1998). This photosyntheticmechanism preserves moisture in plants growingin arid-land ecosystems and in the process reducesdiscrimination against the heavier δ 13 C isotope. Inaddition, in open habitats local atmospheric CO2 isisotopically similar to the global atmosphere due to thelack of canopy effect (cf. Ambrose and DeNiro, 1986;van der Merwe and Medina 1989; Schoeninger et al.,1997). Ehleringer and Cooper (1988) report a 1 – 2.5‰intraspecific increase in the leaf δ 13 C values of desertperennials along a decreasing soil moisture cline fromwash to slope microhabitats.Similar variations in leaf and wood δ 13 C values havebeen reported for pines and eucalypts growing alongrainfall gradients in open-forest environments (Pateand Arthur, 1998). During the growing season, woodδ 13 C C values from pines (Pinus radiata) in Australiaand New Zealand increase by 2–3‰ in direct associationwith increases in mean annual rainfall fromFigure 1. Map showing location of the South Australian collectionsites for grasses and kangaroo bones: (1) Mount Gambier, (2) Karteand Pinnaroo, (3) Morgan, (4) Plumbago, (5) Innamincka, (6)Coonalpyn, and (7) Bridgewater and Mount Barker with associatedgeographic subdivisions indicating abundance of C3 and C4 grassesin relation to climate (after Hattersley 1983). Geographic subdivisions:SE = South-eastern, MY = Murray, NL = <strong>No</strong>rthern Lofty,EN = Eastern, LE = Lake Eyre (adapted from Pate and <strong>No</strong>ble, 2000).650 mm to 1500 mm (Walcroft et al., 1997; Korol et al.,1999). Leaf δ 13 C values in 12 populations of shallowrootedEucalyptus are also positively correlated withmean annual rainfall (r = 0.75) and negatively correlatedwith predicted evaporation during the summer monthsin southeastern Australia (Anderson et al. 1996). Woodδ 13 C are more variable than leaf values because woodrecords an average of tissues synthesized over a longerperiod of time (Miller et al., 2001).This paper addresses δ 13 C variability in C 3 pasturegrasses at five field sites along a rainfall gradient fromtemperate coastal to arid interior South Australia inorder to assess the impact of soil moisture stress,aridity, and high light levels on plant stable carbon30 | <strong>Quaternary</strong> AUSTRALASIA <strong>24</strong> (2)
isotope tissue values. Differences in C 3 grass δ 13 C tissuevalues will be passed on to herbivores. Thus, in additionto differences in the distribution and abundance of C 3versus C 4 grasses across various habitats, stable carbonisotope variability within C 3 grasses introduces anadditional mechanism that will affect herbivore bonecollagen δ 13 C composition.Materials and MethodsSamples of C 3 pasture grasses (Barley grass, Hordeumleporinum) were collected at five field sites in southeasternSouth Australia with mean annual rainfallvalues ranging from 1045 mm to 238 mm. The collectionsites included Bridgewater, Mount Barker, Coonalpyn,Pinnaroo, and Morgan (Figure 1). Bridgewaterand Mount Barker are located within the Adelaide Hillsregion to the southeast of the city of Adelaide. Fivesamples of grass were collected at each site from a 25m 2 area of flat pasture ground in areas that were notirrigated. Grass blades were cut near the top of the plantto avoid contamination from the underlying soil.Samples were submitted to the CSIRO Land and Waterlaboratory, Adelaide for stable carbon isotope analysis.Samples were oven dried at 50°C, ground, and analysedby mass spectrometer using an automated EuropaScientific ANCA-SL system with on-line separation.Analytical precision was better than ± 0.1‰.ResultsStable carbon isotope values of C 3 grasses become lessnegative with decreasing mean annual rainfall. Meanδ 13 C values vary from -31.5‰ at Bridgewater (1045 mmrainfall) to -27.7‰ at Morgan (238 mm rainfall), a 3.8‰difference correlated with a change of mean annualrainfall of 807 mm (Table 1). The greatest magnitude ofgrass tissue δ 13 C change (2.5‰) occurs between thesemi-arid (Pinnaroo, 345 mm rainfall) and arid(Morgan, 238 mm rainfall) zones, whereas there is nosignificant difference (0.3‰) between mean values atthe Pinnaroo and Coonalpyn (453 mm rainfall)collection sites.Differences in δ 13 C values for grasses between temperatecoastal and arid interior habitats are reflected inthe bone collagen δ 13 C values of herbivore consumers(Table 2; Figure 1). For example, the difference in meanδ 13 C values for grasses at Mount Barker (767 mm rainfall)versus Morgan (238 mm rainfall) is 3.2‰, while thedifference between grey kangaroo (Macropus fuliginosus)bone collagen values at Mount Gambier (775mm rainfall) versus Morgan is 3.4‰ (Pate and <strong>No</strong>ble,2000; Pate and Schoeninger, in review). Mean δ 13 Cvalues in C 3 grasses from a majority of the temperateand semi-arid regions in South Australia that areoccupied by kangaroos differ by only 0.3 to 1.0‰.Table 1.Collection Site Location Mean Annual Mean Grass Range nRainfall (mm) 13 C (‰) ± SDBridgewater 35 00’ S, 138 45’ E 1045 -31.5 ± 1.1 -33.4, -30.5 5Mount Barker 35 04’ S, 138 52’ E 767 -30.9 ± 1.0 -32.2, -29.6 5Coonalpyn 35 42’ S, 139 50’ E 453 -29.9 ± 1.2 -31.5, -28.7 5Pinnaroo 35 16’ S, 140 54’ E 345 -30.2 ± 0.7 -31.3, -29.4 5Morgan 34 01’ S, 139 39’ E 238 -27.7 ± 0.7 -28.4, -26.6 5Stable carbon isotope variability inC3 grasses (Barley grass, Hordeumleporinum) at five South Australiancollection sites along a rainfallgradient from temperate coastal toarid interior.Table 2.Collection Site Location Mean Annual Percentage a Kangaroo b nRainfall (mm) C 4 Grasses 13 C (‰)Mount Gambier 37 56’ S, 140 47’ E 775 23 -<strong>24</strong>.8 6Karte 35 04’ S, 140 42’ E 350 47 -21.6 7Morgan 34 01’ S, 139 39’ E 238 47 -21.4 6Plumbago 32 04’ S, 139 53’ E 200 69 -17.6 13Innamincka 27 56’ S, 140 47’ E 176 78 -15.4 12Mean bone collagen stable carbonisotope results for South Australiankangaroos collected along a southnorthtransect from temperate coastto arid interior (after Pate and <strong>No</strong>ble,2000; Pate, unpublished data forMorgan site).a: After Hattersley (1983)b: Grey kangaroos (Macropus fuliginosus) for Mount Gambier, Karte, and Morgan;Red kangaroos (Macropus rufus) for Innamincka; Red and grey kangaroos for Plumbago31 | <strong>Quaternary</strong> AUSTRALASIA <strong>24</strong> (2)
Carbon isotype discrimination CONTINUEDDiscussionMost of the observed variation in kangaroo bonecollagen δ 13 C values in the temperate coastal and semiaridinterior regions of South Australia appears to berelated to the consumption of varying quantities of C 3and C 4 grasses. For example, mean grey kangaroo δ 13 Cvalues at Mount Gambier (775 mm rainfall, 77% C 3grasses) versus Karte (350 mm rainfall, 53% C 3 grasses)differ by 3.2‰, but mean C 3 grass δ 13 C values at siteswith similar rainfall values, e.g. Mount Barker (767 mmrainfall) versus Pinnaroo (345 mm rainfall), differ byonly 0.7‰.In contrast, in arid-land habitats with mean annualrainfall values less than 250 mm, kangaroo bonecollagen δ 13 C values would be influenced by bothvarying quantities of C 3 and C 4 grasses included in dietsand the consumption of C 3 grasses with less negativeδ 13 C values grown under conditions of aridity. Meankangaroo bone collagen δ 13 C values at arid, inlandInnamincka (176 mm rainfall) are 9.4‰ less negativethan those at coastal, temperate Mount Gambier (Pateand <strong>No</strong>ble, 2000). However, as the most arid habitatsare also dominated by C 4 grasses which have lessnegative δ 13 C values, e.g. Innamincka with 78% C 4 , theimpact of δ 13 C tissue variability within C 3 grasses on thebone collagen δ 13 C values of grazers inhabiting aridzones will be minimised.The important implication arising from the datapresented in this study is that overall the effect of C 3grass δ 13 C tissue variability on estimates of relativedistributions of C 3 and C 4 grasses from stable carbonisotope analyses of bone collagen in South Australiangrazers is minimal. Correction factors for variousregions can be applied to address the small variationsin herbivore bone collagen δ 13 C values that are relatedto consumption of C 3 grasses with less negative δ 13 Ctissue values.An improved understanding of the effects of variousenvironmental variables on δ 13 C values in C 3 and C 4plants will assist in the refinement of isotopic methodsemployed to study modern and past ecological systems.AcknowledgementsThis project is a component of the interdisciplinary NaracoorteCaves World Heritage Site Program directed by Rod Wells, Schoolof Biological Sciences, Flinders University. Funding was providedby the Australian Research Council, the South Australian Departmentof Environment and Natural Resources, and the FlindersUniversity Research Budget. Mass spectrometry analysis wasprovided by CSIRO Land and Water, Adelaide. The authors thankan anonymous referee for comments regarding the revision ofthe manuscript.References• Ambrose, S.H. and DeNiro, M.J., 1986. The isotopic ecology ofEast African mammals. Oecologia, 69:395–406.• Anderson, J.E., Williams, J., Kriedmann, P.E., Austin, M.P. andFarquhar, G.D., 1996. Correlations between carbon isotopediscrimination and climate of native habitats for diverseeucalypt taxa growing in a common garden. Australian Journalof Plant Physiology, 23:311–320.• Bocherens, H., van Klinken, G.J. and Pollard, A.M., eds, 1999.Proceedings of the 5th Advanced Seminar on Palaeodiet.Journal of Archaeological Science 26:593–728.• Broadmeadow, M.S.J., Griffiths, H., Maxwell, C. and Borland,A.M., 1992. The carbon isotope ratio of plant organic materialreflects temporal and spatial variations in CO 2 within tropicalforest formations in Trinidad. Oecologia, 89:435–441.• Cavagnaro, J.B., 1988. Distribution of C3 and C4 grasses atdifferent altitudes in a temperate arid region of Argentina.Oecologia, 76:273–277.• Cerling, T.E., Harris, J.M. and Leakey, M.G., 1999. Browsing andgrazing in elephants: the isotope record of modern and fossilproboscideans. Oecologia, 120:364–374.• Cormie, A.B. and Schwarcz, H.P., 1994. Stable isotopes ofnitrogen and carbon of <strong>No</strong>rth American white-tailed deer andimplications for palaeodietary and other food web studies.Palaeogeography, Palaeoclimatology, Palaeoecology,107:227–<strong>24</strong>1.• Deines, P., 1980. The isotopic composition of reduced organiccarbon. In Fritz, P. and Fontes, JCh., eds. Handbook ofEnvironmental Isotope Geochemistry, <strong>Vol</strong>ume 1. Elsevier,Amsterdam, 329–406.• Downton, W.J.S., 1975. The occurrence of C4 photosynthesisamong plants. Photosynthsis, 9:96–105.• Ehleringer, J.R., 1989. Carbon isotope ratios and physiologicalprocesses in arid-land plants. In Rundel, P.W., Ehleringer, J.R.and Nagy, K.A., eds. Stable Isotopes in Ecological Research.Springer-Verlag, New York, 41–54.• Ehleringer, J.R. and Cooper, T.A., 1988. Correlations betweencarbon isotope ratio and microhabitat in desert plants.Oecologia, 76:562–566.• Farquhar, G.D., Masle, J., Hubick, K., von Caemmerer, S. andTerashima, I., 1987. Effects of drought, salinity, and soilstrength on photosynthesis, transpiration, and carbon isotopecomposition of plants. Current Topics in Plant Biochemistry andPhysiology, 6:147–155.• Farquhar, G.D., Ehleringer, J.R. and Hubick, K.T., 1989. Carbonisotope discrimination and photosynthesis. Annual Review ofPlant Physiology and Plant Molecular Biology, 40:503–537.• Grocke, D.R., 1997. Distribution of C3 and C4 plants in the LatePleistocene of South Australia recorded by isotopebiogeochemistry of collagen in megafauna. Australian Journalof Botany, 45:607–617.• Hattersley, P.W., 1983. The distribution of C3 and C4 grasses inAustralia in relation to climate. Oecologia, 57:113–128.• Hubick, K.T., Farquhar, G.D. and Shorter, R. 1986. Correlationbetween water-use efficiency and carbon isotopediscrimination in diverse peanut (Arachis) germplasm.Australian Journal of Plant Physiology, 13:803–816.• Korner, Ch, Farquhar, G.D. and Roksandic, Z., 1988. A globalsurvey of carbon isotope discrimination in plants from highaltitude. Oecologia, 74:623–632.• Korol, R.L., Kirschbaum, M.U.F., Farquhar, G.D. and Jeffreys,M., 1999. Effects of water status and soil fertility on the C-isotope signatures in Pinus radiata. Tree Physiology,19:551–562.32 | <strong>Quaternary</strong> AUSTRALASIA <strong>24</strong> (2)
Meeting ReportReport on the Symposium ‘Land-Oceancorrelation of long <strong>Quaternary</strong> records fromthe Southern Hemisphere on orbital andsub-orbital timescales (PASH2)’5th Southern Connection Conference, 21–25 January <strong>2007</strong>Adelaide University, South AustraliaPeter KershawCentre for Palynology and PalaeoecologySchool of Geography and Environmental ScienceMonash University Fax: 03 9905 2948peter.kershaw@arts.monash.edu.auThe PASH2 project developed from a previous SouthernHemisphere initiative of the International <strong>Quaternary</strong><strong>Association</strong> (INQUA) Commission for Palaeoclimatology(PALCOMM) (Palaeoclimates of the Southern Hemisphere –PASH), and has been designed to provide a coherentpicture of Southern Hemisphere climate change and itsdrivers. The aim is to provide a more balanced picture ofglobal climates while contributing substantially to theunderstanding of the development of present landscapes.The project was initiated to address the unique, thoughunder researched, climatic history of the southerncontinents and oceans. As a result of their associationwith ENSO and monsoon generation, and their role in theglobal thermohaline circulation, the southern oceans arecritical to an understanding of global climate change.Additional information on the PASH2 project is providedat http://users.monash.edu.au/∼pkershaw/The Southern Connections symposium, incorporating 17presentations on Australia, New Zealand, Southern Africaand South America, was presented in association with anINQUA Palaeoclimate Commission project workshopsupported by both INQUA and the ARC EnvironmentalFutures Network. It was introduced by ‘keynote’presentations from Jim Bowler and Tim Barrows. Thesecovered, at different resolutions, climate proxy recordsrelating to both land and ocean over almost the wholeperiod of interest with additional background fromBowler on events leading into the <strong>Quaternary</strong> period (i.e.the last 2.6 or 1.8 million years depending on a pendingdecision by the International Stratigraphic Commission).Bowler based his paper on the climatic significance ofsome 170 coastal strandlines preserved in the landscapefrom the Murray Basin to the present southern Australiancoastline and indicated past sea-level highs related toclimate cyclicity over the last 6 million years. In contrastto a previous Late Cenozoic reconstruction (Bowler, 1982),where a major change to aridity (at least during glacialperiods) was thought to have occurred in association withthe establishment of a westerly wind circulation oversoutheastern Australia around the beginning of the<strong>Quaternary</strong>, the onset of the latest phase of aridity isconsidered to relate to a Mid Pleistocene transition,around 1.3 million years ago. This change is marked by achange from siliceous shorelines indicating low energyenvironments to calcarenite shorelines indicative of highenergy environments. As this change occurred some 500ka before the global transition from the 40 ka to 100 kaworld of glacial-interglacial cyclicity, Bowler considersthat it had a Southern Hemisphere cause, most probablyan increase in the latitudinal temperature gradient as aresult of an increase in Antarctic ice volume. This changewould have led to the development or intensification ofthe westerly wind system and aridity in Australia as well aspossibly triggering the onset of the 100 ka global cycles.Providing some support for the new Bowler model, KaleSniderman’s detailed and convincingly dated pollenrecord from an old volcanic crater lake in the WesternHighlands of Victoria indicates that a summer rainfallregime was still prevalent in Australia between 1.8 and 1.5Ma and that the climate was much wetter than that oftoday. However, dramatic oscillations in representation ofrainforest and sclerophyll vegetation are interpeted asindicating 20 ka rather than 40 ka cyclicity. It is proposedthat Southern Hemisphere insolation cycles, rather thanglacial cycles forced by global ice volume, were thedominant controls over precipitation-induced variation invegetation. Barbara Wagstaff’s equally long, detailed andfission track dated pollen records from volcanic craterlake sediments could provide some refinement of theBowler model. Conditions were generally drier than todaythrough the period 1.2 Ma to 1 Ma with variation in thepredominantly steppe (grass and herbs) and woodland(Callitris and Casuarinaceae) vegetation showing consistencywith precessional forcing. The Mid Pleistocenetransition is clearly marked between about 1 Ma and 900ka, earlier than the global switch to 100 ka cyclicity, withsome replacement of Callitris by Eucalyptus, the beginningof significant representation by forest elements andsome plant extinctions. This picture contrasts with theBowler model in suggesting a later transition, althougha Southern Hemisphere influence, and an increase inrainfall cannot be discounted, though this is likely to havebeen restricted to interglacial periods. Between about 900ka and 700 ka, there is clear cyclicity consistent with the34 | <strong>Quaternary</strong> AUSTRALASIA <strong>24</strong> (2)
100 ka world and with late <strong>Quaternary</strong> records from theregion.The extent to which patterns of change in the midlatitudes of the Australian region can be applied to theSouthern Hemisphere generally was brought intoquestion by the marine palynological record of LydieDupont from off the coast of Namibia in SW Africa(presented in the ‘Aridification of the Four SouthernHemisphere Continents’ symposium). The record,covering the period 3.4 to 1.8 Ma, suggests that there wasan increase in winter rainfall between 3.1 and 2.2 Ma witha northward shift in Polar Front and an increase in thepole-equator thermal gradient, consistent with the onsetof the westerly wind system in the original Bowler model.However, increased aridity after this time was partiallyexplained by a southward shift in the Polar Front asindicated in both marine and terrestrial proxies.An overview of detail within the last glacial-interglacialcycle in the southern <strong>Australasian</strong> region was providedby four high resolution, multiproxy marine records byTim Barrows. A common timescale demonstrated synchroneityof records with <strong>No</strong>rthern Hemisphere insolationand ice volume at the orbital scale in calculated seasurface temperatures from foraminifera, alkenones andmagenesium/calcium ratios on foraminiferal carbonate.Abrupt temperature changes of up to 6 o C occurred withina few centuries. Synchroneity extended to terrestrialsedimentary and pollen signals from the records. A clearSouthern Hemisphere signal in the Southern Ocean isdemonstrated during the last glacial period, by correspondencewith millennial variation recorded in Antarcticice cores rather than Greenland Dansgaard-Oeschgerevents and by the lack of a Younger Dryas cooling period.The orbital picture was echoed in the presentation bySander van der Kaars on an oxygen isotope dated, 150 karecord from off the southern coast of Western Australia.Preliminary pollen analysis indicates highest rainfall withexpansion of woody vegetation during interglacials, withgreatest expansion during MIS 5e. Charcoal evidencesuggests highest burning levels during MIS 5 withreduced burning, possibly due to a reduction in fuel, afterthis time. This burning pattern is similar to that from amarine core of northwestern Australia (van der Kaars andDe Deckker, 2002) suggesting a it could be a broadregional pattern. One feature of interest to those involvedin the ‘Megafaunal Extinction’ symposium was thenotable decline in Sporomelle spores, a fungus consideredto indicate faunal biomass, in the middle of MIS 3.Merna McKenzie provided a comparative land record ofthe last glacial cycle from a very detailed record from thehigh altitude site of Caledonia Fen in eastern Victoria. Agecontrol is provided by radiocarbon and OSL dates throughthe last 70 ka. Temperature appears to provide the majorcontrol over vegetation that is dominated by alpineherbaceous vegetation except during the Holocene and,unexpectedly, at the beginning of MIS 3 where forestexpands. There is no clear fire signal but within thelatter part of MIS 3 a number of ancient, fire-sensitivetaxa disappear from the record. The last glacial periodis characterised by a number of abrupt ‘amelioration’events. However, dating is too imprecise to relate to either<strong>No</strong>rthern or Southern Hemisphere sub-millennialpatterns.Five papers, addressing Southern Hemisphere low latitudes,demonstrate a great deal of variation in patternsand forcing of climate over the last 50 to 500 ka. PatrickMoss presented an extension of the pollen record fromODP Site 820 in the Coral Sea that reinforces orbital-scale<strong>No</strong>rthern Hemisphere forcing. However, it also showsregional features. The most marked of these is a series ofstep-wise changes between 180 and 40 ka to more openvegetation and drier or more variable climates that areprobably a response to a sustained increase in sea surfacetemperature within marine proxies between about 350 kaand 250 ka. Although the cause is unknown, it probablyrelates to an expansion in the Indo-Pacific Warm Pool andan increase in intensity of ENSO. The regional significanceof this ‘Mid-Brunhes’ event was illustratedby Scott Hocknull (in the ‘Aridification’ symposium)from a fossil vertebrate record in northeastern Australia.The record reveals a major faunal turnover event fromrainforest to an open vegetation taxon dominance withreduced precipitation sometime between 280 and 170 ka.Peter Kershaw compared the ODP record with other longpalynological records from northern Australia and thelow southern latitudes of Southwest Africa and SouthAmerica, all of which have been suggested to be underthe influence of monsoon climates. Records from northwesternAustralia and southern Africa appear to showdomination by the Southern Hemisphere precession, atleast over the last 200 to 300 ka, and may be explained bythe response of monsoon rainfall to Indian Ocean seasurface temperatures. Conversely, records from the northof Australia are dominated by the <strong>No</strong>rthern Hemisphereobliquity signal indicating forcing by the Asian wintermonsoon. Although summer insolation, acting throughthe South Atlantic monsoon, is considered to be themajor influence on the Southern Hemisphere tropicsof South America (Fritz et al., 2004), a trend towardsincreasing moisture availability over the last 170 ka,inverse to that in northeastern Australia, may suggest thatincreasing Pacific El Niño activity was a major forcinginfluence.On a shorter timescale, Sue Rule presented results ofher very high resolution pollen and charcoal record fromLynch’s Crater, covering the last 50 ka within 9m ofsediment from contiguous 2cm samples. Sub-millennialscale variability that has been correlated with that in theGreenland ice cores (Turney et al., 2004), shows up inplaces as extremely abrupt events. It is hoped thatinteresting differences in charcoal derived from microfossiland macrofossil analysis will reveal the sources35 | <strong>Quaternary</strong> AUSTRALASIA <strong>24</strong> (2)
Report on the Symposium ‘Land-Ocean correlation of long <strong>Quaternary</strong> records...’ CONTINUEDof burning that reflect much of the pollen variation and,in particular, contribute to an understanding of the causeof the major increase in burning recorded about 45 ka.Using a similar time period, Andrew Marshall presentedresults from the Fast Ocean Atmosphere model applied toan understanding of monsoon rainfall patterns overnorthern Australia. The model results generally conformedwith available palaeodata and suggested that sealevel and solar insolation changes had dominated rainfallintensity over the period with little influence fromvegetation and greenhouse gases.There are few records of <strong>Quaternary</strong> climate change fromthe subtropics of coastal eastern Australia but LyndaPetherick helped fill this gap with a pollen and aeoliandust record from <strong>No</strong>rth Stradbroke Island in southernQueensland. The fact that it is continuous through thelast 40 ka suggests that glacial/interglacial rainfallvariability may not have been as great as in more temperateand tropical areas where continuous coastalsequences of this duration are generally absent. However,the aeolian component of the sediments does suggestnotable changes in rainfall with representation of eventssuch as the Last Glacial Maximum (LGM) and AntarcticCold Reversal. The analysis of a long distance dustcomponent allows identification of a number of differentsources, indicating systematic changes in atmosphericcirculation over the period.Other contributions focused the last 30 ka – the domainof INQUA Palaeoclimate Commission project‘<strong>Australasian</strong> INTIMATE (Integration of Ice, Marine andTerrestrial Records of the Last Glacial Maximum andTermination)’. Most intensive research on this period hasbeen undertaken in New Zealand and high resolutionrecords of pollen and other proxies from terrestrialrecords were presented from the South Island by MarcusVandergoes and from the <strong>No</strong>rth Island by Donna D’Costa.The representation of tephras provides an excellent basisfor dating and correlation within New Zealand andexamination of the degree of synchroneity of events withother parts of the world. Five key events have been identifiedin New Zealand within the LGM and Last Terminationthat extended from about 29 ka, earlier than theglobal onset in the <strong>No</strong>rthern Hemisphere and marinerecords, to 9 ka. An examination of terrestrial proxies inmarine records provided the basis for assessment ofclimate change and atmospheric circulation in southwestAfrica and south-west South America through andsince the LGM. Both the high resolution pollen recordsof Lydie Dupont from off Namibia and Angola and therecords of aeolian dust and fluvial mud of Jan-BerendStuut off the coast of Chile convincingly demonstrate thatthe Southern Westerlies extended substantially northwardsduring the LGM resulting in higher rainfall in theselocations. It is expected that a similar movement of thewesterlies should be recorded in southern Australasia butthe evidence, to date, is equivocal (Shulmeister et al.,2004). It is hoped that the data compilation of highquality records from the Southern Hemisphere, beingcompiled and analysed by Martin Williams, will allow acomprehensive picture of patterns and causes of climatechange over the whole region for the last 30 ka.The number of proxies developed for refinement andtesting of climatic estimates is increasing. A number ofrelatively new proxies, including alkenones and chironomidsthat can be applied to quantification of temperatureestimates of sea surface and aquatic temperatures respectively,have been applied in some of the studiespresented. One method that has been neglected in SouthernHemisphere studies, is the systematic application ofplant macrofossils to refinement of vegetation andclimate reconstructions generated by pollen analysis.Here, Tara Lewis demonstrated the value of the methodwithin records from the Western Plains of Victoria. She isdeveloping a seed data base to help develop the generalapplication of the method within the region.The symposium has highlighted a greater degree ofvariation in climate change in the Southern Hemispherethan is generally apparent in the <strong>No</strong>rthern Hemisphere.It appears that there has been a dilution of the <strong>No</strong>rthernHemisphere signal, most obvious on land rather than inthe ocean, relative to regional insolation acting throughmonsoon-type processes, ENSO and Antarctic ice. Thesituation is clearly complex and there is need for a greatdeal more research, in the form of data generation andanalysis involving existing and new proxies as well asmodelling, to understand underlying forcing of climateon a range of spatial and temporal scales. However, thewealth of information presented in the symposiumprovides some basis for identification of promising areasfor future research and of gaps that need to be filled.References• Bowler, J.M. 1982. Aridity in the Tertiary and <strong>Quaternary</strong> ofAustralia. In W.R. Barker and P.J.M. Greenslade (editors)Evolution of the Flora and Fauna of Arid Australia. PeacockPublications, Frewville, 35–45.• Fritz, S.C., Baker, P.A., Lowenstein, T.K., Seltzer, G.O., Rigsby,C.A., Dwyer, G.S., Tapia, P.M., Arnold, K.K., Ku, T.-L.and Luo, S.,2004. Hydrologic variation during the last 170,000 years in theSouthern Hemisphere tropics of South America. <strong>Quaternary</strong>Research, 61, 95–104.• Shulmeister, J., Godwin, I., Renwick, J., Harle, K., Armond, L.,McGlone, M.S., Cook, E., Dodson, J., Hesse, P.P., Mayewski,P.and Curran, M., 2004. Southern Hemisphere Westerlies inthe <strong>Australasian</strong> sector over the last glacial cycle: a synthesis.<strong>Quaternary</strong> International, 118–119, 23–53.• Turney, C.S.M., Kershaw, A.P., Clemens, S., Branch, N., Moss,P.T.and Fifield, L.K., 2004. Millennial and orbital variations inEl Niño/Southern Oscillation and high latitude climate in thelast glacial period. Nature, 428, 306–310.• van der Kaars, S.and De Deckker, P., 2002. A late <strong>Quaternary</strong>pollen record from deep-sea core Fr10/95-GC17 offshore CapeRange Peninsula, northwestern Western Australia. Review ofPalaeobotany and Palynology, 120,17–39.36 | <strong>Quaternary</strong> AUSTRALASIA <strong>24</strong> (2)
Workshop ReportAustralia and New ZealandGeomorphology Group WorkshopNew Frontiers in River Research, Canberra and Kioloa6 – 8 February <strong>2007</strong>Kathryn Amos, Rachel NansonKathryn Amos: School of Physical, Environmental and Mathematical SciencesThe University of New South Wales at the Australian Defence Force Academy, Canberra ACT 2600 Email: k.amos@adfa.edu.auRachel Nanson: Department of Archaeology and Natural History, Research School of Pacific and Asian StudiesAustralian National University Canberra ACT 0200 Email: rachel.nanson@anu.edu.auFigure 1. Workshop participants at Tuross Head, with the beach and estuary barrier in the background. Photo taken by Jim Brophy.From the 6th – 8th February <strong>2007</strong>, the fluvially-inclinedmembers of the Australian and New Zealand GeomorphologyGroup (ANZGG) gathered for a workshop toexplore new frontiers in river research. <strong>2007</strong> is a ‘gap year’between the bi-annual ANZGG conferences and theworkshop was intended to maintain the momentum ofcommunication between fluvial geomorphologists withinthe region. It also provided a forum for researchers andstudents to share ideas, present new work and discusstechniques, ideas and problems in an informalenvironment. The 55-plus participants included students,early-career researchers, academics and agency-basedscientists. Thirty oral presentations covered a range oftopics, from the arid zone to the tropics, gully erosion toriver rehabilitation, and LIDAR to new advances inradioisotope and luminescence dating techniques.The meeting began in Canberra, at CSIRO Land andWater, where invited speakers presented on a range oftopics targeted at providing the audience with rapidinsights into current approaches to fluvial research andrehabilitation. John Gallant (CSIRO) provided an overviewof the application of LIDAR to fluvial environments andAndrew Brooks (Griffith University) presented anassessment of the practicalities of Large Woody Debris(LWD) re-emplacement in south-eastern Australian riversystems. Tim Pietsch (CSIRO) and Ed Rhodes (AustralianNational University [ANU]) each described the theory ofOptically Stimulated Luminescence (OSL) single andmultiple aliquot dating techniques, and highlighted theirapplicability, potential problems, and ideal samplecollection methodologies.Late on Day 1 the meeting adjourned to the New SouthWales (NSW) South Coast. Participants drove across themiddle reaches of the Shoalhaven catchment beforedescending 800m down Clyde Mountain to the ClydeRiver. A short drive north up the narrow coastal plainsbrought them to the lovely ANU coastal campus at Kioloa,where master chef Jim Brophy (CSIRO) prepared atraditional Aussie BBQ.Day 2 comprised a field trip, led by Paul Rustomji(CSIRO), to the lower Tuross River (Figure 1) in southeasternNSW, to observe some of the fascinating floodplainmorphologies that occur within this system and todiscuss the drivers for Holocene valley aggradation.37 | <strong>Quaternary</strong> AUSTRALASIA <strong>24</strong> (2)
Australia and NZ Geomorphology Group Workshop CONTINUEDThe Tuross River drains a catchment of c. 2180 km 2 andis a confined, sand-bedded meandering river (Fergusonand Brierley, 1999) with an intermittent/ephemeraldischarge regime. The steep forested headwaters of theTuross River reach an elevation greater than 1000 m asl,and are underlain by Devonian granites. On the coastalside of the Great Dividing Range escarpment, the catchmentis underlain by Ordovician metasediments. In thelowermost 60 km of channel, slope decreases from 0.0011to 0.0007 m m -1 and bed material fines downstream fromcobbles to sand, with mixed sand and mud in the infillingestuary lake which is impounded by a coastal sand barrier(Rustomji et al., 2006).The field trip started at Tuross Head, which overlooks themouth of the wave-dominated estuary of the Tuross River.At the time of our field trip, the estuary was completelyblocked by a large sand barrier (Figure 2a), a commonfeature of the many wave-dominated estuaries of Australia’ssouth-east coast. Paul Rustomji has estimated thatthere has been sufficient inflow to the Tuross estuary forit to be flushed and the barrier breached between 10 and50 times per decade over the past 100 years. By way ofdemonstrating geomorphology in action, a few days afterour visit to the area, over 150 mm of rain fell over thecatchment. This triggered a spectacular breach of thebarrier (Figure 2c).The field trip then moved upstream to our second stop,overlooking the meandering lower reaches of the TurossRiver. Here, Holocene progradation of the river mouthresulted in floodplain aggradation over estuarinesediments. Alec Costin pointed out the low-lying floodbasin depressions along the bedrock margins and palaeochannelsthat have been submerged during periods ofhigh discharge.Figure 2. Geomorphologists trigger estuary mouth opening?Three days after the ANZGG workshop fieldtrip to the TurossRiver on the New South Wales south coast, 150 mm of rain fellover the weekend, resulting in the opening of the estuary mouthin fairly spectacular fashion. A. Before breach (photo taken byJeff Shellberg). B. After breach (photo taken by James Woodford).C. At the breach (photo taken by James Woodford).As we travelled further upstream, dominant alluvialfeatures became apparent, including a prominent highlevelalluvial (levee/floodplain) surface that is typically 10-14 m above the thalweg, and substantial benches that aretypically 6–8 m above the thalweg and less than 50m wide(Ferguson and Brierley, 1999; Rustomji et al., 2006). Forthose participants used to working on near-flat floodplainsthat are many kilometres wide, the narrow valleysand distinct topography of alluvial features were a luxury,although some participants from New Zealand remarkedon the lack of “real rivers” in this part of the world!At our lunch stop a debate arose over the mechanism bywhich Holocene valley aggradation occurs. Paul Rustomjiproposed a model by which aggradation is driven by rivermouth progradation, with a constant rate of aggradationoccurring at all locations along the lower Turossextending tens of kilometres upstream. This model wasvigorously challenged by Tim Cohen, who proposed thatthe rate of floodplain and bed aggradation must diminishin an upstream direction, and should only extend as far as38 | <strong>Quaternary</strong> AUSTRALASIA <strong>24</strong> (2)
the backwater effects. The conflict of opinion was enjoyedby all, including the most involved and opinion-atedparticipants to the debate.Discussion was also sparked over what defines an “active”floodplain. It was suggested that an inundation frequencyof 5 years or less is appropriate for the definition of acontemporary floodplain surface along this river, but anumber of participants emphatically stated that such adefinition is not necessarily applicable in environmentswith ephemeral or highly variable discharge. OSL datingof floodplain deposits in the lower Tuross have shownthat there has been a marked decrease in accretion ratesof the high level surface over the past 2500 years, and this‘high-level accretion surface’ has been described as anabandoned floodplain (Rustomji et al., 2006). This wasqueried by some who argued that in a system with anintermittent discharge regime, a floodplain surface that isregularly inundated (last recorded ∼20 years ago) is notabandoned and should be described as an activefloodplain.After an evening of further vigorous discussion, the finalday consisted of a full day of talks, followed by a returndrive to Canberra. Students and NRM agency representativeswere well represented on this final day andtheir talks demonstrated the range of tropical, arid andtemperate zone river research currently being undertakenin the Australian and New Zealand region. The workshopwas a fantastic opportunity for the Australia and NewZealand fluvial geomorphology community to gettogether, discuss our research techniques and latestresults and communicate these to students, early careerresearchers and NRM practitioners. We are grateful toCSIRO Land and Water, and Land and Water Australia,who provided a $3500 conference grant to ensure thesuccess of our first biannual fluvial group meeting.Further information about the ANZGG and their regularbi-annual meetings, including the upcoming meetingwhich will be held in Tasmania in February 2008 (Ancientand Modern: late Cainozoic modification of Australasia’srelict landscapes) can be found at: http://www.anzgg.org.References• Ferguson, R.J. and Brierley, G.J., 1999. Levee morphology andsedimentology along the lower Tuross River, south-easternAustralia. Sedimentology, 46, 627–648.• Rustomji, P., Olley, J. and Chappell, J., 2006. Holocene valleyaggradation driven by river mouth progradation: examplesfrom Australia. Earth Surface Processes and Landforms, 31,1510–15<strong>24</strong>.39 | <strong>Quaternary</strong> AUSTRALASIA <strong>24</strong> (2)
Conference ReportThe 2nd International Young Scientists’Global Change Conference, ANDThe 2nd Earth System Science Partnership’sOpen Science ConferenceGlobal Environmental Change: Regional Challenges<strong>No</strong>vember 2006 Beijing ChinaJoëlle GergisSchool of Creative Media, RMIT University, Melbourne Victoria 3001Email: jgergis@gmail.comIn <strong>No</strong>vember 2006, I had the privilege of representingAustralian palaeoclimatology at two internationalmeetings on global change research held in Beijing,China. They profoundly challenged my views on the threatposed by global warming. Climate change is very real,happening now, and the rate of change is accelerating. Iwas struck by the urgency for direct and immediate actionneeded - at every level, in every nation.The first conference I attended was the InternationalYoung Scientists’ Global Change Conference (YSC)(Figure 1). The YSC took place <strong>No</strong>vember 5–8, 2006 theChina Meteorological Administration campus in Beijing,China. The conference was sponsored by the EarthSystem Science Partnership (ESSP) and was organised bythe global change SysTem for Analysis, Research andTraining (START) and the China MeteorologicalAdministration. START is a capacity building initiative forglobal change researchers funded by the ESSP program(detailed below). It targets developing countries andcollaborations that conduct research on regionalenvironmental change, the assessment of impacts andvulnerabilities to such changes, and information topolicy-makers.It brought together 100 young scientists from 35 countriesto discuss some of the key challenges facing ourscientific discipline, and the implications they hold forthe future of global sustainability. Four people attendedthe meeting from our region, including three Australians(Ben Preston (CSIRO), Anna Richards (University ofQueensland) and myself) and one New Zealander (OliviaWarrick (Victoria University)). I was the only Australian(and palaeoclimatologist) to address the congress.The conference was an excellent platform for youngscientists to present their research findings to both peersand leading scientists in the environmental change field.Keynote speakers included distinguished climatologistand numerical modeller Prof. Congbin Fu (China) andProf. Paul Crutzen (USA), who received the <strong>No</strong>bel Prize in1995 for his research on atmospheric ozone. The meetingwas organised into six themes:• Earth system variability and modelling• Ocean, freshwater and coastal systems• Land ecosystem and biodiversity• Biogeochemical cycles; cryospheric studies• Human vulnerability and risk management• Global change and agricultural systemsMy talk addressed uncertainties surrounding late 20thcentury El Niño-Southern Oscillation (ENSO) extremes(Gergis and Fowler, 2005). This involved reconstructingthe long-term history of ENSO using high-resolutionpalaeoarchives including tree-rings, corals, ice-cores anddocumentary records (Gergis et al., 2006). Previous ENSOreconstructions have been geographically biased towardEast Pacific teleconnection regions, with little representationof sites influenced by the Western Pacific warmpool. I presented the first large-scale Southern Hemisphereeffort to reconstruct ENSO using an expandednetwork of recently developed Western Pacific palaeoarchives.Of the total number of extreme El Niño/La Niña eventyears reconstructed since A.D. 1525, 43% occur in the 20thcentury. Strikingly, 30% of all reconstructed ENSO eventyears occur post-1940 alone, suggesting that recent ENSOvariability appears anomalous in the context of the pastfive centuries (Gergis and Fowler, 2005). These resultssuggest it is likely that ENSO operates differently undernatural (pre-industrial) and human-influenced backgroundstates. Given the large-scale socio-economicimpacts of ENSO events, investigations into how continuedglobal warming will influence future ENSObehaviour are vital.Over the course of the conference, we were encouragedto informally discuss the question “What are the bigquestions in global change science?” This lead to somevery interesting conversations, as it is not often you getphysical and social scientists from 35 countries in thesame room! Collectively, we identified three main areas:• Detection and attribution of physical climate cyclesand their forcing mechanisms;• Improved inter-disciplinary communication of sciencewithin and beyond the scientific communities;40 | <strong>Quaternary</strong> AUSTRALASIA <strong>24</strong> (2)
Figure 1. Participants of the 2nd International Young Scientists’ Conference on Global Change, 5–8 <strong>No</strong>vember 2006, Beijing, China.Photograph courtesy Sandra Stowe, International START Secretariat.• Adaptation and mitigation strategies to minimise socioeconomicimpacts.The key concern was how we can effectively apply ourscience to confront environmental challenges and createa sustainable future. Scientists from developing nationswere quick to comment that basic development issuesidentified by the 2005 Millennium Ecosystem Assessment,such as public health, food production, habitat fragmentation,coastal management and urbanisation, should notbe dealt with in isolation. Vulnerability to climate-relatedimpacts on society are compounded by factors unrelatedto climate change, such as rapid population growth,unsustainable patterns of development and socioeconomicinequity. Adaptation policy must aim to makesocieties more robust to developmental issues including,but not confined to, the issue of climate change.Improved dialogue between science and policy-makerswas also identified as another key priority area. As scientists,we need to be attuned to the interests of policymakers and need to improve on communicating ourwork to non-specialists. The group agreed that there isan important and practical need to continue interdisciplinarymeetings, such as this one, to cultivate anunderstanding of the complexity of global environmentalchange research and its practical application.After negotiating the tangle of inner-city Beijing for afield trip to the awe-inspiring Forbidden City, all YSCparticipants then took part in the Earth System SciencePartnership’s Open Science Conference, “Global EnvironmentalChange: Regional Challenges”, at the BeijingInternational Conference Center. The ESSP is a collaborationbetween the four major international globalchange research programmes:DIVERSITAS: an International programme of biodiversityscienceIGBP: the International Geosphere-Biosphere ProgrammeIHDP: the International Human Dimensions Programmeon Global Environmental ChangeWCRP: the World Climate Research ProgrammeThe meeting was attended by more than 1,000 globalenvironmental change scientists, policy makers, membersof the private sector and journalists. Issues discussedranged from state-of-the-art advances in climate science,global food security, human health, sustainable developmentand biodiversity loss. The concept of a new form of“Earth System Science” was proposed as a cross-disciplinaryintegration of environmental and developmentalsustainability in the natural and social sciences.The term Anthropocene, first suggested by Paul Crutzenin 2000, is now being used to describe the most recentperiod in the Earth’s history. The period begins during the18th century when the activities of humans first began tohave a significant impact on the Earth’s climate and ecosystems.Crutzen explained how the influence of humankindon the Earth in recent centuries as so significant asto constitute a new geological era.In a radical attempt to sequester atmospheric carbon,he discussed a controversial “geoengineering solution”currently being investigated by NASA (Crutzen, 2006).It is proposed that one million tonnes/year of sulphateaerosols are injected 16km into the upper atmosphere toincrease the albedo of the earth’s atmosphere, reducingglobal warming. This essentially simulates the radiative41 | <strong>Quaternary</strong> AUSTRALASIA <strong>24</strong> (2)
Global Change and Earth System Sciences Conferences CONTINUEDeffect of a large volcanic eruption, with models predictinga substantial warming of winter temperatures in the<strong>No</strong>rthern Hemisphere. There is also lot of uncertaintyabout acid rain fallout and the impact on precipitationand temperatures in the stratosphere. This seems a desperateattempt to initiate a 3°C cooling to offset 2°C ofglobal warming. Having sat through days of talks describingpractical adaptation and mitigation solutions toa shifting climate, I found the whole concept a little hardto swallow.But drastic times call for drastic measures. We learnedthat the planet is currently in a “non-analogue” statewhen the environmental conditions experienced todayhave no historical counterpart any time in our geologicpast. According to evidence from ice-core records drilledfrom Dome Concordia (Dome C) in Antarctica, the closestwe get to finding global temperatures somewhat similarto present is close to 800,000 years ago (EPICA, 2004).During that period, there were nowhere near the 6.6billion people with the technology to alter the ecologicalsystems the Earth houses today.CSIRO’s Michael Raupauch, from the Global CarbonProject, explained that global growth in carbon dioxideemissions from fossil fuels was four times greater in the2000–2005 period than in the preceding ten years. Despiteefforts to reduce carbon emissions, the global growth ratein CO 2 was 3.2% in the five years to 2005 compared to 0.8%in the 1990 to 1999 period. Recent efforts to reduce emissionshave had virtually no impact on emissions growthand effective caps are urgently needed. Raupauch statedthat on our current path, we will find it extremely difficultto rein in carbon emissions sufficiently to stabilise theatmospheric CO 2 concentration at 450 ppm; even 550ppm will be a challenge.Currently, we are on track for the IntergovernmentalPanel on Climate Change (IPCC) A1B “worst case”scenario trajectory. As outlined in the recently releasedClimate Change <strong>2007</strong>: The Physical Science Basis: Summaryfor Policy Makers, this is likely to be shaped by an increasinglyfrequent series of extreme climate episodes in arapidly unstable and unpredictable climate system.Due to environmental inertia, even when anthropogenicemissions do begin to decrease, atmospheric CO 2 willcontinue to rise for up to a century.This concept is often referred to as our “commitment” toclimate change. During this period, global temperatureswill continue to increase, locking the world into continuousfeedbacks of unforeseen climatic change. Effectivemanagement of the Earth system under such conditionswill depend on early and consistent actions. Action isneeded now, not in some vague, distant future. This hadme (and many others) squirming in my seat: what to do?At the close of the meeting, Conference Co-Chair GordonMcBean (Canada) presented the Statement of the BeijingConference on Global Environmental Change, formulatedas an urgent call by the scientists to society and policymakers to collaborate in the face of an ever fasterchanging environment. They noted: In this era of humanactivities modifying the planet on a global scale, we areconcerned for the continuing adverse affects on the globalenvironment and the resulting serious threats to sustainabledevelopment of human society.The urgent need for improving communication betweenscientists with the broader public was identified, statingit was our role to: Take responsibility to mobilise knowledgefor action, and provide society with the scientific informationto better meet present and future needs within thecontext of sustainable development.This left me with mixed feelings. I was concerned at thedistinct lack of Australian and New Zealand scientists atthese meetings. More importantly, I was concerned aboutthe lack of research opportunities available in globalchange in Australasia. On a positive note, it gave me thefinal motivation to begin engaging in sciencecommunication work.I strongly encourage young scientists to keep an eye outfor these inter-disciplinary conferences. They provide anoutstanding opportunity to expand knowledge of globalchange, to educate others about your field and learn howyour work fits into the “bigger picture”.We have a responsibility as scientists to get involved incommunicating to the broader community and acrossdisciplines if the breakthroughs needed to face climatechange are to be realised. Global environmental change isan immense social and technological call-to-action thatwill require collaboration on every scale. As is clear fromthe latest IPCC report, it is one we cannot afford not toheed.References• Crutzen, P. 2006. Enhancement by Stratospheric SulfurInjections: A Contribution to Resolve a Policy Dilemma?Climatic Change 77 (3–4), 211–220.• EPICA, 2004. Eight glacial cycles from an Antarctic ice core.Nature 429, 623–628.• Gergis, J. and Fowler, A. 2005. Classification of synchronousoceanic and atmospheric El Niño-Southern Oscillation (ENSO)events for palaeoclimate reconstruction. International Journalof Climatology 25, 1541–1565.• Gergis, J., Fowler, A., Braganza, K., Risbey, J. and Mooney, S.2006. Reconstructing El Niño-Southern Oscillation (ENSO)from high-resolution palaeoarchives. Journal of <strong>Quaternary</strong>Science 21(7),707–722.• Gergis, J. and Fowler, A. 2006. How unusual was late TwentiethCentury El Niño-Southern Oscillation (ENSO)? Assessingevidence from tree-ring, coral, ice and documentary archives,A.D. 1525–2002. Advances in Geosciences 6, 173–179.• Intergovernmental Panel on Climate Change (IPCC) <strong>2007</strong>.Climate Change <strong>2007</strong>: The Physical Science Basis, Summary forPolicymakers. Intergovernmental Panel on Climate Change,Geneva, Switzerland.• Millennium Ecosystem Assessment 2005. Ecosystem andHuman Well-Being. Island Press, Washington DC, USA.42 | <strong>Quaternary</strong> AUSTRALASIA <strong>24</strong> (2)
Workshop ReportPlant Macrofossil WorkshopUniversity of Adelaide 15–19 January <strong>2007</strong>John TibbyGeographical and Environmental StudiesUniversity of Adelaide South Australia 5005Email: john.tibby@adelaide.edu.auWith support from the ARC funded EnvironmentalFutures Network, John Tibby and Jennie Fluin organised aplant macrofossil workshop at the University of Adelaide.The course was delivered primarily by Drs Carl Sayer andTom Davidson of the Environmental Change ResearchCentre, University College London, and attended byparticipants from University of Adelaide, ANU, Universityof Canberra, Flinders, Macquarie and MonashUniversities, University of Tasmania and the EnvironmentProtection Authority, Victoria. The workshop was biasedtowards applied issues and examined how plant seeds,leaves and other assorted “bits” can document changes inaquatic plant composition and abundance. Workshoptopics included:• determining restoration targets using plant remains,• the ecological structuring role of plants in shallowlakes,• production, dispersal and preservation of plantremains.Examples of Australian work were presented by TaraLewis (Monash), Michael Reid (Canberra), Susan Rule(Monash) and John Tibby (Adelaide). Tara Lewis and SueRule focussed on using the plant record forreconstructing climate change in, respectively, WesternVictoria (focussed on Lake Surprise) and NE Queensland(Lynch’s Crater). Michael Reid’s talk highlighted theutility of plant-associated animals for understandingEuropean impacts on plant cover (particularly in theabsence of plant remains themselves). John discussedEuropean impacts on plants from the coastal lakes, LakeAinsworth (NSW) and The Coorong (SA), the latterrepresenting the work of Honours student Jenny Dick.Both Tara Lewis and John Tibby’s presentations notedrecent localised extinctions of plants from study sites,while Sue Rules’s research showed how the macrofossildata has helped her to identify unknown pollen typeswhich then provided a longer record of the plant’spresence in the landscape.Figure 1. Nymphaea sp., 18 Mile Swamp, Stradbroke Island,Queensland, a taxon which leaves identifiable remains includingseeds.The workshop was a great success, tremendous fun(including many references to the recent Ashes campaignand poetry delivered by presenters and participants alike)and illustrates that we are at the tip of a large andinteresting iceberg in terms of our understanding of precontactplant communities in Australia.For further information see• Davidson, T A., Sayer, C.D., Bennion, H., David, C., Rose, N.,Wade, M.P. 2005. A 250 year comparison of historical,macrofossil and pollen records of aquatic plants in a shallowlake. Freshwater Biology 50, 1671–1686.• Reid, M., Sayer, C.D., Kershaw, A.P., Heijnis, H. in press.Palaeolimnological evidence for submerged plant loss in afloodplain lake associated with accelerated catchment soilerosion (Murray River, Australia). Journal of Paleolimnology.• Sayer, C.D., Jackson, M.J., Hoare, D.J., Waldock, M.J., Simpson,G.L., Boyle, J.F., Jones, J.I., Appleby, P.G., Liptrot, E.R.,Henderson, A.C.G. 2006. TBT causes regime shift in shallowlakes. Environmental Science & Technology 40, 5269–5275.43 | <strong>Quaternary</strong> AUSTRALASIA <strong>24</strong> (2)
Book ReviewsEvolution and Biogeography ofAustralian VertebratesEdited by J.R. Merrick, M. Archer,G.M. Hickey and M.S.Y. LeeISBN: 0 9757790 1 XCasebound RRP $AUD 230.00 (incl. GST)Paperback $AUD 170.00 (incl. GST)For a summary of postage and packingcharges please see www.auscipub.comSummary of featuresThis large reference volume (ReducedA4: 275 x 210 mm, 942 pp.) provides acomprehensive overview of the knowledgeof vertebrate diversity withinAustralasia, together with discussion ofthe factors that influenced the evolutionand distributions of the faunas we seetoday. By considering the major forcesshaping the extant vertebrate assemblages,using new techniques and strategies,we can formulate ideas about howto best conserve and manage thesedynamic vertebrate groups as well as theecosystem complexes on which theydepend.The 38 chapters are divided into 7 majorsections. The first group of chapterscovers the general topics of classificationand evolution, together with geologic andclimatic processes influencing environmentsand biogeography of parts ofAustralasia. Then follow 5 sections thateach concentrate on a major vertebrategrouping, from primitive jawless fishesto specialized marine mammals andhumans. The final section focuses onthe future, describing some of the latesttechniques and systems used for assessingbiodiversity and assisting in conservationmanagement.Each chapter is fully sourced andillustrated with line diagrams, as well asother figures next to the relevant text.Attempts have been made to maintain aclear, informal style for readers withoutspecialized knowledge and a humorousor irreverent essence when appropriate.The 136 colour plates are distributedthroughout the book as close to therelated chapters as possible. A generalcombined Index is at the back.Over 50 leading researchers, from allparts of Australasia and elsewhere, havecombined as authors and co-authors tomake this a ground-breaking volume ofinternational significance. This resourcebook follows in the tradition of VertebrateZoogeography & Evolution in Australasia(edited by Archer and Clayton) releasedin 1984. This new title is a natural devel-0pment providing a balanced updatedcoverage of the field. It is hoped thisbook will:• increase awareness of the unique<strong>Australasian</strong> vertebrate faunas;• emphasise the importance of<strong>Australasian</strong> environments and theassociated biodiversity• provide background for decisions thatlimit biodiversity loss in the region –against the trend in the current worldwideextinction crisis.• • • • •Australia’s Mammal Extinctions:A 50, 000 Year HistoryChris JohnsonCambridge University Press 2006ISBN/EAN: 0521686601/9780521686600Paperback: AU$49.95Megafauna extinctions in Australia andthe Americas have attracted the attentionof scholars with diverse approaches to theexpanding databases from geology, biology,archaeology and the dating thatconstrains them. James Cook Universityecologist Chris Johnson scrutinises animpressive array of records relevant toAustralia’s mammal extinctions, usingnumerical modelling and modernecological research to inform debate onthe much-discussed Late <strong>Quaternary</strong>megamammal extinction as well as thesmaller mammals lost since 1778. Wellwrittennatural histories of Australianmammals are set against a backgroundof evolutionary trends and <strong>Quaternary</strong>climatic and environmental change, withexquisite colour paintings of recentlyextinctmarsupials and rodents, andcolour photos of extant marsupials andremnant vegetation, illustrating whathas been lost and the much-reducedendangered fauna we still have.In evaluating the probable cause(s) of theAustralian extinctions, Johnson methodicallytests multiple working hypotheses(Chamberlin 1890), using the stronginference procedure at the heart of thescientific method, which leads to thelogical exclusion of one or more alternatives.And as Platt (1964) reminded us,progress is seriously slowed when a logicalconflict of ideas degenerates into the kindof personal attack that currently plaguesextinction debates on both sides of thePacific Ocean. Johnson’s analysis excludesclimate change and hyperdisease, becausethe available data does not fit criticalpredictions of either hypothesis, and nodoubt some will dispute his conclusionthat predation is the most likely candidate:the first human colonists caused largemammal extinctions ca. 45,000 years ago,then a rapid human population increase inthe Late Holocene (and introduction of thedingo) primed a depleted fauna for theEuropean extinction of small-mediumsized mammals since 1788, particularly bythe introduction of foxes and cats.Addressing and updating issues raised inTim Flannery’s 1994 book The FutureEaters, Johnson wryly notes: At the risk ofoversimplification, the prehistory ofAustralia can be divided into two distinctecological periods: before and after 6 kyr ago.Where Flannery speculated that ‘fire-stickfarming’ was important soon after the Late<strong>Quaternary</strong> extinctions took out all thelargest herbivores, Johnson considers thatthe evidence, for example from charcoalparticle counts in lake and marine cores,44 | <strong>Quaternary</strong> AUSTRALASIA <strong>24</strong> (2)
does not convincingly demonstrate widespreadanthropogenic burning. However,increasing charcoal peaks through theHolocene probably do document themosaic burning practices of a rapidlyincreasing human population, which theJones (1969) thought experimentteleported back to megafauna extinctiontime. And where some have proposedrewilding experiments involving largeherbivores, Johnson suggests that anincreased dingo population (to suppresspredation by foxes and cats) would betterserve our remaining endemic mammals.It is not hard to imagine, despite theauthor’s persuasive argument, manynecks reddening at such a prospect.Australia’s Mammal Extinctions ishandsomely produced, a very good read,and highly recommended for bothacademic and non-specialist audiences.– Reviewed by Richard GillespieReferences• Chamberlin, TC. 1890. The Method ofMultiple Working Hypotheses. Reprinted1964: Science 148, 754–759.• Flannery, TF. 1994. The Future Eaters.Melbourne: Reed Books.• Jones, R. 1969. Fire stick farming. Mankind7, 256–271.• Platt, JR. 1964. Strong Inference. Science146, 347–353.ANZGG CONFERENCE 2008DEAR COLLEAGUES WE ARE PLEASED TO ANNOUNCE THE13th Australian and New ZealandGeomorphology Group (ANZGG)Conference: 10–15 February 2008IN STUNNING WESTERN TASMANIA, AUSTRALIAThe major theme of the conference is Ancient and modern:late Cainozoic modification of Australasia’s relict landscapesPlease visit the conference web pageto download the first circular and expression of interest form.Look forward to seeing you there!http://www.anzgg.org/Tasmania_2008_home.htmCONFERENCE ORGANISING COMMITTEEIan Houshold, Dept Primary Industries and Water,Tasmania, Australia Email Ian.Houshold@dpiw.tas.gov.auT (03) 6233 3868 F (03) 6233 3477 M 0419 744 500Dr Tim Cohen, Research FellowSchool of Earth and Environmental SciencesUniversity of Wollongong NSW, Australia, 2522.Email tcohen@uow.edu.auT (02) 4221 5318 F (02) 4221 4250Cradle Mountain, western Tasmania. Photo by Tim Barrows.45 | <strong>Quaternary</strong> AUSTRALASIA <strong>24</strong> (2)
Thesis AbstractsA Late <strong>Quaternary</strong> palaeoenvironmentalinvestigation of the fire,climate, human and vegetationnexus from the Sydney Basin,AustraliaMANU P. BLACK (PhD)University of New South WalesIt is widely believed that Australian Aboriginalsutilised fire to manage variouslandscapes however to what extent thisuse of fire impacted on Australia’secosystems remains uncertain. The latePleistocene/Holocene fire history fromthree sites within the Sydney Basin,Gooches Swamp, Lake Baraba and KingsWaterhole, were compared with archaeologicaland palaeoclimatic data using anovel method of quantifying macroscopiccharcoal, which is presented in this study.The palynology of the three sites was alsoinvestigated. The Gooches Swamp firerecord appeared to be most influenced byclimate and there was an abrupt increasein fire activity from the mid-Holoceneperhaps associated with the onset ofmodern El Niño dominated conditions.The Kings Waterhole site also displayedan abrupt increase in charcoal at thistime however there was a marked decreasein charcoal from ∼3 ka. SimilarlyLake Baraba displayed low levels ofcharcoal in the late Holocene. At bothKings Waterhole and Lake Baraba archaeologicalevidence suggests intensifiedhuman activity in the late Holocene duringthis period of lower and less variablecharcoal. It is hence possible that Aboriginalpeople dominated fire activity in thelate Holocene perhaps in response to theincreased risk of large intense fires underan ENSO-dominated climate becamemore prevalent. The fire history of theSydney Basin varies temporally and spatiallyand therefore it is not possible touse a single type of fire regime as amanagement objective. There were nomajor changes in the composition of theflora at all sites throughout late Pleistocene/Holocenealthough there were somechanges in the relative abundance ofdifferent taxa. It is suggested that theSydney Sandstone flora, which surroundsthe sites, is relatively resistant to environmentalchanges. Casuarinaceae waspresent at Lake Baraba during the LastGlacial Maximum and therefore the sitemay have acted as a potential refugiumfor more mesic communities. There was anotable decline in Casuarinaceae duringthe Holocene at Lake Baraba and KingsWaterhole, a trend that has been found ata number of sites from southeasternAustralia.Late <strong>Quaternary</strong> Environmentsand Climate History at Lakes Bolacand Turangmoroke, WesternVictoria, AustraliaELLYN J. COOK (PhD)Monash UniversityA palaeoecological record produced fromLakes Bolac and Turangmoroke detailsthe changing nature of vegetationpatterns, lake levels and climate in thedrier part of the Victorian Western Plainsover approximately the last 90,000 years.In addition to the routine palynologicalproxies of pollen, spores and charcoal, arange of non-pollen palynomorphs wasanalysed and their usefulness aspalaeoecological indicators in Australiawas evaluated. A range of transferfunctions was also developed to relatemodern (pre-European) pollendistributions to climatic parameters inmainland southeastern Australia. Thefunctions that reconstruct summer,annual and winter rainfall andtemperatures were found to be the mostrobust while temperature of warmest andcoolest periods, and moisture indexes arealso strong. Application of the functionsto the fossil data from Lakes Bolac andTurangmoroke produced estimates whichare corroborated by trends seen in otherlines of evidence, confirming this newapproach as an additional reliabletechnique for quantification of the pastclimates of mainland southeasternAustralia.During marine isotope stage (MIS) 5.1and mid MIS 3 the palaeoecologicalrecord indicates regional vegetationcomposed of open woodland dominatedby Allocasuarina luehmannii type with lownumbers of Banksia, Eucalyptus andother Myrtaceae under which a diverseunderstorey developed. During thesetimes Lake Turangmoroke held freshwater of varying depths. Estimatesderived from pollen data show theseperiods received annual precipitationhigher than today which was moreequally distributed between summer andwinter. Strong contrast in seasonaltemperature extremes during MIS 5.1appears to relate to corresponding peaksand troughs in insolation received at thesite. The degree of representation of MIS4 and MIS 3 in the record is uncertainowing to discontinuities resulting fromthe lake having periodically dried.Luminescence dating indicates a changeto open grassland-steppe occurred shortlyafter 47,000 years BP and lake levelsfluctuated considerably before the lakebecame shallow and saline. Opengrassland-steppe continued through MIS2 with almost no presence of trees whilethe aquatic flora reflected further lakelevel declines and increasing salinity.Driest conditions, indicated by deflationof lake sediments during lunettebuilding, are dated to between ∼18000and ∼11000 years BP. Open woodland inthe early Holocene was dominated byAllocasuarina verticillata type until partialreplacement by Eucalyptus around7–8000 years ago when the vegetationcover present at European arrival wasestablished. Increased contrast betweensummer and winter precipitation andmuch reduced contrast in temperatureparameters marked the establishment ofpresent day climatic patterns for this partof Western Victoria. Considerableevidence for mean annual temperatureshigher than today in the early Holocene,increased regional precipitation duringthe mid Holocene and late Holocenedrying suggested by other studies fromthe region was discernable in thepalaeoecological record, lake level historyand the quantitative climatic estimatesfrom Lakes Bolac and Turangmoroke.Comparison of the palaeoecologicalrecord with those from Lakes Wangoomand Terang on the wetter part of thewestern plains shows good correspondencein the upper parts of the sequencesbut, beyond this, a lack of reliablechronologies for the latter recordsprevents the establishment of absolutecorrelations. However, changes invegetation and climate patterns weresufficiently distinct to allow explorationof climate forcing and representation inall three sequences was found to followchanges in the southern hemispheremid-latitudinal westerly circulation.This finding suggests that patterns ofvegetation change recorded in pollenrecords from southeastern Australia arestrongly influenced by local insolation inaddition to northern hemisphere forcing.Environmental Boundaries in theSydney Basin during the HoloceneROSALIND JAMES (PhD)School of Human and Environmental Studies,University of New EnglandThis thesis tests selected environmentalindicators against a chronological recordderived from estuarine sediments inorder to assess the possibilities ofdisentangling human from naturalimpacts on the environment in theSydney region during the mid to lateHolocene. Results show that46 | <strong>Quaternary</strong> AUSTRALASIA <strong>24</strong> (2)
environmental conditions in south eastAustralia during the mid to late Holocene,if the indicators from the SydneyBasin are representative, were anythingbut stable, albeit within a smaller rangethan the greater perturbations of theGlacial Cycle. Although there are wellknown problems associated with the useof saline estuarine deposits, the lack ofthe desiccation and degradation of thesediment record which mars most inlandAustralian wetland sedimentary sitesmore than makes up for these disadvantages.Estuarine muds and sands givea continuous and relatively stable record,once the singular geochemistry of sulphatesoils is understood and controlledfor in the analysis. An achievement of thiswork was to blend the age profiles ofLead-210 and Carbon 14 isotopes, and tosome extent bridge the troublesome gapof the last 500 to 1000 years, so that forthe first time European impact can becompared directly with the periodimmediately preceding it. This workshows that there is a wealth of evidenceavailable in the sediment sinks of theSydney estuaries, and that that evidence,even within the limits of the analysesused, plainly shows periods of sharpchange. The changes were overwhelminglydriven by larger scale climaticchanges, with two turning points: onearound 2800–3000 cal years BP, andanother around 500 years BP. Theseturning points showed up over severalsites and wide areas of the Sydney Basin.Human land use practices such asburning may well have taken advantageof climate shifts, but were very muchsecondary to the effects of the largermeteorological changes. Even the muchgreater impact of European settlement issometimes negated by environmentalshifts: Aboriginal land use impact mayhave been even less able to prevail againstclimatic shifts which are ultimately ofextra-terrestrial origin. The results of thisstudy casts doubt on the efficacy of charcoalcounts on their own as an adequatemeasure of fire history, and stronglysuggests that charcoal in the sedimentrecord is sometimes more useful as anerosion marker than an account of actualfire history, whether human or natural.However, in some cases, charcoal used inconjunction with other analyses, particularlymagnetic susceptibility andgeochemistry, can pinpoint extreme fireevents. The most valuable environmentalindicator proved to be phytoliths,although these only gained their fullusefulness in parallel with the other,more arduous and less spectacularmethods, such as stratigraphic logging,magnetic susceptibility andgeochemistry, within the limits of thegeochronology. The work lays a usefulbase for interpreting the Holocene in theSydney basin on which more sophisticatedand expensive methods can beapplied to get a more exact picture.However, the hard and necessary work ofcorrectly identifying and coring representativesites will always be the precursor ofmore complicated methods. This thesispresents the hard-won results of suchwork.• • • • •From Midden to Sieve: TheImpact of Differential Recoveryand Quantification Techniqueson Interpretations of ShellfishRemains in Australian CoastalArchaeologyROBYN A. JENKINS (Honours)School of Social Science, University ofQueensland rajenko@bigpond.net.auExperimental mechanical sievingmethods are applied to samples ofshellfish remains from three sites insoutheast Queensland, Seven Mile CreekMound, Sandstone Point and One-Tree,to test the efficacy of various recovery andquantification procedures commonlyapplied to shellfish assemblages inAustralia. There has been considerabledebate regarding the most appropriatesieve sizes and quantification methodsthat should be applied in the recovery ofvertebrate faunal remains. Few studies,however, have addressed the impact ofrecovery and quantification methods onthe interpretation of invertebrates,specifically shellfish remains.In this study, five shellfish taxarepresenting four bivalves (Anadaratrapezia, Trichomya hirsutus, Saccostreaglomerata, D. deltoides) and onegastropod (Pyrazus ebeninus) common ineastern Australian midden assemblagesare sieved through 10mm, 6.3mm and3.15mm mesh. Results are quantifiedusing MNI, NISP and weight. Analysesindicate that different structuralproperties and pre- and post-depositionalfactors affect recovery rates. Fragile taxa(T. hirsutus) or those with foliatedstructure (S. glomerata) tend to beoverrepresented by NISP measures insmaller sieve fractions, while more robusttaxa (A. trapezia and P. ebeninus) tend tobe overrepresented by weight measures.Results demonstrate that for allquantification methods tested a 3mmsieve should be used on all sites to allow forregional comparability and to effectivelycollect all available information about theshellfish remains.• • • • •A Method for Reconstructing the<strong>Quaternary</strong> Climates of AustraliaUsing Fossil BeetlesNICK PORCH (PhD)School of Geography and Environmental Science,Monash UniversityCurrent Address: Archaeology and Natural History,RSPAS, The Australian National University,Canberra, ACT 0200 nicholas.porch@anu.edu.auThis thesis presents a method forreconstructing Australian <strong>Quaternary</strong>climates using the modern climaticrequirements of beetle taxa. The method ofclimatic reconstruction utilised is thecoexistence (overlap) of the climatic rangesof taxa in the assemblages. In order to testthe performance of the method and toexamine the utility of various climaticparameters, bioclimatic profiles for 735taxa of Australian beetles were constructed.This involved the accumulation ofdistributional data from a wide range ofpublished and unpublished sources,geocoding of the localities (>5900), andanalysis using the computer programBIOCLIM to produce climatic summariesfor each taxon. Using this dataset, theability to predict modern values (on thebasis of modern assemblages), using therange of BIOCLIM temperature andprecipitation parameters, was tested bycomparing beetle-predicted with actualclimate at a range of sites from acrossAustralia.The results of these analyses suggested thebest performing BIOCLIM temperatureparameters were Annual Mean Temperature,the ‘summer’ or warm seasontemperature parameters Temperature of theWarmest Quarter and MaximumTemperature of the Warmest Month, and thewinter parameters Temperature of theColdest Quarter and Minimum Temperatureof the Warmest Month. Contrary to the<strong>No</strong>rthern Hemisphere, where the MutualClimatic Range method uses a measure ofseasonality (Trange), the AnnualTemperature Range was found to performpoorly in the observed versus predictedexperiments. In terms of precipitation themost useful parameters were found to beMean Annual Precipitation, andPrecipitation of the Warmest andPrecipitation of the Coldest Quarters.Critical consideration of these temperatureand precipitation parameters suggests47 | <strong>Quaternary</strong> AUSTRALASIA <strong>24</strong> (2)
Thesis Abstracts CONTINUEDthat, although they perform well underthe present climate space, complicationsmay arise under alternative climate spaceconditions that almost certainly existedduring the <strong>Quaternary</strong>. For this reasonwinter temperature parameters andsubsequently annual temperature reconstructionsneed to be regarded withcaution; the absence of cold continentalclimates today in Australia limits thepotential for reconstruction of suchclimates in the past.Summer temperatures (which are lesslikely to be influenced by climate spacelimitations, except at the extreme edgesof climate space), were routinely estimatedto within 1 o C of the actual value atmodern test sites – the precision increasingwith increasingly large assemblages.For precipitation parameters therelationships are more complex.Although coexistence methods yieldedacceptable results there are reasons totreat the actual-versus-predicted resultswith caution. The principal reason isrelated to the distribution of high precipitationenvironments in Australianclimate space; relative to drier areas, theyare infrequent and therefore less commonlyrepresented in the bioclimaticprofiles of taxa. It was subsequentlydetermined that, although the maximumof the predicted range for a precipitationparameter is likely to be artefactual, theminimum is reliable. With these resultsand considerations in mind, the methodswere applied to a series of five <strong>Quaternary</strong>assemblages.Results from Stony Creek Basin, an EarlyPleistocene lake record in central Victoria,indicates that the climate, duringperiods represented by sclerophyll dominatedpollen assemblages, was warmerand much wetter than it is today,especially in summer. The beetle assemblagelacks modern analogues andconsists of wet sclerophyll forest/rainforestmicrothermic taxa characteristicof the foothills and uplands of southernAustralia, occurring with taxa of wetsclerophyll forest/rainforest that aregenerally associated with the easternAustralian escarpment. There is theprobability of a range of extinct taxa inthe assemblages, although it is possiblethese may be extant, but uncollected.The existence of summer rainfall climatesin southern Australia in the Early Pleistocene,indicates that the switch to themodern climate system (winter dominatedrainfall) occurred later thanpreviously suspected.The assemblage from the site of YarraCreek, on King Island between the Australianmainland and Tasmania, datesfrom marine isotope stage (MIS) 5,although its exact age (MIS substage) isimpossible to ascertain with currentchronological data. The beetle assemblageis associated with a cool temperaterainforest micro- and macro-flora and,unsurprisingly, contains a range of wetsclerophyll forest and rainforestinhabiting beetle taxa. Climate estimatessuggest a summer temperature regimevery similar to the present with moresummer rainfall and similar, or more,annual precipitation. The reconstructionof winter temperatures and annual rangesuggest a more continental climate thanpresent, although this may be an artefactof the lack of modern distribution datafrom extremely maritime climates, likethat of King Island today.Spring Creek is a megafauna-containingsite that was initially believed to be lastglacial maximum in age but has beendemonstrated to be significantly older;AMS radiocarbon determinations onplant and insect macrofossils collectedduring this project showed the site to beolder than 40,000 radiocarbon years BP.The insect assemblage is associated witha pollen assemblage characterised bythe absence of trees, which would beconsidered ‘glacial’ by comparison withpollen assemblages from other sites insoutheastern Australia. Climatic reconstructionsbased on the beetle assemblagessuggest a more continental climate(warmer summers, colder winters,increased range), with rainfall similar tothe present day. Limited data from theplant macrofossil record indicates alowland flora. The caddisfly fauna is alsoof a characteristically lowland type.A small assemblage from the site of PipeClay Lagoon, in lowland eastern Tasmania,is dated to the MIS 3/2 transition.The record is dominated by aquatic andhygrophilic taxa but includes severalspecies that are today restricted to humidforests of southeastern Australia andTasmania. Climatic reconstructionssuggest summer temperature were similarto the present, possibly slightly warmer,and winter temperatures slightly colder.Somewhat surprisingly, several taxasuggest wetter summer and annualclimates, which contrasts with the generalview that last glacial, especially the latterpart of MIS 3 and MIS 2, were colder anddrier than the present. The Pipe ClayLagoon reconstruction suggests this maybe a simplistic view of this period.Finally, a late Holocene assemblage fromLake Keilambete is examined to test thepotential for Holocene climatereconstruction, in Australia, using beetleassemblages. The assemblage, recoveredfrom the edge of the receding lake, wasfound immediately below the lowermost oftwo distinctive isochronous hardpans thatoutcrop around the lake. It contains amixed assemblage of aquatic andterrestrial taxa, the terrestrial componentindicating the presence of grassland and/orgrassy woodland. Climate reconstructionssuggest temperature regimes almostidentical to the modern regime, but severaltaxa suggest slightly more summer rainfallthan presently falls.Application of the beetle-based methods to<strong>Quaternary</strong> assemblages proved the utilityof the methods developed for bothtemperature and precipitationreconstruction. The combinedreconstructions of seasonal, especiallysummer, temperature and precipitationregimes meant key questions regarding thenature of <strong>Quaternary</strong> climates wereanswered. The indications, from SpringCreek and Pipe Clay Lagoon, that glacialclimates may at least partly becharacterised by summer climates similarto those of the present is particularlysignificant. Unfortunately, the potentialinfluence of altered climate space acrossthe region on the nature of winter andtherefore annual climates means that thesignificance of winter climates indetermining the nature of glacialenvironments, especially vegetation, isunknown and potentially unknowable.• • • • •Modern fluvial process and priorlandscape history in an arid-zoneriver: Fowlers Creek, New SouthWales, AustraliaGRESLEY A. WAKELIN-KING (PhD)Department of Earth ScienceLa Trobe UniversityFowlers Creek is a small arid-zoneephemeral river. It has five fluvial styles,spread over three geomorphic subregions:the Uplands (the source of the creek’swater and sediment), the Trunk (thecentral reaches, constrained by outcrop),and the Terminal Floodout (where itdiminishes and disappears).Fowlers Creek is dominated by finesediments, including a high proportion ofmud aggregates which directly influencethe fluvial style.In the proximal Uplands, the creek is adiscontinuous ephemeral stream, showinga sequence of channel types (gully-arroyo-48 | <strong>Quaternary</strong> AUSTRALASIA <strong>24</strong> (2)
Recent Publications• Alloway, B.V.; Lowe, D.J.; Barrell, D.J.A.; Newnham, R.M..;Almond, P.C.; Augustinus, P.C.; Bertler, N.A.; Carter, L.;Litchfield, N.J.; McGlone, M.S.; Shulmeister, J.;Vandergoes, M.J.; Williams, P.W. and NZ-INTIMATEmembers <strong>2007</strong>. Towards a climate event stratigraphy forNew Zealand over the past 30,000 years (NZ-INTIMATEproject). Journal of <strong>Quaternary</strong> Science 22, 9–35.• Alloway, B.V.; Larsen, G.; Lowe, D.J.; Shane. P.A.R.;Westgate, J.A. 2006. Tephrochronology. In: Elias, S.A.(editor-in-chief) Encyclopaedia of <strong>Quaternary</strong> Science.Elsevier, London, pp. 2869–2898.• Black, M.P. & Mooney, S.D. (2006) Holocene fire historyfrom the Greater Blue Mountains World Heritage Area,New South Wales, Australia: the climate, humans and firenexus. Regional Environmental Change 6, 41–51.• Black, M.P., Mooney, S.D. & Martin, H. (2006) A >43 000year vegetation and fire history from Lake Baraba, NewSouth Wales, Australia. <strong>Quaternary</strong> Science Reviews 25,3003–3016.• Black, M.P., Mooney, S.D. & Haberle, S.G. (in press) Thefire, human and climate nexus in the Sydney Basin,eastern Australia. The Holocene.• Black, M.P. & Mooney, S.D. (<strong>2007</strong>) The response ofAboriginal burning practices to population levels and ElNiño Southern Oscillation events during the mid- to late-Holocene: a case study from the Sydney Basin usingcharcoal and pollen analysis. Australian Geographer 38,37–52.• Cupper, M.L. and Duncan, J. (2006). Last glacialmegafaunal death assemblage and early humanoccupation at Lake Menindee, southeastern Australia.<strong>Quaternary</strong> Research 66, 332–341.• Cupper, M.L. (2006). Luminescence and radiocarbonchronologies of playa sedimentation in the Murray Basin,southeastern Australia. <strong>Quaternary</strong> Science Reviews 25,2594–2607.• Fitzsimmons, K. (in press) Morphologic variability in thelinear dunefields of the Strzelecki and Tirari Deserts,Australia. Geomorphology.• Fitzsimmons, K. and Telfer, M. (in press) Complexities inthe preservation and interpretation of late <strong>Quaternary</strong> dunerecords: Examples from the Tirari Desert, Australia and thesouthwestern Kalahari, South Africa. Chilean Journal ofAnthropology (Chungará).• Fitzsimmons, K., Bowler, J., Rhodes, E., Magee, J. (<strong>2007</strong>)Relationships between desert dunes during the late<strong>Quaternary</strong> in the Lake Frome region, Strzelecki Desert,Australia. Journal of <strong>Quaternary</strong> Science, 22, 549–558.• McGregor, H.V., Dima, M., Fischer, H.W. and Mulitza, S.(<strong>2007</strong>). Rapid 20th-century increase in coastal upwelling offnorthwest Africa. Science 315, 637–639.• Newnham, R.M., Vandergoes, M.J., Garnett, M.H., Lowe,D.J., Prior, C. and Almond, P.CJ. (<strong>2007</strong>). Test of AMS 14 Cdating of pollen concentrates using tephrochronology.Journal of <strong>Quaternary</strong> Science 22, 37–51.• Prideaux, G.J., Long, J.A., Ayliffe, L.K., Hellstrom, J.C.,Pillans, B., Boles, W.E., Hutchinson, M.N., Roberts, R.G.,Cupper, M.L., Arnold, L.J., Devine, P.D. and Warburton,N.M. (<strong>2007</strong>). An arid-adapted middle Pleistocene vertebratefauna from south-central Australia. Nature 445, 422–425.• Rustomji, P., Pietsch, T. (in press). Alluvial sedimentationrates from southeastern Australia indicate post-Europeansettlement landscape recovery. Geomorphology.• Smith, R.T.; Lowe, D.J.; Wright, I.C. 2006. <strong>Vol</strong>canoes. Te Ara– The Encyclopedia of New Zealand [Online]. Updated 9 June2006. New Zealand Ministry for Culture and Heritage,Wellington.http://www.TeAra.govt.nz/EarthSeaAndSky/NaturalHazardsAndDisasters/<strong>Vol</strong>canoes/enThesis Abstracts CONTINUEDintermediate floodout). The fluvial proc -esses fluctuate around the thresholdbetween valley-floor strength and channelincision. The sediments are dominated byfloodplain muds and flat-lying sheetflowdeposits. The intermediate floodouts arepinned at tributary confluences, reflectingformation during large floods; theyare drought refugia, and are key componentsof the ecological landscape.In the mid-Uplands, the creek forms amobile-channel, unstable-floodplainassemblage. The fluvial processes arechaotic and threshold-driven, characterisedby catastrophic reach-scale channelrelocation. Sediments are a patchwork offine floodplain deposits aroundshoestring sands.In the Trunk, Fowlers Creek showscoexisting anabranching and pool-andrifflemorphologies. Fluvial characteristics(e.g. channel number, type, andcapacity, channel and floodplainroughness, hydraulic radius) are highlyvariable, indicating very complex flowdynamics.In the Terminal Floodout, the channel ismeandering, and fluvial deposits includepoint bars and overbanks. In the proximaland central Floodout fan-head autocyclicand/or underlying tectonic influencespromote channel incision as well asmeandering.Although it has been postulated that therivers of western NSW have undergone acomplete change of style as a result ofwidespread post-European erosion, thepresent study shows that the modernfluvial styles are not different from thoseof the past. Instead, severe but localisederosion along linear landscape disturbanceshas increased erosion in someparts of an already-unstable system.49 | <strong>Quaternary</strong> AUSTRALASIA <strong>24</strong> (2)
<strong>Quaternary</strong> AUSTRALASIA<strong>Quaternary</strong> Australasia publishes news, commentary, noticesof upcoming events, travel, conference and research reports, postgraduatethesis abstracts and peer-reviewed research papers ofinterest to the <strong>Australasian</strong> <strong>Quaternary</strong> research community.Cartoons, sardonic memoirs, images of mystery fossils andamusing occupational health and safety breaches also welcome.The <strong>Australasian</strong> <strong>Quaternary</strong> <strong>Association</strong> (AQUA) is an informalgroup of people interested in the manifold phenomena of the<strong>Quaternary</strong> Period. It seeks to encourage research by younger workersin particular, to promote scientific communication between Australiaand New Zealand, and to inform members of current research andpublications. It holds biennial meetings and publishes the journal<strong>Quaternary</strong> Australasia twice a year.The annual subscription is AUD$35, or AUD$25 for students,unemployed or retired persons. To apply for membership, pleasecontact Janelle Stevenson (address below). Members joining afterSeptember gain membership for the following year. Existingmembers will be sent a reminder in December.AUSTRALASIAN QUATERNARY ASSOCIATIONCommittee MembersPresident Prof. Henk HeijnisSydney Catchment AuthorityPO Box 323, Penrith NSW 2751 AustraliaPH: +61 (0) 2 4725 2513 FAX: +61 (0) 2 4725 2560President@aqua.org.auVice President Dr Peter AlmondDivision of Soil, Plant and Ecological SciencesPO Box 84 Lincoln University, Canterbury New ZealandPH: +64 3 3252 811 FAX: +64 3 3253 607VicePresident@aqua.org.auTreasurer Dr Janelle StevensonDepartment of Archaeology and Natural HistoryResearch School of Pacific and Asian StudiesAustralian National University Canberra ACT 0200 AustraliaPH: +61 (0) 2 6125 3153 FAX: +61 (0) 3 2 61254917Treasurer@aqua.org.auSecretary Dr Stuart PearsonLand & Water Australia GPO Box 2182 Canberra ACT 2601Level 1, 86 <strong>No</strong>rthbourne Ave Braddon ACT 2612 AustraliaPH: (02) 6263 6008 FAX: (02) 6263 6099Secretary@aqua.org.auInformation Technology Editor Dr Timothy T. BarrowsDepartment of Nuclear PhysicsResearch School of Physical Sciences and EngineeringThe Australian National University Canberra, ACT, 0200 AustraliaPH: +61 (0)2 6125 2077ITeditor@aqua.org.au<strong>Quaternary</strong> Australasia Editor Ms Kathryn FitzsimmonsDepartment of Earth and Marine SciencesThe Australian National University Canberra ACT 0200 AustraliaPH: +61 (0) 2 6125 2059 FAX: +61 (0) 2 6125 5544Editor@aqua.org.auPublic Officer Dr Matt CupperSchool of Earth Sciences The University of MelbourneMelbourne, Victoria 3010 AustraliaPH: +61 (0)3 8344 6521 FAX: +61 (0)3 8344 7761cupper@unimelb.edu.auDesign: Ian Robertson Graphic Art & Design. Printing: Paragon Printers, Canberra