

Recent Trends in HIV-Related Knowledge and ... - Measure DHS
Recent Trends in HIV-Related Knowledge and ... - Measure DHS
Recent Trends in HIV-Related Knowledge and ... - Measure DHS

Create successful ePaper yourself
Turn your PDF publications into a flip-book with our unique Google optimized e-Paper software.
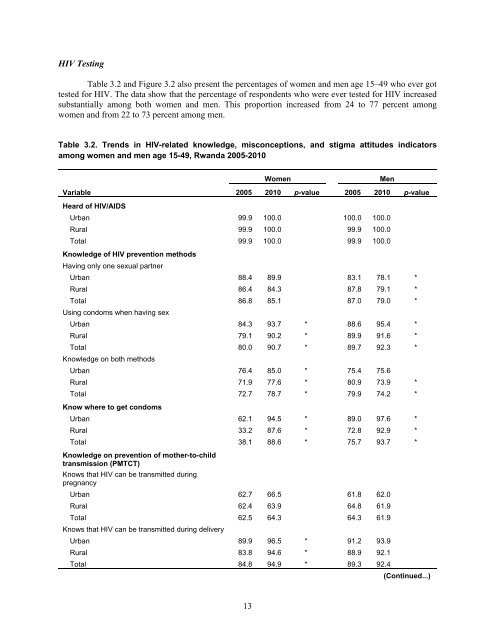
<strong>HIV</strong> Test<strong>in</strong>gTable 3.2 <strong>and</strong> Figure 3.2 also present the percentages of women <strong>and</strong> men age 15–49 who ever gottested for <strong>HIV</strong>. The data show that the percentage of respondents who were ever tested for <strong>HIV</strong> <strong>in</strong>creasedsubstantially among both women <strong>and</strong> men. This proportion <strong>in</strong>creased from 24 to 77 percent amongwomen <strong>and</strong> from 22 to 73 percent among men.Table 3.2. <strong>Trends</strong> <strong>in</strong> <strong>HIV</strong>-related knowledge, misconceptions, <strong>and</strong> stigma attitudes <strong>in</strong>dicatorsamong women <strong>and</strong> men age 15-49, Rw<strong>and</strong>a 2005-2010WomenMenVariable2005 2010 p-value 2005 2010 p-valueHeard of <strong>HIV</strong>/AIDSUrban 99.9 100.0 100.0 100.0Rural 99.9 100.0 99.9 100.0Total 99.9 100.0 99.9 100.0<strong>Knowledge</strong> of <strong>HIV</strong> prevention methodsHav<strong>in</strong>g only one sexual partnerUrban 88.4 89.9 83.1 78.1 *Rural 86.4 84.3 87.8 79.1 *Total 86.8 85.1 87.0 79.0 *Us<strong>in</strong>g condoms when hav<strong>in</strong>g sexUrban 84.3 93.7 * 88.6 95.4 *Rural 79.1 90.2 * 89.9 91.6 *Total 80.0 90.7 * 89.7 92.3 *<strong>Knowledge</strong> on both methodsUrban 76.4 85.0 * 75.4 75.6Rural 71.9 77.6 * 80.9 73.9 *Total 72.7 78.7 * 79.9 74.2 *Know where to get condomsUrban 62.1 94.5 * 89.0 97.6 *Rural 33.2 87.6 * 72.8 92.9 *Total 38.1 88.6 * 75.7 93.7 *<strong>Knowledge</strong> on prevention of mother-to-childtransmission (PMTCT)Knows that <strong>HIV</strong> can be transmitted dur<strong>in</strong>gpregnancyUrban 62.7 66.5 61.8 62.0Rural 62.4 63.9 64.8 61.9Total 62.5 64.3 64.3 61.9Knows that <strong>HIV</strong> can be transmitted dur<strong>in</strong>g deliveryUrban 89.9 96.5 * 91.2 93.9Rural 83.8 94.6 * 88.9 92.1Total 84.8 94.9 * 89.3 92.4(Cont<strong>in</strong>ued...)13


![Obtaining Informed Consent for HIV Testing [QRS4] - Measure DHS](https://img.yumpu.com/49850117/1/190x245/obtaining-informed-consent-for-hiv-testing-qrs4-measure-dhs.jpg?quality=85)


