

Recent Trends in HIV-Related Knowledge and ... - Measure DHS
Recent Trends in HIV-Related Knowledge and ... - Measure DHS
Recent Trends in HIV-Related Knowledge and ... - Measure DHS

Create successful ePaper yourself
Turn your PDF publications into a flip-book with our unique Google optimized e-Paper software.
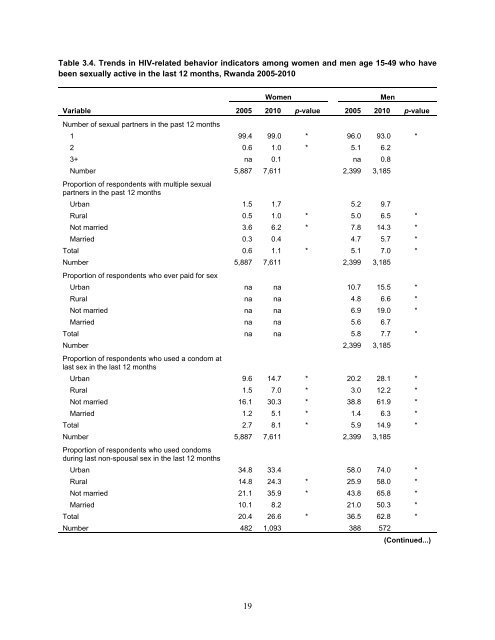
Table 3.4. <strong>Trends</strong> <strong>in</strong> <strong>HIV</strong>-related behavior <strong>in</strong>dicators among women <strong>and</strong> men age 15-49 who havebeen sexually active <strong>in</strong> the last 12 months, Rw<strong>and</strong>a 2005-2010VariableNumber of sexual partners <strong>in</strong> the past 12 monthsWomenMen2005 2010 p-value 2005 2010 p-value1 99.4 99.0 * 96.0 93.0 *2 0.6 1.0 * 5.1 6.23+ na 0.1 na 0.8Number 5,887 7,611 2,399 3,185Proportion of respondents with multiple sexualpartners <strong>in</strong> the past 12 monthsUrban 1.5 1.7 5.2 9.7Rural 0.5 1.0 * 5.0 6.5 *Not married 3.6 6.2 * 7.8 14.3 *Married 0.3 0.4 4.7 5.7 *Total 0.6 1.1 * 5.1 7.0 *Number 5,887 7,611 2,399 3,185Proportion of respondents who ever paid for sexUrban na na 10.7 15.5 *Rural na na 4.8 6.6 *Not married na na 6.9 19.0 *Married na na 5.6 6.7Total na na 5.8 7.7 *Number 2,399 3,185Proportion of respondents who used a condom atlast sex <strong>in</strong> the last 12 monthsUrban 9.6 14.7 * 20.2 28.1 *Rural 1.5 7.0 * 3.0 12.2 *Not married 16.1 30.3 * 38.8 61.9 *Married 1.2 5.1 * 1.4 6.3 *Total 2.7 8.1 * 5.9 14.9 *Number 5,887 7,611 2,399 3,185Proportion of respondents who used condomsdur<strong>in</strong>g last non-spousal sex <strong>in</strong> the last 12 monthsUrban 34.8 33.4 58.0 74.0 *Rural 14.8 24.3 * 25.9 58.0 *Not married 21.1 35.9 * 43.8 65.8 *Married 10.1 8.2 21.0 50.3 *Total 20.4 26.6 * 36.5 62.8 *Number 482 1,093 388 572(Cont<strong>in</strong>ued...)19


![Obtaining Informed Consent for HIV Testing [QRS4] - Measure DHS](https://img.yumpu.com/49850117/1/190x245/obtaining-informed-consent-for-hiv-testing-qrs4-measure-dhs.jpg?quality=85)


