Topographic Maps Key.pdf
Topographic Maps Key.pdf
Topographic Maps Key.pdf

You also want an ePaper? Increase the reach of your titles
YUMPU automatically turns print PDFs into web optimized ePapers that Google loves.
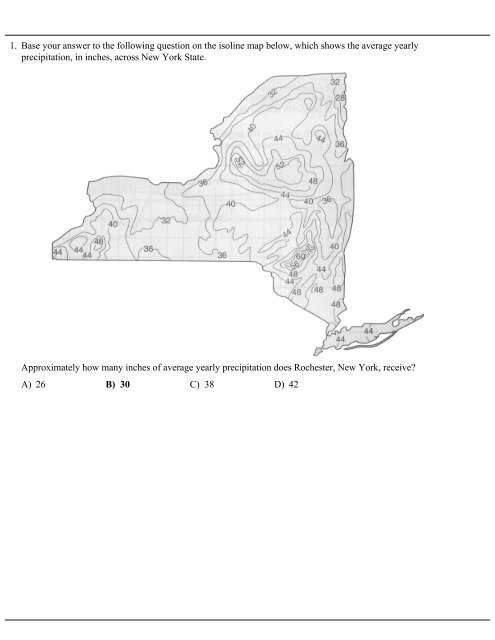
1. Base your answer to the following question on the isoline map below, which shows the average yearlyprecipitation, in inches, across New York State.Approximately how many inches of average yearly precipitation does Rochester, New York, receive?A) 26 B) 30 C) 38 D) 42
2. Base your answer to the following question on Thetopographic map below shows a hill. Points X and Yrepresent locations on the hill’s surface. Elevations areshown in meters.What is the gradient between points X and Y?A) 40 m/km B) 80 m/kmC) 100 m/km D) 120 m/km
3. Base your answer to the following question onthe topographic map below. Points A through I are locations on the map. Elevations are shown in meters.Which locations have the same elevation?A) A and C B) B and E C) C and I D) F and G
4. Base your answer to the following question on The contour map below shows elevations recorded in meters.Line AB is a reference line on the map.Which graph best represents the profile from point A to point B?A) B)C) D)
5. Base your answer to the following question on Thetopographic map below shows a stream crossing severalcontour lines and passing through points X and Y.Elevations are measured in feet.What is the approximate gradient between point X andpoint Y?A) 10 ft/mi B) 20 ft/miC) 40 ft/mi D) 80 ft/mi6. Base your answer to the following question on Thetopographic map below shows the location of a stream.Points A and B are locations on Earth’s surface.What is the gradient between points A and B?A) 1 m/km B) 2 m/kmC) 10 m/km D) 20 m/km
7. Base your answer to the following question on the contour map below, which shows a hill formed by glacialdeposition near Rochester, New York. Letters A through E are reference points. Elevations are in feet.Which description best compares the gradients of this hill?A) AE and EB have the same gradient. B) AE has a steeper gradient than EB.C) CE has a steeper gradient than ED. D) CE and AE have the same gradient.8. Base your answer to the following question on Thetopographic map below shows part of a stream.9. Base your answer to the following question on Point X isa location on the topographic map below. Elevations aremeasured in meters.What is a possible elevation, in meters, of point X?A) 55 B) 57 C) 68 D) 70In which general direction is the stream flowing?A) northeast B) northwestC) southeast D) southwest
10. The topographic map below shows a lake and tworivers.In which direction does each of the rivers flow?A) The Sapphire River and the Garnet River bothflow east.B) The Sapphire River and the Garnet River both flowwest.C) The Sapphire River flows east and the GarnetRiver flows west.D) The Sapphire River flows west and the GarnetRiver flows east.
Base your answers to questions 11 through 13 on the topographic map below. Elevations are in feet. PointA and B are locations on the map.11. What evidence can be used to determine that the land surface in the northeast corner of the map isrelatively flat?A) a rapidly flowing river B) a large region covered by waterC) the dark contour line labeled 300 D) the absence of many contour lines
12. Which graph best represents the profile along line AB?A) B)C) D)13. Toward which direction does the Green River flow?A) northeast B) northwest C) southeast D) southwest
14. Base your answer to the following question on the topographic map below. Points A, B, C, D, and Xrepresent locations on the map. Elevations are measured in feet.Which cross section best represents the profile along straight line AB?A) B)C) D)
15. On each topographic map below, the straight-linedistance from point A to point B is 5 kilometers. Whichtopographic map shows the steepest gradient between Aand B?A) B)C) D)
16. The field map below shows air temperature measurements, in degrees Celsius, taken at the same elevationwithin a closed room. Two reference points, A and B, are shown.Which temperature field map shows correctly drawn isotherms?A) B)C) D)
Base your answers to questions 17 through 19 on the topographic map below. Points X, Y, and Z arelocations on the map. Elevations are expressed in meters.17. Mill River generally flows toward theA) southeast B) southwest C) northeast D) northwest18. What is the elevation of point Z?A) 190 m B) 220 m C) 240 m D) 250 m19. Which profile best represents the topography along the dashed line from point X to point Y?A) B)C) D)
20. Base your answer to the following question on Acontour map is shown below. Elevations are shown infeet.What is the contour interval of this map?A) 10 ft B) 15 ft C) 20 ft D) 25 ft
Base your answers to questions 21 through 24 on the topographic map below that represents a location inNorth America. A grid system of letters and numbers along the edges of the map is provided to assist infinding locations. Elevations are expressed in feet.21. Which profile best represents the topography along a straight line from point Z ( 6-B ) to point Y ( 2-M)?A) B)C) D)22. What is a possible elevation at point X (grid location 3-D)?A) 488 ft B) 548 ft C) 558 ft D) 598 ft23. If a person at point W (grid location 2-B ) travels uphill, in which direction is the person traveling?A) northwest B) northeast C) southwest D) southeast24. What is the approximate elevation at grid location 7-I?A) 140 ft B) 170 ft C) 200 ft D) 230 ft
25. Base your answer to the following question on the contour map of an island below. Points A through Grepresent locations on the island. Elevations are in meters.In which direction does the Cinder River flow?A) southeast B) southwest C) northeast D) northwest
Answer <strong>Key</strong>Regents Prep-<strong>Topographic</strong> <strong>Maps</strong>1. B2. A3. C4. D5. C6. C7. B8. C9. B10. A11. D12. C13. B14. A15. D16. D17. C18. B19. B20. C21. A22. B23. D24. B25. D