Uses and abuses of logarithmic axes - GraphPad Software
Uses and abuses of logarithmic axes - GraphPad Software
Uses and abuses of logarithmic axes - GraphPad Software

Create successful ePaper yourself
Turn your PDF publications into a flip-book with our unique Google optimized e-Paper software.
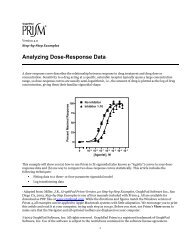
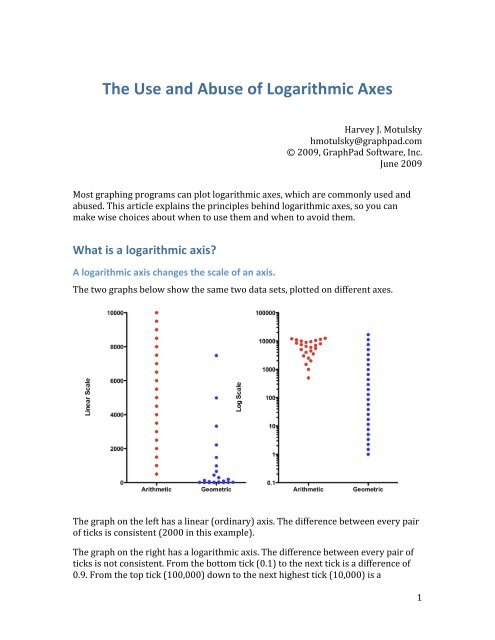
The Use <strong>and</strong> Abuse <strong>of</strong> Logarithmic AxesHarveyJ.Motulskyhmotulsky@graphpad.com©2009,<strong>GraphPad</strong>S<strong>of</strong>tware,Inc.June2009Mostgraphingprogramscanplot<strong>logarithmic</strong><strong>axes</strong>,whicharecommonlyused<strong>and</strong>abused.Thisarticleexplainstheprinciplesbehind<strong>logarithmic</strong><strong>axes</strong>,soyoucanmakewisechoicesaboutwhentousethem<strong>and</strong>whentoavoidthem.What is a <strong>logarithmic</strong> axis?A <strong>logarithmic</strong> axis changes the scale <strong>of</strong> an axis.Thetwographsbelowshowthesametwodatasets,plottedondifferent<strong>axes</strong>.Thegraphonthelefthasalinear(ordinary)axis.Thedifferencebetweeneverypair<strong>of</strong>ticksisconsistent(2000inthisexample).Thegraphontherighthasa<strong>logarithmic</strong>axis.Thedifferencebetweeneverypair<strong>of</strong>ticksisnotconsistent.Fromthebottomtick(0.1)tothenexttickisadifference<strong>of</strong>0.9.Fromthetoptick(100,000)downtothenexthighesttick(10,000)isa 1
difference<strong>of</strong>90,000).Whatisconsistentistheratio.Eachaxistickrepresentsavaluetenfoldhigherthantheprevioustick.Thereddotsplotadatasetwithequallyspacedvalues.EachdotrepresentsavaluewithaYvalue500higherthanthedotbelow.Thedotsareequallyspacedonthegraphontheleft,butfarfromequallyspacedonthegraphontheright.Topreventoverlap,thepointsarejitteredtotheright<strong>and</strong>leftsotheydon'toverlap.Thehorizontalposition<strong>of</strong>thereddotshasnoothermeaning.ThebluedotsrepresentadatasetwhereeachvaluerepresentsaYvalue1.5timeshigherthantheonebelow.Onthegraphontheleft,thelowervaluesarealmostsuperimposed,makingitveryhardtoseethedistribution<strong>of</strong>values(evenwithhorizontaljittering).Onthegraphontherightwitha<strong>logarithmic</strong>axis,thepointsappearequallyspaced.Interpolating between log ticksWhatvalueishalfwaybetweenthetickfor10<strong>and</strong>theonefor100?Yourfirstguessmightbetheaverage<strong>of</strong>thosetwovalues,55.Butthatiswrong.Valuesarenotequallyspacedona<strong>logarithmic</strong>axis.Thelogarithm<strong>of</strong>10is1.0,<strong>and</strong>thelogarithm<strong>of</strong>100is2.0,sothelogarithm<strong>of</strong>themidpointis1.5.Whatvaluehasalogarithm<strong>of</strong>1.5?Theansweris10 1.5 ,whichis31.62.Sothevaluehalfwaybetween10<strong>and</strong>100ona<strong>logarithmic</strong>axisis31.62.Similarly,thevaluehalfwaybetween100<strong>and</strong>1000ona<strong>logarithmic</strong>axisis316.2.Why “<strong>logarithmic</strong>”?Intheexampleabove,theticksat1,10,100,1000areequallyspacedonthegraph.Thelogarithms<strong>of</strong>1,10,100<strong>and</strong>1000are0,1,2,3,whichareequallyspacedvalues.Sincevaluesthatareequallyspacedonthegraphhavelogarithmsthatareequallyspacednumerically,thiskind<strong>of</strong>axisiscalleda“<strong>logarithmic</strong>axis”.LingoThetermsemilogisusedtorefertoagraphwhereoneaxisis<strong>logarithmic</strong><strong>and</strong>theotherisn’t.Whenboth<strong>axes</strong>are<strong>logarithmic</strong>,thegraphiscalledaloglog plot.Other BasesAllthelogarithmsshownabovearecalledbase10logarithms,becausethecomputationstake10tosomepower.Thesearealsocalledcommonlogarithms.Mathematiciansprefernaturallogarithms,usingbasee(2.7183...).Buttheydon’tseemverynaturaltoscientists,<strong>and</strong>arerarelyusedasanaxisscale.Abase2logarithmisthenumber<strong>of</strong>doublingsittakestoreachavalue,<strong>and</strong>thisiswidelyusedbycellbiologists<strong>and</strong>immunologists.Ifyoustartwith1<strong>and</strong>doubleitfourtimes(2,4,8,<strong>and</strong>16),theresultis16,sothelogbase2<strong>of</strong>16is4. 2
<strong>GraphPad</strong>Prismcanplotlog2<strong>axes</strong>.Choosefromtheupperleftcorner<strong>of</strong>theFormatAxisdialog.Logarithmic <strong>axes</strong> cannot contain zero or negative numbersThe logarithms <strong>of</strong> negative numbers <strong>and</strong> zero are simply not definedLet’sstartwiththefundamentaldefinition<strong>of</strong>alogarithm.If10 L =Z,thenListhelogarithm(base10)<strong>of</strong>Z.IfLisanegativevalue,thenZisapositivefractionlessthan1.0.IfLiszero,thenZequals1.0.IfLisgreaterthan0,thenZisgreaterthan1.0.Notethattherenovalue<strong>of</strong>Lwillresultinavalue<strong>of</strong>Zthatiszeroornegative.Logarithmsaresimplynotdefinedforzeroornegativenumbers.Thereforea<strong>logarithmic</strong>axiscanonlyplotpositivevalues.Theresimplyisnowaytoputnegativevaluesorzeroona<strong>logarithmic</strong>axis.A trick to plot zero on a <strong>logarithmic</strong> axis in PrismIfyoureallywanttoincludezeroona<strong>logarithmic</strong>axis,you’llneedtobeclever.Don’tenter0,insteadenterasasmallnumber.Forexample,ifthesmallestvalueinyourdatais0.01,enterthezerovalueas0.001.ThenusetheFormatAxisdialogtocreateadiscontinuousaxis,<strong>and</strong>usetheAdditionalticksfeature<strong>of</strong>Prismtolabelthatspotontheaxisas0.0. 3
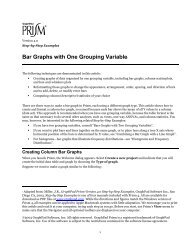
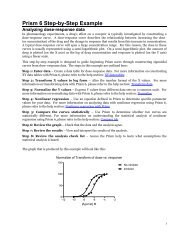
Logarithmic <strong>axes</strong> on bar graphs are misleadingThewholepoint<strong>of</strong>abargraphisthattherelativeheight<strong>of</strong>thebarstellsyouabouttherelativevaluesplotted.Inthegraphbelow,onebarisfourtimesastallastheother<strong>and</strong>onevalue(800)isfourtimestheother(200). 4
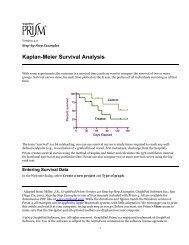
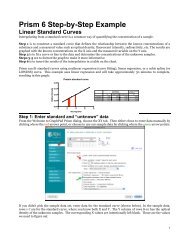
Sincezerocan’tbeshownonalogaxis,thechoice<strong>of</strong>astartingplaceisarbitrary.Accordingly,therelativeheight<strong>of</strong>twobarsisnotdirectlyrelatedtotheirrelativevalues.Thegraphsbelowshowthesamedataasthegraphabove,butwiththreedifferentchoicesforwheretheaxisbegins.Thisarbitrarychoiceinfluencestherelativeheight<strong>of</strong>thetwobars,amplifiedinthegraphontheleft<strong>and</strong>minimizedinthegraphontheright.Ifthegoalistocreatepropag<strong>and</strong>a,abargraphusinga<strong>logarithmic</strong>axisisagreattool,asitletsyoueitherexaggeratedifferencesbetweengroupsorminimizethem.Allyouhavetodoiscarefullychoosetherange<strong>of</strong>youraxis.Don’tcreatebargraphsusinga<strong>logarithmic</strong>axisifyourgoalistohonestlyshowthedata.When to use a <strong>logarithmic</strong> axisA <strong>logarithmic</strong> X axis is useful when the X values are <strong>logarithmic</strong>ally spacedTheX‐axisusuallyplotstheindependentvariable–thevariableyoucontrol.IfyouchoseXvaluesthatareconstantratios,ratherthanconstantdifferences,thegraphwillbeeasiertoviewona<strong>logarithmic</strong>axis.Thetwographsbelowshowthesamedata.Xisdose,<strong>and</strong>Yisresponse.Thedoseswerechosensoeachdoseistwicethepreviousdose.Whenplottedwithalinearaxis(left)many<strong>of</strong>thevaluesaresuperimposed<strong>and</strong>itishardtoseewhat’sgoingon. 5
Witha<strong>logarithmic</strong>axis(right),thevaluesareequallyspacedhorizontally,makingthegrapheasiertounderst<strong>and</strong>.A <strong>logarithmic</strong> axis is useful for plotting ratiosRatiosareintrinsicallyasymmetrical.Aratio<strong>of</strong>1.0meansnochange.Alldecreasesareexpressedasratiosbetween0.0<strong>and</strong>1.0,whileallincreasesareexpressedasratiosgreaterthan1.0(withnoupperlimit).Onalogscale,incontrast,ratiosaresymmetrical.Aratio<strong>of</strong>1.0(nochange)ishalfwaybetweenaratio<strong>of</strong>0.5(halftherisk)<strong>and</strong>aratio<strong>of</strong>2.0(twicetherisk).Thus,plottingratiosonalogscale(asshownbelow)makesthemeasiertointerpret.Thegraphbelowplotsoddsratiosfromthreecase‐controlretrospectivestudies,butanyratiocanbenefitfrombeingplottedonalogaxis.Thegraphabovewascreatedwiththeoutcome(theoddsratio)plottedhorizontally.Sincethesevaluesaresomethingthatwasdetermined(notsomethingsetbytheexperimenter),thehorizontalaxisis,essentially,theY‐axiseventhoughitishorizontal.A <strong>logarithmic</strong> axis linearizes compound interest <strong>and</strong> exponential growthThegraphsbelowplotexponentialgrowth,whichisequivalenttocompoundinterest.Attime=0.0,theYvalueequals100.Foreachincrement<strong>of</strong>1.0ontheX 6
axis,thevalueplottedontheYaxisequals1.1timesthepriorvalue.Thisisthepattern<strong>of</strong>cellgrowth(withplenty<strong>of</strong>space<strong>and</strong>nutrients),<strong>and</strong>isalsothepatternbywhichaninvestment(ordebt)growsovertimewithaconstantinterestrate.Thegraphontherightisidenticaltotheoneontheleft,exceptthattheYaxishasa<strong>logarithmic</strong>scale.Onthisscale,exponentialgrowthappearsasastraightline.Exponentialgrowthhasaconstantdoublingtime.Forthisexample,theYvalue(cellcount,value<strong>of</strong>investment…)doublesforeverytimeincrement<strong>of</strong>7.2657.An exponential decay curve is linear on a <strong>logarithmic</strong> axis, but only when itdecays to zeroThegraphsbelowshowexponentialdecaydowntoabaseline<strong>of</strong>zero.Thiscouldrepresentradioactivedecay,drugmetabolism,ordissociation<strong>of</strong>adrugfromareceptor.Thehalf‐lifeisconsistent.Forthisexample,thehalf‐lifeis3.5minutes.Thatmeansthatattime=3.5minutes,thesignalishalfwhatitwasattimezero.Attime=7.0minutes,thesignalhascutinhalfagain,to25%<strong>of</strong>theoriginal.Bytime=10.5minutes,ithasdecayedagaintohalfwhatitwasattime=7.5minutes,whichisdownto12.5%<strong>of</strong>theoriginalvalue. 7
Notethatwhenanexponentialdissociationcurveplateausatavalueotherthanzero,itwillnotbelinearona<strong>logarithmic</strong>axis.Thegraphontherightbelowhasa<strong>logarithmic</strong>Yaxis,buttheexponentialdecay(greencurve)isnotastraightline.Lognormal distributionsPlotting lognormal distributions on a <strong>logarithmic</strong> axisThetwographsbelowplotthesame50values.Thegraphonthelefthasalinear(ordinary)Yaxis,whilethegraphontherighthasa<strong>logarithmic</strong>scale.Thedataaresampledfromalognormaldistribution,whichisveryasymmetrical. 8
Whenshownonalinearscale(graphontheleft),itisimpossibletoreallygetasense<strong>of</strong>thedistribution,sinceabouthalf<strong>of</strong>thevaluesareplottedinpileatthebottom<strong>of</strong>thegraph.Anotherproblemisthatifyousawonlythegraphontheleft,youmightthinkthehighestfourvaluesareoutliers,sincetheyseemtobes<strong>of</strong>arfromtheothers.Whenplottedwitha<strong>logarithmic</strong>axis,thedistributionappearssymmetrical,thehighestpointsdon’tseemout<strong>of</strong>place,<strong>and</strong>youcanseeallthepoints.Thesedatacomefromalognormaldistribution.Thatmeansthatthelogarithms<strong>of</strong>valuesfollowaGaussi<strong>and</strong>istribution.Plottingsuchvaluesona<strong>logarithmic</strong>plotmakesthedistributionmoresymmetrical<strong>and</strong>easiertounderst<strong>and</strong>.The mean <strong>and</strong> geometric meanThegraphsbelowshowthesamedata,<strong>and</strong>alsoshowthemean<strong>and</strong>geometricmean.Thegeometricmeaniscomputedbyfirsttransformingallthevaluestologarithms,findingthemean<strong>of</strong>thoselogarithms,<strong>and</strong>thenreversetransformingthatmeanbacktotheoriginalunits.Withanasymmetricaldistribution,themean<strong>and</strong>geometricmeancanbequitedifferentasshownhere.Whenplottedonalogscale(right),themeanisnotnearthemiddle<strong>of</strong>thedata.Thatisbecausethepointsabovethemeanhavemuchlargervaluessobringupthemeanvalue.Ona<strong>logarithmic</strong>axis,thegeometricmeanisnearthemiddle<strong>of</strong>thedistribution.Thisgraphshowsthattheconcept<strong>of</strong>anaverageormeanissomewhatambiguouswhendataareplottedona<strong>logarithmic</strong>axis.Doyoumeanthemean<strong>of</strong>theactualvalues,orthemean<strong>of</strong>thelogarithms(thegeometricmean)?Because<strong>of</strong>this 9
ambiguity,considershowingthemedianinstead.Forthesedata,themeanis1541.3,thegeometricmeanis141.2,<strong>and</strong>themedianis116.3Displaying variability on a lognormal distributionsIntheexampleabove,thest<strong>and</strong>arddeviation(SD)is4930.TherangethatcoversameanplusorminusoneSD,therefore,extendsfrom1541–4930to1541+4930,whichisfrom‐3389to6741.Thisrangecannotbeplottedona<strong>logarithmic</strong>axis,becausesuchanaxiscannotincludenegativevaluesOnealternativeistocomputeageometric st<strong>and</strong>ard deviation,butthesearenot<strong>of</strong>tenused(muchlessthangeometricmeans)<strong>and</strong>aretrickytounderst<strong>and</strong>.Fordisplaypurposes,ifyouarenotgoingtographeveryindividualvalueasonthegraphsabove,abox‐<strong>and</strong>‐whiskersplotasshownbelowdoesagreatjob<strong>of</strong>showingvariation.Theboxextendsfromthe25 th to75 th percentiles,withalineatthemedian(50 th percentile).Thewhiskers,onthisgraph,godowntothesmallestvalue<strong>and</strong>uptothelargestvalue(alternativedefinitionsare<strong>of</strong>tenused).Again,thegraphiseasytounderst<strong>and</strong>whena<strong>logarithmic</strong>axisisused(right)butisnotveryhelpfulwithalinearaxis. 10
Distinguish using a <strong>logarithmic</strong> axis from plotting logarithmsRegression fits the data, not the graphBecarefulwhenyoufitacurvetodatawitha<strong>logarithmic</strong>axis.Whenyoufitacurvewithnonlinearregression(oralinewithlinearregression),youfitamodel(equation)thatdefinesYasafunction<strong>of</strong>X.Choosingtostretcheitheraxistoa<strong>logarithmic</strong>scaledoesnotchangeanyvalues.Thetwographsbelowplotthesamedata.Thecurveintheleftgraphwascreatedbyusingnonlinearregressiont<strong>of</strong>itanexponentialdecaycurve.Thatcurveisalsoshownonthegraphontheright.Witha<strong>logarithmic</strong>axis,anexponentialcurvedecayingtozerolooksstraight.Sincethegraphontherightlookslikeastraightline,youmightbetemptedt<strong>of</strong>itthedatawithlinearregression,ratherthanfittinganexponentialdecaymodelusingnonlinearregression.Thegraphsbelowshowswhathappenswhenyoufitlinearregressiontothosedata.Onalinearaxis(left),thelinearregressionlineindeedlookslikealine.Ona<strong>logarithmic</strong>axisincontrast(right),thelinearregressionlineappearscurved.Linearregression(<strong>and</strong>nonlinearregression)fitthedata,notthegraph.NotethatfourpointshavenegativeYvalues,<strong>and</strong>thesearesimplyomittedfromthegraphontheright. 11
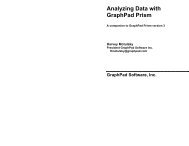
Use antilog or powers‐<strong>of</strong>‐ten numbering when plotting values that are logsPrism’sbuilt‐indose‐responseequationsallassumethattheXvaluesarelogarithms<strong>of</strong>dosesorconcentrations.EnteringtheXvaluesasconcentrationsordoses,<strong>and</strong>thenstretchingtheaxistoa<strong>logarithmic</strong>scaleisnotthesameatall.ThatapproachdoesnotchangetheXvalues.ImaginethattheXvaluesrangefrom1to10,000,<strong>and</strong>youwantt<strong>of</strong>itadoseresponsecurveusingPrism’sbuilt‐inequations.Don’tusea<strong>logarithmic</strong>axis.Instead,transformthevaluestologarithms(eitherbeforeenteringthedata,orusingPrism’sTransformanalysis),<strong>and</strong>plotthese(whicharelogarithms)onalinearaxis.AftertransformingtheXvalueswillrangefrom0to5,<strong>and</strong>theXaxiswilllooklikethetopexamplebelow.Prismletsyouformattheaxistoshowtheoriginalvalues(doses)ratherthanthetransformedvalues(logarithms<strong>of</strong>doses).Thethree<strong>axes</strong>aboveallhavethesame 12
ange(0to5).Thefirstaxishasdecimalnumbering,thesecondaxishasantilognumbering,<strong>and</strong>thethirdaxisusespowers‐<strong>of</strong>‐tennumbering.ThescreenshotshowshowtoselecttheseontheFormatAxisdialog.Notethatthebottomtwo<strong>axes</strong>havenotbeenstretchedtoalogarithmscale.Onlythenumbershavebeenwritteninalternativeformats.Eventhoughthetop<strong>of</strong>theaxisislabeled10,000or10 5 ,thecorrespondingvalueonthegraphactuallyisY=5.Avalue<strong>of</strong>Y=10,000wouldbeway<strong>of</strong>fscale,unlessyoutransformeditfirst. 13